

Engineering intelligence platforms measure delivery, but 2026 buyers also weigh AI-effort attribution. Compare the tools and how to choose one.
How software engineering intelligence connects Jira, Git, and time logs into one dataset

Key Takeaways
Software engineering intelligence platforms gather data from repositories, pipelines, issue trackers, and time logs to report on how software gets built
Most platforms in the category measure delivery performance, flow, developer experience, and investment allocation
Jira cycle time and velocity describe past throughput shaped by incidents, on-call rotations, and meetings the next sprint won't repeat
AI coding tools leave their record in the editor, not the issue, so AI spend comes to the board with no attribution behind it
The board asks: What did the Copilot rollout return? You look at vendor invoices on one side and a Jira board on the other, but no line connects them.
Software engineering intelligence platforms exist to answer that question by combining Jira, Git, CI/CD, and time-log signals into a single dataset.
This guide covers what these platforms measure, where Jira data on its own falls short, and how AI spend gets attributed to the work it delivered.
Software engineering intelligence (SEI) is a category of platform that pulls data from the systems your engineering teams already use and reports on how software gets built and delivered.
These platforms link to Git repositories, CI/CD pipelines, issue trackers, and communication tools. They take data from each one and display it on dashboards and in reports. Gartner refers to the same category as developer productivity insight platforms.
In the past, engineering managers relied on custom spreadsheets and status meetings. An SEI platform replaces them with a standing data stream.
These platforms produce four families of signals. Coverage varies by vendor, and few cover all four with equal depth.
Delivery performance: Most platforms build on the DORA and SPACE frameworks. DORA covers deployment frequency, lead time for changes, change failure rate, and time to restore service. These signals describe how reliably code reaches production.
Flow and activity: Coding time, review time, and merge frequency read as indicators of team health. Version control supplies commit frequency, code churn, and merge request sizes. Issue tracking supplies time to resolve, backlog growth, and sprint velocity.
Developer experience: Some platforms pair tool data with survey responses from engineers, which covers both what the systems record and what the work feels like to the people doing it.
Investment and cost allocation: This family maps engineering effort to initiatives, measures AI coding tool contribution, and produces R&D capitalization reporting for finance.
Each signal family draws on a different system, which is why coverage varies so widely between vendors.
Version control and CI/CD supply delivery and flow data. Issue trackers supply planning and status data. Time-tracking tools supply the hours behind both. Developer surveys supply the qualitative layer.
A platform reading only repositories and pipelines will report delivery health accurately and say nothing about capacity or cost. One that reads time logs alongside ticket data can report all four. Ask any vendor which systems they read before asking what they report.
DORA metrics measure delivery health at the pipeline level. They help you understand if software ships safely and quickly. Software engineering intelligence uses the same data to plan. The difference is that it links delivery health to available hours, cost, and quarterly commitment. A leader can then make a resourcing decision rather than read a scorecard.
Both matter. DORA tells you how the pipeline performs. Software engineering intelligence tells you whether the plan built on that pipeline holds.
Self-reported status updates expose several vulnerabilities. Engineering organizations adopt software engineering intelligence to solve them. Here are the main benefits of connecting an SEI platform to your engineering stack.
On most engineering teams, risk surfaces when a manager decides to raise it. Self-reported risk carries two structural problems. The manager has to see the risk first. That means comparing current burn against the commitment, a calculation most managers run informally. Self-reporting also happens late, once the signal is impossible to ignore, by which point the replanning options have shrunk.
An SEI platform generates a signal when actuals diverge from commitments. That timing moves risk detection into the part of the quarter where replanning still works.
Quarterly planning uses headcount as the proxy for capacity against a high-capacity target. Ten engineers committed at a high percentage equals a set number of planned hours on paper. Incident load, on-call rotations, meetings, and context-switching all draw down those hours, and none of them appear in the plan.
An SEI platform reads time logs alongside ticket data and converts the plan into hours the team has left rather than heads assigned. Every incident and on-call shift lands against that number as it happens. Leaders see remaining capacity fall during the quarter instead of learning at quarter-end that the commitment was never reachable.
Many engineering organizations have moved Cursor and Copilot from pilot to broad rollout. Leadership then asks the obvious next question. Does it work?
Teams usually start by pulling Jira cycle time, which rarely answers it. Repository analysis gets closer, since AI-assisted work happens in the integrated development environment (IDE) first. Neither one produces the work-item-level attribution finance needs to classify AI tool spend as CapEx or OpEx.
An SEI platform provides that work-item-level attribution by reading IDE and tool activity alongside Jira and time-log data. It attaches AI tool usage to the specific ticket it contributed to, and to the initiative that ticket belongs to, next to the human hours logged against the same work. Finance gets a defensible basis for classification, and engineering leadership gets a blended view of how last sprint's delivery was produced.
Time logged against Jira issues, tagged to accounts and projects, provides the traceability CapEx and OpEx classification needs at the work-item level. Without it, capitalization happens through manual reconstruction at quarter-end. Engineers try to remember what they built, and managers try to pigeonhole it.
One engineering leader called out the exposure explicitly. A Jira field is just data a project manager can overwrite at will, and auditors know it. When the investment data flows from time already logged instead, an auditor has no reason to challenge the classification.
According to Tempo's 2026 State of SPM research, a survey of 667 planning and PMO leaders across 43 countries, high-maturity planning teams report good or complete visibility into portfolio work 95.3% of the time.
Low-maturity teams working from partial data manage 18.2%. Jira cycle time and velocity on their own produce that same partial data at the engineering level.
Answering the board's ROI question means weighing what the team delivered against what the team cost. Most engineering orgs measure the first half with Jira ticket timestamps and story point velocity. The second half, the hours the team actually had, never gets measured at all.
Cycle time is the elapsed time between when work starts on a ticket and when it closes. Velocity measures the story points a team completes in a sprint. Both describe past throughput under one sprint's conditions, including the incident that pulled two engineers off feature work and the on-call rotation that ran alongside it.
Those numbers then feed planning for the next quarter on the assumption that conditions hold. They rarely do.
Ticket dates carry the elapsed time and nothing else. Commits that reference a ticket and hours logged against it show what happened inside that elapsed time, which is the part planning needs.
The deeper problem sits in the denominator. Nobody isolated the available engineering hours in the first place, so velocity conflates how fast the team moved with how much time the team had.
One engineering lead described the pattern on a customer call. "In each cycle the team commits to about 50 units of planned work but delivers closer to 20. The shortfall repeats itself year after year."
Teams that keep missing the same commitment lose trust in the plan. Quarterly planning becomes a formality.
Most engineering organizations plan a quarter to a high-capacity target and leave a buffer for unplanned work. Incident load, on-call rotations, customer escalations, and security patches never enter sprint planning, because none of them are features. They arrive mid-sprint and consume actual available capacity that nobody subtracted from the plan.
Jira records the resulting tickets, not the hours spent on unplanned work. The planning system then reads the difference between planned and delivered work as an execution problem, when the inputs were wrong from the start.
Software engineering intelligence works when the signals come from where engineering work already happens. Tempo delivers these signals inside Jira, so the data reaches the planning system without asking engineers to update a separate system.
Engineers use Copilot or Cursor every sprint, and none of that activity is captured in Jira. Leadership asks for proof of AI return. The VP has vendor invoices with no attribution to teams, initiatives, or work items, because the activity took place in the IDE.
Tempo Workforce Intelligence for Jira records human time and AI tool activity down to the task level. So, when an engineer uses Cursor or Copilot, you can see the level of AI activity and cost, alongside the logged human hours, for each task.
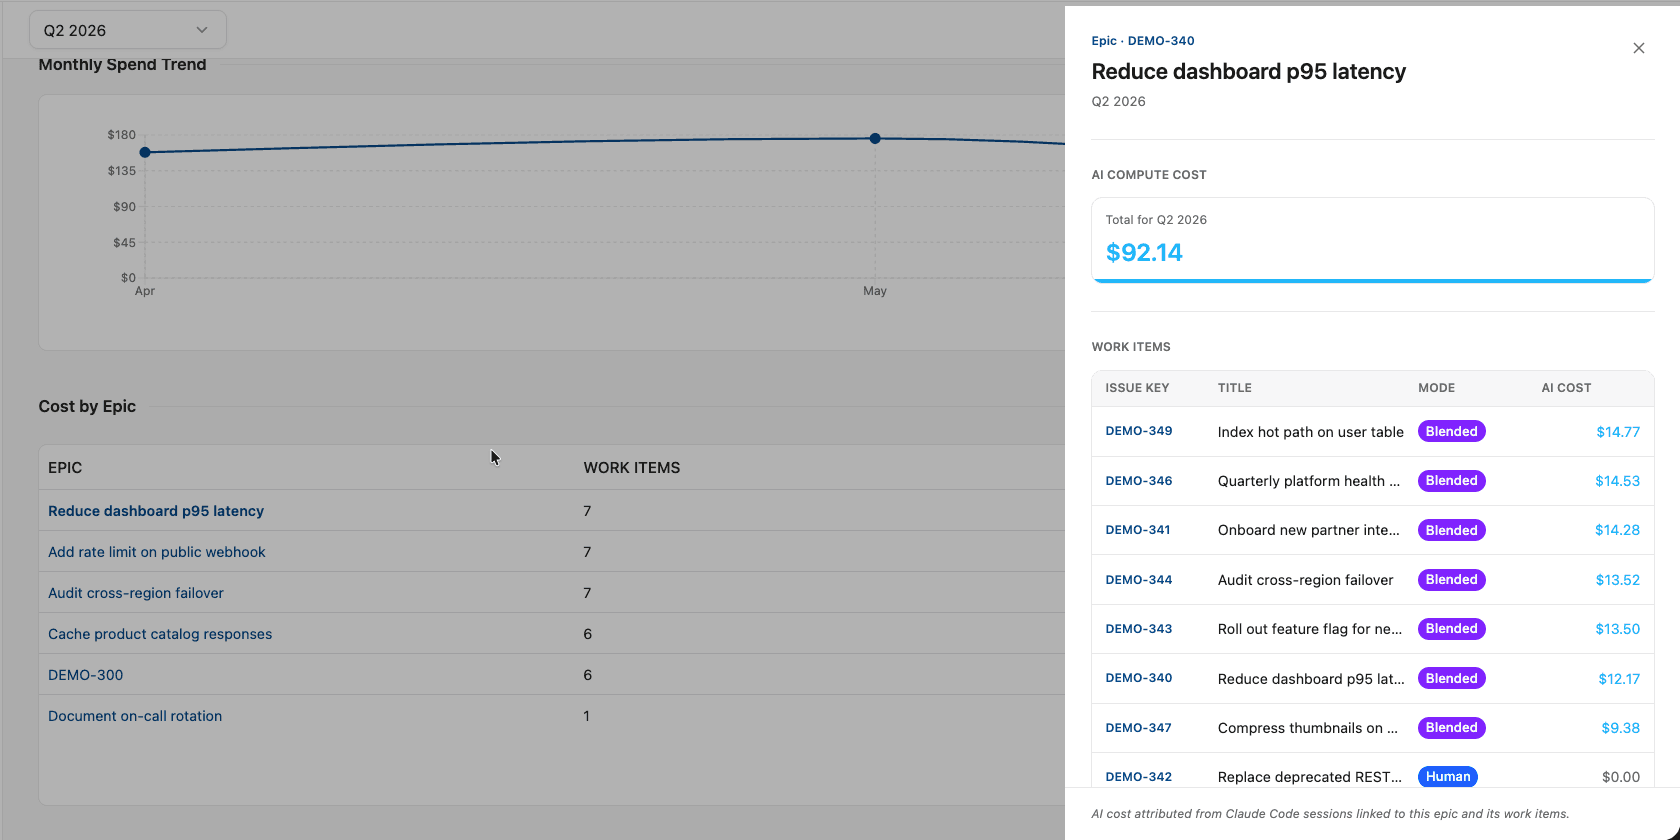
Finance receives attribution granular enough to categorize AI tool spend as CapEx or OpEx without manual reconstruction. Engineering leadership receives a blended view of which tasks AI contributed to last sprint's delivery. The board's question about AI return then has data behind it.
Adoption isn't an overnight thing. Workforce Intelligence needs admin configuration and a period of accumulated time-log data before the financial output means anything at portfolio level.
Quarterly plans align current headcount with your maximum operational limits. Incident load and unplanned work eat into the hours the team actually has, and the shortfall often appears once replanning options have narrowed. The root cause is a planning model based on story points and headcount.
Tempo Capacity Planner takes your sprint data and story points and turns them into time-based capacity views, then pushes that data back to Jira. As actuals come in through Tempo Timesheets, they reconcile against the Capacity Planner view. Plan and actuals live in the same system, so you can watch the divergence build.
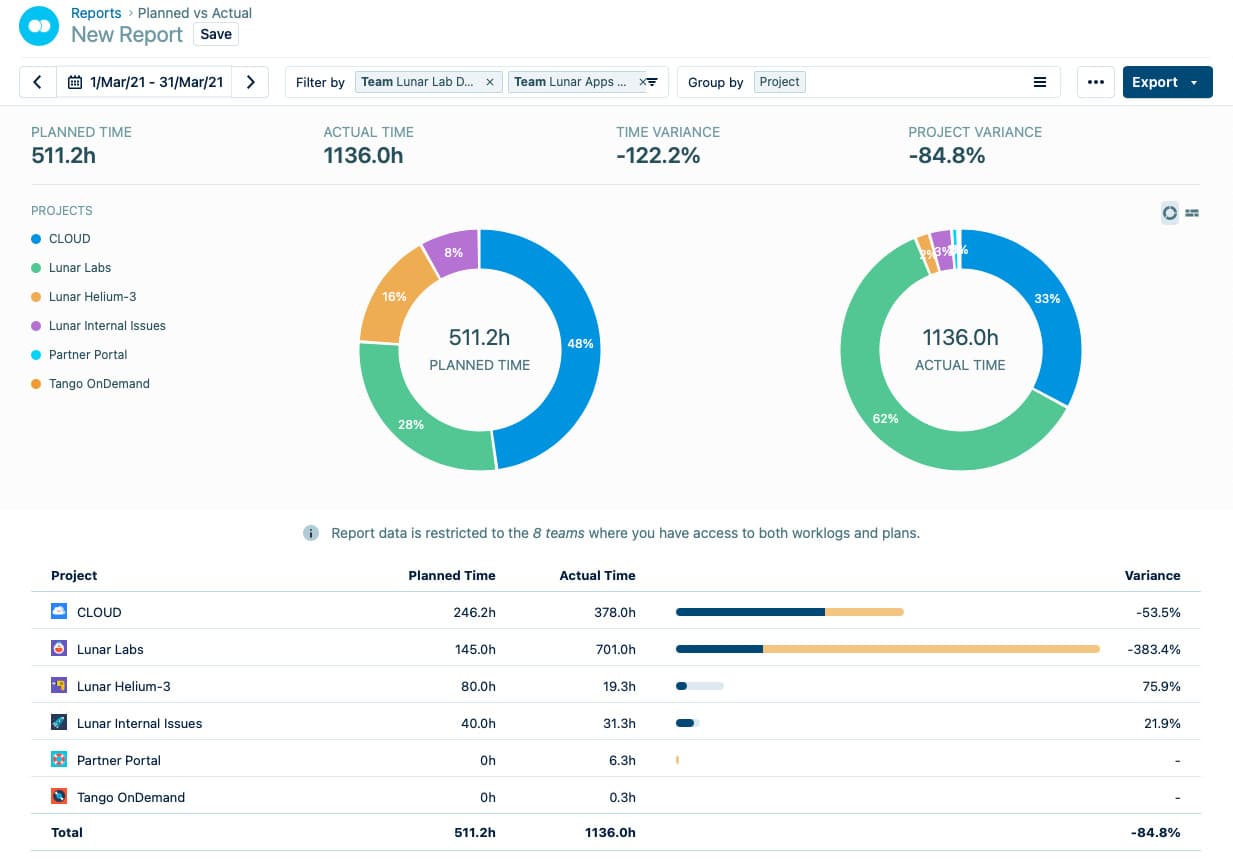
The two-way sync separates a capacity view from a capacity model. A model shows what was planned. A sync shows what happened and updates remaining capacity, so the next sprint starts from measured hours instead of assumptions based on the previous sprint.
John Rager, VP Enterprise Transformation at TransUnion, described the shift after moving time tracking into Tempo Timesheets.
"For the first time ever, because everything's in this central system, I've got 95% of the company managing all their work in Jira."
Tempo Sprint Performance Assistant is a Rovo agent that reads Timesheets data and sprint activity. It shows where time went in the current sprint, points out recurring carryover issues, and highlights bottlenecks the team can tackle in the next sprint. The agent produces sprint-level signals on its own. The risk conversation then begins with data, not with a manager's timing.
Together, these products replace assumptions with measured signals across the quarter. AI now writes code in every sprint, and its cost rarely maps to the work it touched. Put Tempo Workforce Intelligence on that gap and tie AI spend to the teams, epics, and issues it supported.
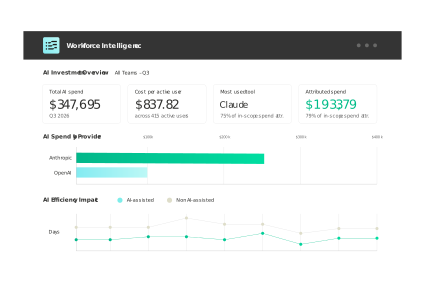
Workforce Intelligence
The only solution that ties AI vendor spend to the teams, epics, and Jira issues it supported.
Start a Free TrialCouldn't find what you need?Go to our documentation
Jira is a system of work. It shows what needs to be done, who owns it, and when it changes status. A software engineering intelligence platform captures signals from Jira, Git, CI/CD, and time-tracking tools. It converts them into planning intelligence covering available capacity, delivery risk, blended human and AI effort, and financial classification. Jira describes the work. Software engineering intelligence answers whether the plan to deliver it is realistic.
Well-designed platforms expose team-level and initiative-level signals rather than individual monitoring data. Leadership needs to know whether a team is on track and whether an initiative has bandwidth. Neither question requires tracking people by the keystroke or hour by hour.
Capacity views combine available hours across a team, and risk detection measures team-level burn against commitments. Engineers resist time tracking that feels like spying. They're fine with tracking that makes planning more accurate, which is why capture inside Jira creates less friction than a separate portal.
Yes, when the platform captures AI tool activity at the Jira work-item level. Measuring return means knowing which AI tool helped which issue, by which team, on which initiative. You then compare that against the cost of the subscription. An aggregated vendor invoice with no work-item attribution can't produce data finance or a board can use. Tempo Workforce Intelligence for Jira captures this at the work-item level.
It depends on which signals matter most. Capacity views and sprint risk detection can appear in the first sprint following deployment. Both use data engineers already generate in Jira. Financial classification is slower, because CapEx and OpEx output needs a quarter's worth of time-log data to accumulate before it means anything at portfolio level. Launching one product and expanding as you mature tends to reach value faster than a full platform rollout.
Engineering intelligence platforms measure delivery, but 2026 buyers also weigh AI-effort attribution. Compare the tools and how to choose one.

Workforce intelligence captures human effort and AI activity per Jira ticket, so finance can classify AI costs and prove ROI to the board.

Learn how to measure developer productivity beyond story points and velocity, with effort data and AI-contribution tracking for engineering leaders.

Six getdx alternatives compared. See what each measures, where each falls short, and which fits developer experience, DORA, or cost attribution.

Six Jellyfish alternatives compared: See what each one measures, where it runs, and which requirement it fits.

Compare Swarmia and Jellyfish on DORA metrics, integrations, AI cost tracking, and capitalization to find the right fit.

AI attribution should pair human effort and AI spend on the same Jira work item, tracing every dollar to the work it delivered. Learn how we built it.

Learn what portfolio reporting contains, report types by audience, why cycles break, and how continuous reporting changes the executive conversation.

Boost team connection and collaboration with 99 engaging team-building questions for goal-setting, bonding, and everything in between.



















