How to calculate sprint capacity: A guide for engineering leaders
Key Takeaways
Sprint velocity and sprint capacity measure different things: Use capacity to set sprint commitments, not last sprint's velocity.
Calculate sprint capacity per person, not per team: One engineer's leave doesn't average out across the team, so calculate each person's available hours individually.
Converting story points to hours is the step most teams skip: Build a conversion ratio from your last six sprints to check whether the team has time for the planned work.
Sprint capacity is the total productive hours of your team in a sprint. The formula is each team member’s available days multiplied by their productive hours per day, minus ceremony time, summed across the team.
Most teams run this calculation assuming eight full hours of focused work per day. But standups and adhoc requests eat into the eight hour window before the sprint even starts. This means the number going into the formula is wrong.
And when that happens, you end up overcommitting. The sprint plan looks achievable on paper, but the team is already short on real working hours before a single task is completed. Eventually, work rolls over to the next sprint, engineers feel like they’re constantly behind, and the plan stops being something they trust.
Most teams respond by looking at last sprint’s story point total and planning the next to match. That’s the velocity trap. This article explains why velocity and capacity aren't the same thing – and walks you through how to calculate capacity so your sprint plans are built the way they should be.
Sprint velocity vs. sprint capacity: Which one to plan from
Sprint capacity is a forward estimate of how much work your team can absorb in the coming sprint. Sprint velocity is a lagging measure of how much they completed in the last one.
Using velocity to set capacity is a common mistake because it treats past delivery as if it automatically predicts future availability. The logic for leaning on velocity feels sound: If the team completed 50 story points last sprint, plan 50 for this one.
The problem is that these two numbers measure different things. And because of that, if your team lead is on-call next sprint, they won’t have the same amount of uninterrupted time to work on sprint tasks. If an engineer is taking three days off, it won't show in the last sprint's velocity figure.
Planning from velocity means planning as if the next sprint will be identical to the last one, and it rarely is. The two metrics measure different things and answer different questions:
Metric | What it measures | Direction | Use it for |
Sprint velocity | Story points completed last sprint | Backward-looking | Tracking delivery trends over time |
Sprint capacity | Available productive hours this sprint | Forward-looking | Deciding what to commit to this sprint |
How to calculate sprint capacity: The formula
Sprint capacity = the sum of each team member's available days × their productive hours, minus ceremony time.
Start with one simple rule: Calculate per person, not per team. A team of six doesn't have uniform availability across a sprint. Treating them as if they do is where the calculation starts to drift.
Here's how to calculate sprint capacity the right way:
Step 1: Calculate the available days per person
Take the total sprint days, typically 10 days for a two-week sprint. Then subtract every day each person is unavailable: Vacation, training days, public holidays, sick leave. Do this individually. For example, oOne engineer's three-day conference doesn't average out across the team. It’s three fewer days of that engineer's capacity.
Step 2: Calculate productive hours per day
Don’t plan as if every scheduled hour is available for delivery. Meetings, ad hoc conversations, support work, and other overhead reduce the time your teams can spend on sprint work. That’s why many teams use a focus factor, a practical way to estimate usable capacity based on real working conditions, not idealized calendars.
A better approach is to start with your team’s actual history and refine from there. Teams with fewer interruptions can plan with a higher factor, while teams with on-call coverage or frequent escalations usually need to plan more conservatively. The goal is to use a number that reflects how your team really works.
Step 3: Subtract ceremony overhead
Treat sprint ceremonies as a real capacity deduction. In a two-week sprint, standups and reviews can take up a meaningful share of each person’s time, so use your team’s actual meeting durations from the last sprint instead of estimating.
Step 4: Sum up each person’s sprint capacity
With the input per engineer done, plug each person’s numbers into the formula and add the rows:
Team member | Available days | Productive hours/day | Ceremony hours | Sprint capacity (hours) |
Team member A | 10 | 6.5 | 8 | 57 |
Team member B | 8 (2 days leave) | 6.5 | 8 | 44 |
Team member C | 10 | 6.5 | 8 | 57 |
Team member D | 10 | 6.5 | 8 | 57 |
Team member E | 9 (1 training day) | 6.5 | 8 | 50.5 |
Team member F | 10 | 6.5 | 8 | 57 |
Total |
|
|
| 322.5 hrs |
You get a baseline of 322.5 available hours. Useful, but only inside the sprint window. The table won't show whether two senior engineers are locked into a compliance deliverable next quarter, or whether one person is spread across three initiatives at once. Those constraints live outside the spreadsheet, but they still affect delivery.
Most teams track them manually: A Slack message to check availability, a note in the planning doc. The problem starts when someone forgets to update it, or a dependency shifts mid-sprint and nothing downstream reflects it.
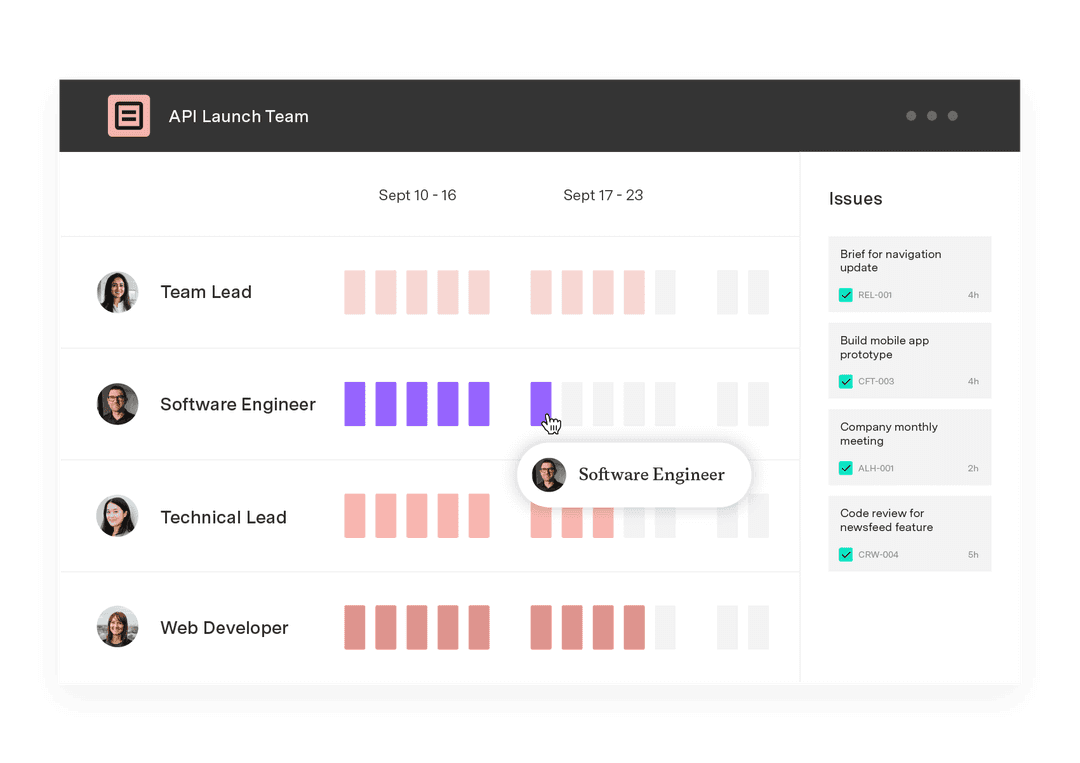
The fix is keeping those constraints in the same system as your sprint data. Tempo Capacity Planner pulls cross-sprint constraints into Jira. The two-way sync converts sprint data and story points into time, so you're looking at a live capacity number, not an outdated snapshot. Capacity Planner also flags blockers months in advance, by team and by skillset.
Edwin Amador, an Atlassian Systems Administrator at Arizona State University, put it directly: "We can pinpoint who needs help, who needs resourcing, where a project is failing – and that's all from Capacity Planner's features."
Story points or hours: Which should you use for sprint capacity?
Story points measure relative complexity (how much effort and uncertainty is packed into a piece of work). Hours measure real time. Both have a job in sprint planning, and they answer different questions.
| Story points | Hours |
What it measures | Relative complexity and effort | Real available time |
Who asks | The engineering team, during estimation | Stakeholders outside the sprint |
Answers questions like | "Is this story bigger than that one?" | "Can we staff this?" "What's our Q3 runway?" |
Where it falls short | Doesn't reflect time available this sprint | Doesn't capture complexity or uncertainty |
Story points are useful to measure how complex a piece of work is relative to others in your backlog. They say nothing about how many hours that work will take.
So when stakeholders ask about staffing or quarterly runway, story points don’t give them an answer. To get one, you need to convert story points to hours, which is what most teams skip.
Skipping it means committing to an output target without checking whether the team has time for it. That target may look fine on paper, but it ignores time off and unplanned support work in the next sprint. Converting to hours connects the plan to real capacity, so you're committing to what the team can absorb.
Before you convert, you should know that Magne Jørgensen’s work at Simula Research Laboratory found no clear evidence that story points produce more accurate estimates than time-based estimation. Story points are just a different way to express the same uncertainty.
That said, if your team estimates story points inside Jira, your capacity model needs a bridge between the two units. Here's how to build one from your own sprint history.
The conversion method
Pull your last six sprints of completed story points and the actual hours logged against those same sprints.
Divide total hours by total points. That's your team's hours-per-point ratio, and it's the only number worth using, because it reflects your team's history.
Here’s what that looks like for a hypothetical six-person team over six sprints.
Sprint | Points completed | Hours logged | Hours per point |
Sprint 1 | 38 | 290 | 7.6 |
Sprint 2 | 42 | 315 | 7.5 |
Sprint 3 | 35 | 270 | 7.7 |
Sprint 4 | 40 | 305 | 7.6 |
Sprint 5 | 44 | 330 | 7.5 |
Sprint 6 | 39 | 295 | 7.6 |
Average |
|
| 7.6 hours/point |
With a 7.6 hours-per-point ratio and a capacity of 322.5 hours, your sprint target is approximately 42 story points, not the 50 your velocity suggests. That eight-point difference is the distance between what your team can deliver and what an uncorrected velocity figure tells you to commit to.
Recalibrate every three to four sprints, or whenever you add or lose engineers. A ratio built for a six-person team in January isn't reliable for an eight-person team in Q3.
Tempo Capacity Planner handles the conversion for you, pulling actual sprint history rather than a disconnected spreadsheet. Its two-way Jira sync keeps the ratio current as work is logged.
What the formula doesn't account for (and why your capacity numbers keep collapsing)
The formula treats your sprint like a controlled environment, but engineering sprints are not controlled environments.
Patrick Savago, Solutions Engineer at Tempo, describes a pattern he sees consistently across organizations: "It's always a 'we need to do this AND keep doing all the old stuff.' Not 'we're going to do this INSTEAD of the old stuff.'"
Unless you account for unplanned work in the plan from the start, it consumes the plan every sprint. Because demand doesn't decrease just because the sprint is full.
There’s also what Savago calls the zombie project problem, where teams keep working on initiatives that leadership quietly deprioritized months ago, but no one told the team.
How to fix your sprint planning: Factor in unplanned work by default
Reserve a buffer for unplanned work instead of planning to 100% capacity. You can leave room in sprint plans for unplanned time, since your team can’t predict everything that will happen during a sprint. The goal is to treat that buffer as something you calibrate from actual sprint history, not as a fixed guess.
This is also where a live capacity view becomes useful. If you're using Capacity Planner, you can see where capacity is going by team and by individual, so when a P1 incident eats 12 hours of your backend lead’s week, it shows up during the sprint instead of surfacing in the end-of-sprint retrospective.

How to track sprint capacity in Jira (and where native Jira falls short)
Jira Plans surface capacity at the cross-team roadmap level. For individual sprint planning, it defaults to 30 story points per sprint as a capacity ceiling and lets you adjust manually.
What it doesn't do is to:
Define capacity per team member (50% allocation across two concurrent projects isn't representable)
Track real-time utilization against a live sprint
Alert when a team member is over capacity
Account for incident load or on-call time
Show historical capacity trends across sprints
The standard workaround is a spreadsheet that pulls from Jira and gets updated manually before each sprint. It works until someone forgets to update it, or a team member's allocation shifts after planning is already done. Then the spreadsheet and reality are different documents, and nobody quite knows which one to trust.
You can address these five limitations in Jira with Capacity Planner as well. It syncs with Jira bidirectionally, and converts between story points and hours without requiring a disconnected spreadsheet.
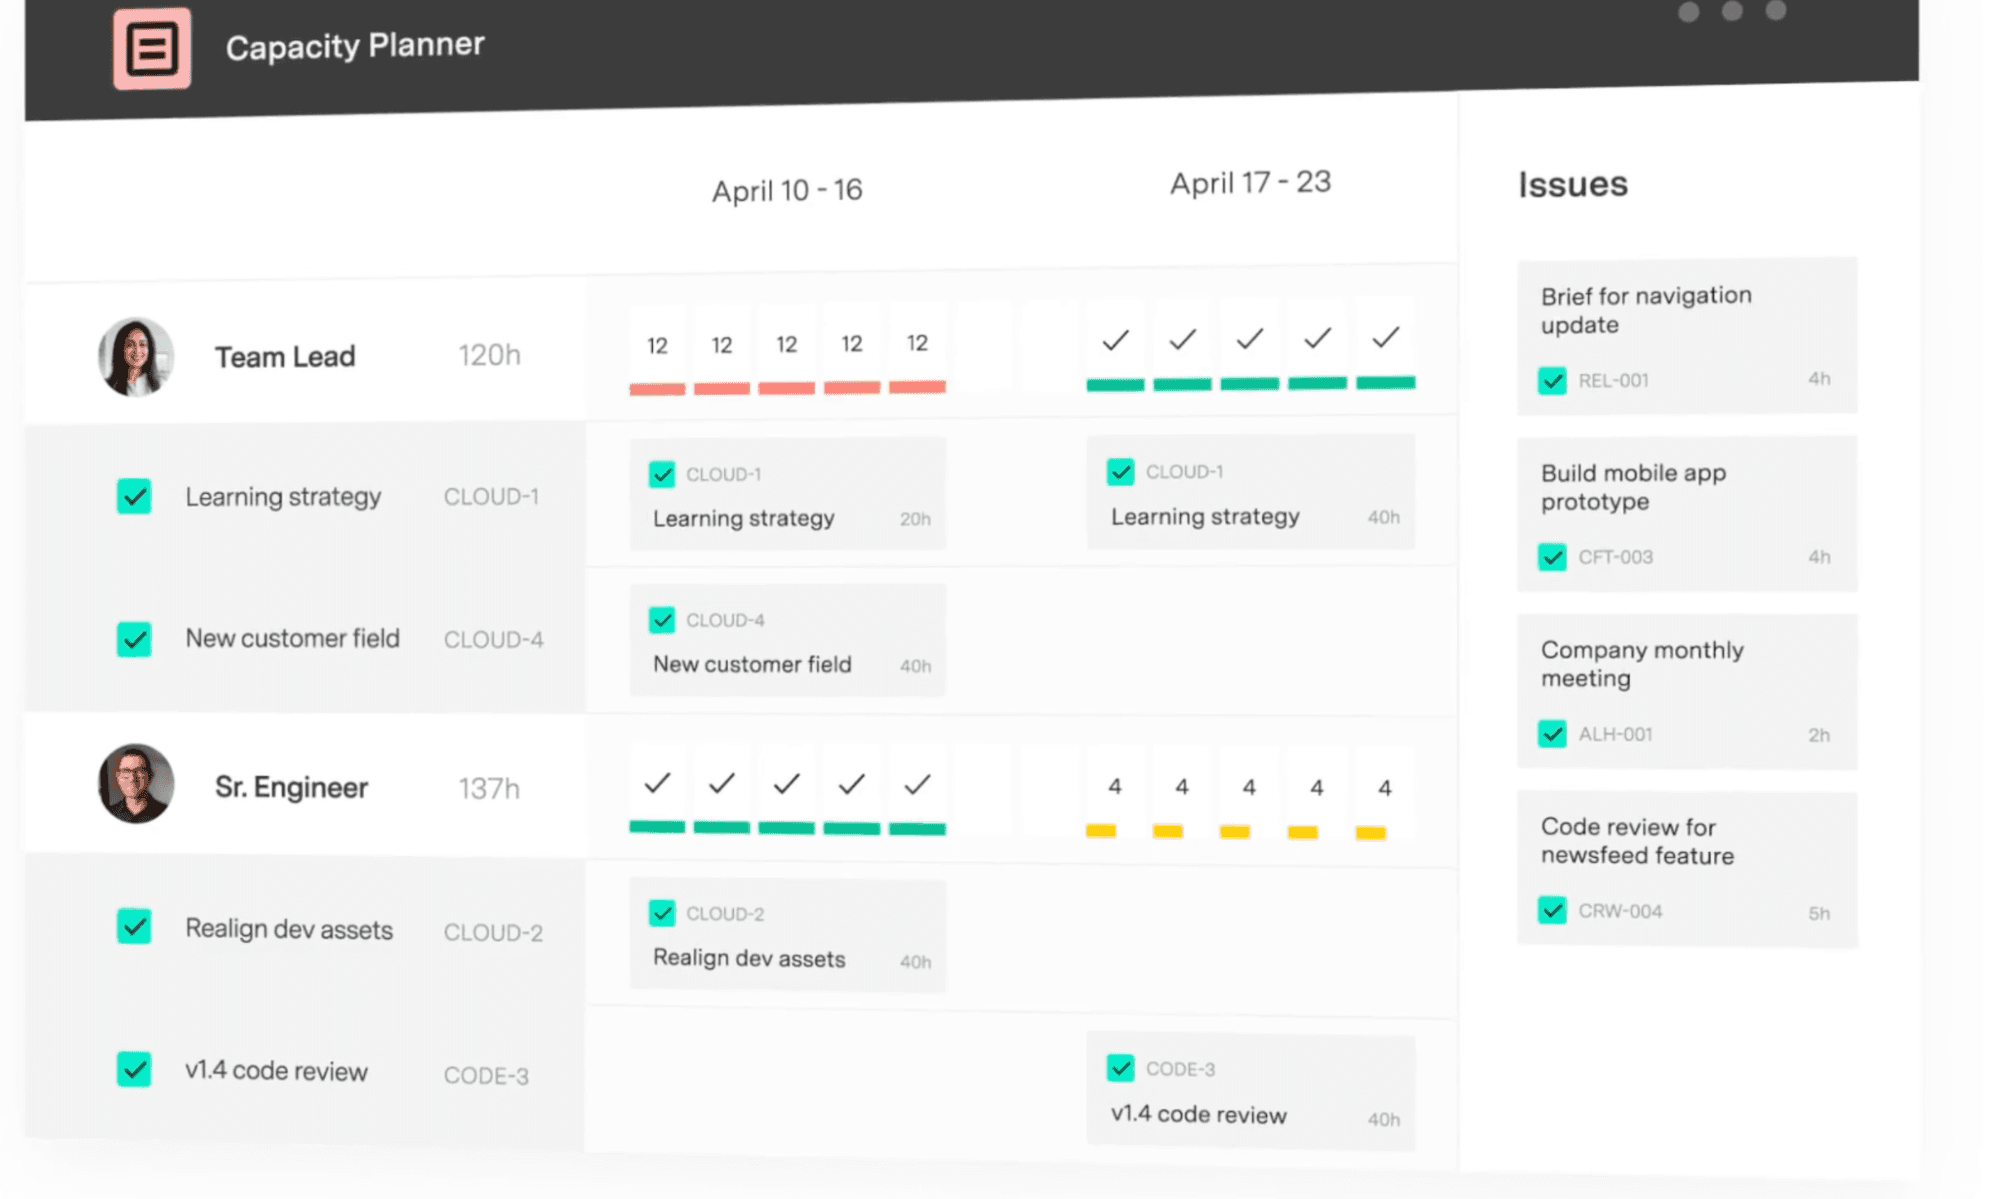
The sprint and release planning view shows color-coded plan health that updates as work is logged, so overcommitment surfaces during the sprint, not in the retrospective three weeks later.
Tempo Timesheets also integrate with Capacity Planner so logged time flows directly into capacity tracking. Planned hours and actual hours exist in the same system, and the integration between the two products catches overbooking before it becomes carryover, rather than confirming it happened after the sprint closed.
Get sprint capacity planning in real-time
The sprint capacity formula gives you a starting point. But it only works when the inputs reflect real engineering life: Incidents and unplanned work, and the time lost between what’s scheduled and what’s available for focused delivery.
The best engineering leaders compare their team’s plan to reality every sprint and use what they learn to sharpen the next one. Tempo Capacity Planner converts sprint data and story points into time-based capacity automatically, with real-time views by team and skillset, connected to Jira via two-way sync.
Explore Tempo Capacity Planner to see how it works.