

Engineering intelligence platforms measure delivery, but 2026 buyers also weigh AI-effort attribution. Compare the tools and how to choose one.
Why output metrics only answer half the question, and what effort and AI-contribution data tell engineering leaders

Key Takeaways
Developer productivity measurement combines three kinds of data: Output metrics, effort actuals, and cost attribution. Most teams measure the first well and the other two barely at all.
DORA (DevOps research and assessment) measures delivery pipeline health, and SPACE (satisfaction and wellbeing, performance, activity, communication and collaboration, and efficiency and flow) measures developer experience. Neither shows where capacity actually went or what AI tools contributed.
Effort data captured as a byproduct of Jira activity, commits, ticket closures, and worklog suggestions doesn't ask engineers to change how they work.
AI coding tools leave no trace in Jira cycle time, so measuring their contribution means capturing activity at the work-item level, not the vendor-invoice level.
Ask five engineering leaders how to measure developer productivity, and you'll get five answers. Most of them will cite story points, deployment frequency, and cycle time. Numbers that are worth tracking. They tell you whether the delivery pipeline is moving forward.
What they don't tell you is where your engineering capacity actually went last quarter, how much of that work was capitalizable, or the level at which AI coding tools contributed.
These are the questions finance and the board keep asking, and it's the one story point velocity was never built to answer.
This guide walks through how to measure developer productivity in order, starting with the frameworks most teams already know, then adding the effort and cost data that make the picture defensible when someone outside engineering challenges it.
Developer productivity means different things to different people, which is why the conversation about measurement often leads to communication issues.
For an engineering team, productivity is measured by throughput, features shipped, bugs resolved, and how often code is pushed to production.
For finance and the board, it's attribution. Which work counted as CapEx, which as OpEx, what AI tooling contributed, and whether the quarter's capacity matched the plan. All are legitimate, but they need different data.
The most straightforward way to measure developer productivity is to focus on three kinds of data:
Output metrics show whether the pipeline is moving in the right direction.
Effort actuals show where the hours actually went, at the work-item level.
Cost attribution maps that effort to financial categories and to the AI spend behind it.
Most organizations measure output thoroughly, but hardly focus on the effort and cost. And that’s exactly where the hard questions live.
Engineering leads usually cover output with story points and velocity. The problems start when they're asked for effort actuals and cost attribution as well.
Story points estimate relative complexity, not elapsed time. A five-point story might take one engineer half a day and another engineer three days, depending on the codebase and what broke in production that week. That's fine for sprint planning. It stops working the moment you try to roll points up to the initiative level and read them as time spent.
Velocity tells you a team's rhythm. It won't give finance a defensible schedule of hours by initiative, and it won't survive an audit that asks for one. Two established frameworks take measurement further than points and velocity can, so they're the right next stop.
Two measurement frameworks show up in almost every serious discussion of how to measure software developer productivity. You need both to see the full picture.
DORA covers four measures of delivery pipeline health: Deployment frequency, lead time for changes, change failure rate, and time to restore service. High deployment frequency tells you the team ships often. Short lead time tells you the pipeline moves quickly. These are strong developer productivity metrics for one specific question: “Is our delivery system healthy?” They’re measurable straight from source control and CI/CD data without new tooling.
What DORA doesn't tell you is how many hours of capitalizable work moved through that pipeline, which initiatives absorbed the capacity, or whether the quarter's planned allocation matched reality.
SPACE was designed to fix the issue of tracking developer productivity using a single proxy metric. It spans five dimensions: Satisfaction, performance, activity, communication and collaboration, and efficiency, and it deliberately mixes perceptual signals with system data so no one number can be gamed. Teams that adopt it get a fuller read on developer wellbeing and flow, which matters for retention and sustained output.
What SPACE doesn't reveal is effort actuals at the work-item level or cost attribution by initiative. It answers how the team is experiencing the work. It doesn't answer how much of last quarter's engineering spend was CapEx.
DORA and SPACE together still leave out where the hours actually went and what they cost. That's the third kind of data: Effort actuals tied to specific Jira work items and classified as CapEx or OpEx.
It's what finance needs for capitalization, what the board needs to judge AI ROI, and what lets you compare plans against actuals at the initiative level. Most teams don't have it. The next section covers why it's so hard to capture.
The difficulty is that nothing in the standard toolchain records where the hours went. Jira records what state a ticket is in. Source control records what changed. Neither records how long an engineer spent, or on what. So a capacity plan commits most of the quarter to strategic work, incidents and unplanned work quietly divert engineers to put out fires instead, and the plan still reads on track because nothing is comparing the two.
The distance between plan and actual opens in the capacity plan itself. Capacity plans assume an availability that incident load, unplanned work, and meeting overhead steadily eat into, and in most tracking systems engineers don't log time against those categories, so the erosion stays invisible until a manager raises a hand.
That's why divergence stays hidden: Risk is self-reported. A manager notices the team won't make it and says so, and only then does the organization start looking for a way to detect delays in the data instead.
By the time that flag arrives, the cheap course-corrections are usually gone.
When effort data lives at the work-item level, the signal shows up the moment work patterns shift. An engineer logging hours against a maintenance ticket instead of the funded initiative is visible right away, not three weeks later in a status meeting.
Done right, this is simple to state. For each strategic initiative, you see planned capacity against actual hours logged, with updates continuously captured rather than assembled at quarter-end.
When those two lines diverge in the first few weeks of a quarter, that's a leading indicator worth acting on while there's still room to act. Teams with this view tend to treat quarterly planning as a running adjustment rather than a set-and-forget commitment, and effort data at the work-item level is what makes the difference.
There's a reason most teams don't have effort data. It’s not that they haven’t tried. They attempt to track time manually, but it’s not compatible with how engineers work. Filling in a form to reconstruct the week produces data from memory that's approximate at best and adds governance overhead that does nothing for delivery. When engineers call time tracking an anti-pattern, manual logging is what they mean.
The way around it is to stop asking engineers to record their work and capture it as a byproduct of work they're already doing.
Activity that already happens generates the effort data automatically: Jira ticket transitions, commits in GitHub or GitLab when the header carries the issue key, and calendar events for meeting time. The engineer confirms a suggestion rather than reconstructing a week. For the individual contributor, the experience is close to invisible. They keep working inside Jira, and the record assembles itself around them.
Start the rollout with source control. When an engineer puts a Jira issue key in a commit message, the time on that commit maps back to the work item on its own, no IDE plugin, nothing new on the desktop. Because it's configured with organization-wide settings rather than per engineer, it's also the least work to switch on.
Suggested worklogs solve the measurement problem for human effort. But AI coding assistants have changed what effort means on any given ticket. A growing share of the work is performed by AI, and a measurement layer that only records human effort ignores it entirely. Measuring developer productivity now means capturing both AI and human effort.
That blended effort is what Tempo Workforce Intelligence is built for. It captures human time and AI tool activity together at the epic, story, and task level, reflecting how the work actually got done rather than showing human-only effort.
Workforce Intelligence runs inside Jira on its own, and it works alongside Tempo Timesheets, a Jira-native time tracking product, when you want a deeper record of the human half. Commits carrying issue keys generate worklog suggestions automatically. CapEx and OpEx classifications set once at the project or issue-type level flow into every confirmed worklog with no per-entry tagging.
An approval workflow turns the approval chain into the audit trail a capitalization review needs. At TransUnion, capturing effort this way in Jira triggered an overhaul of the Authority for Expenditure process, which went from 17 workflow approvers to four levels of approval. Engineers log time on the Jira issues they are already working on, though rolling it out to 5,500 users took a trained network of scrum masters and release train engineers.
Engineering teams have been rolling out Cursor, GitHub Copilot, and similar tools for several sprint cycles, and leadership is now asking for evidence of ROI.
One engineering leader aggressively rolled out Cursor and reached 30 to 40% adoption. When leadership asked them to prove its value, they looked at Jira cycle times to find the data. The paper trail showed nothing, and they ended up digging into the repositories instead.
Cycle time measures how long a ticket takes to move from in-progress to done. AI coding tools act inside the IDE, generating code, filling in tests, speeding up a refactor. Those gains can compress the actual hours on a ticket without changing when it crosses status lines, so cycle time, which only sees the status transitions, registers no difference. It's simply the wrong instrument for this measurement.
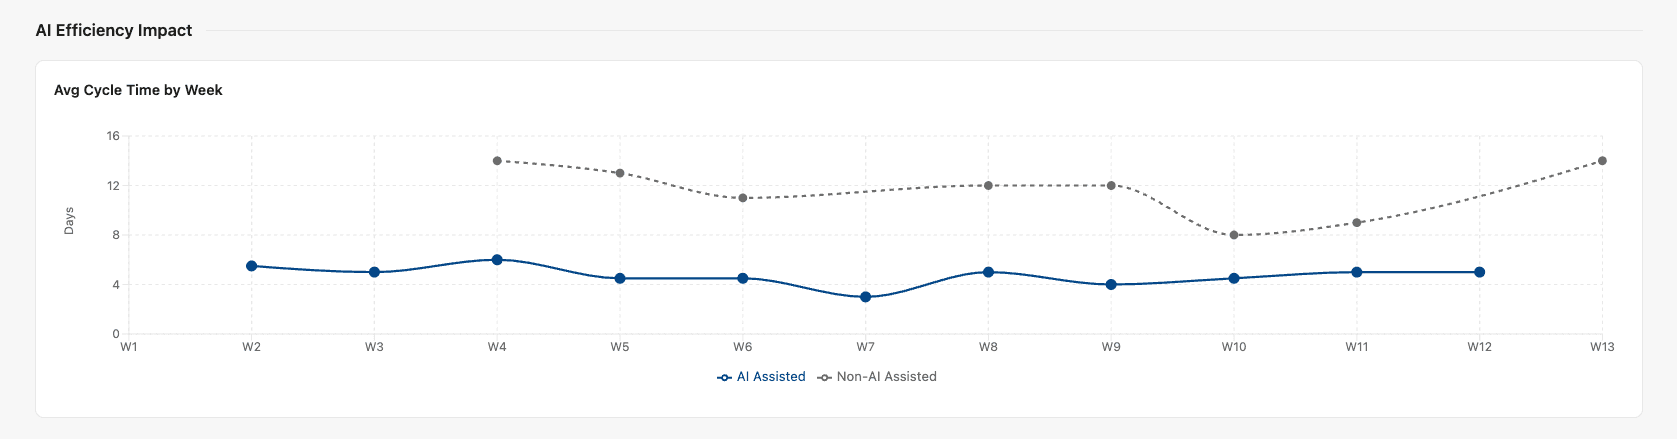
Repository signals, such as commit volume and pull request throughput, show coding output. What they don't do is connect that output to the specific Jira issues, teams, and initiatives that benefited, or to tooling cost. AI vendor bills arrive at the organization level with no attribution to any of that, which is why a CFO who's asked to keep authorizing the spend has no basis to say yes.
Answering that means capturing AI activity at the work-item level, next to human effort, which is what the blended-effort layer inside Workforce Intelligence is built to do.
Story points and DORA metrics answer what they’re supposed to, well. They don't, however, answer the questions finance and the board are asking: Where the capacity went, what it cost, and what the AI tooling returned.
Those answers live in effort actuals and the cost attribution built on them. You get there by adding them in order, an effort baseline first, then AI attribution on top. And because the record assembles itself from work already happening, you can answer a board question with evidence rather than a velocity chart.
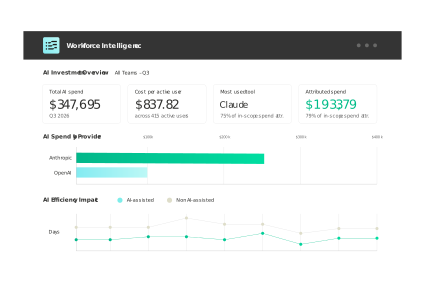
AI now writes a growing share of every sprint, and its cost rarely maps to the work it touched. See how Tempo Workforce Intelligence ties AI spend to the issues, teams, and initiatives it supported.
Workforce Intelligence
The only solution that ties AI vendor spend to the teams, epics, and Jira issues it supported.
Start a Free TrialCouldn't find what you need?Go to our documentation
You measure effort against work items, which sits alongside story points rather than replacing them. Teams keep estimating in points for planning, and effort tracking records actual time against the same tickets underneath. The rollup to the initiative level converts everything to time, so agile, scaled-agile, and hybrid teams all contribute comparable actuals without changing how they plan. Points stay the planning currency, hours become the measurement currency, and the two coexist.
Cycle time only sees when a ticket changed status, not what happened inside the work. AI tools compress the hours spent writing and testing code, which can leave the status-transition timestamps unchanged even as real effort drops. So a team can get materially faster on a ticket while its cycle time looks flat. Capturing the gain means measuring effort and AI activity at the work-item level, where the change actually shows up.
At minimum, Jira ticket activity, source control commits with issue keys in the headers, and calendar data for meeting overhead. Those three feed worklog suggestions that engineers confirm rather than build from scratch. Aggregate the confirmed worklogs by initiative, compare them against the capacity allocation, and you have a live plan-versus-actual view. Adding approval-workflow data gives you the audit trail a capitalization review will ask for.
The general principle is that capitalization and R&D reporting hold up far better on contemporaneous records than on figures reconstructed at quarter-end from memory, since a defensible position rests on being able to show which work item the time was logged against, when, and under which classification.
Exactly what qualifies, and how, depends on your jurisdiction and accounting standards, so treat the tooling as the way to capture the evidence and your finance and tax advisors as the authority on what the evidence needs to prove. In practice, one full quarter of confirmed worklogs with an approval chain tends to be the point where the data is stable enough to support an audit conversation.
Engineering intelligence platforms measure delivery, but 2026 buyers also weigh AI-effort attribution. Compare the tools and how to choose one.

Software engineering intelligence platforms read time logs, Jira, and Git as one dataset. See what they measure and where AI spend fits in.

SDLC best practices for every phase, and how AI in SDLC workflows changes them. Learn to record AI effort in Jira.

Workforce intelligence captures human effort and AI activity per Jira ticket, so finance can classify AI costs and prove ROI to the board.

The best developer productivity tools for 2026, compared by category, from AI coding assistants to real-capacity measurement.

With story points, teams estimate effort rather than setting due dates. Find out why, what, and how to use them to forecast project development.

AI attribution should pair human effort and AI spend on the same Jira work item, tracing every dollar to the work it delivered. Learn how we built it.

Learn what portfolio reporting contains, report types by audience, why cycles break, and how continuous reporting changes the executive conversation.

Reflecting on how to become more effective comes through reporting. But is your Jira Software team doing enough? These tips will help.


















