
Portfolio reporting that holds up when the CFO asks a follow-up
Key Takeaways
Portfolio reports built from Jira exports give the CFO a snapshot frozen at export time: Any project update logged after the export means the numbers in the deck no longer match what's in Jira.
CapEx/OpEx tracking requires time data captured at the ticket level as work happens: Engineers reconstructing time from memory at month-end produce numbers that don't hold up in a financial audit.
Most Jira-native teams already have the data they need for live portfolio reporting: Custom Charts, Structure PPM, Timesheets, and Financial Manager each handle a different layer, and you can start with any.
Your portfolio review is up. The CFO asks for a follow-up, two portfolio managers pull up different numbers for the same initiative, and nobody knows which set is right.
That's because the report is a static snapshot. The moment your team exports from Jira and builds the deck, the deck is no longer an accurate, live version. The CFO’s questions about CapEx split or budget variance don’t have live answers, because your data isn’t updated in real-time.
Only 37% of organizations with siloed planning processes report good portfolio visibility, according to Tempo's 2026 State of SPM. So if you already have the data in Jira, what you need is the reporting layer that turns it into a live, finance-connected view the CFO can interrogate.
What portfolio reporting is and why it's different from project reporting
Portfolio reporting gives leadership a consolidated view of everything the organization is running at a point in time; every active project, viewed at once. Project reporting covers one project; program reporting covers a cluster of related projects working toward a shared goal.
Portfolio reporting sits above both. Its audience is CFOs and board members who need to know whether the portfolio as a whole is healthy and aligned.
That top‑down perspective is why portfolio reporting breaks down into several distinct report types, each tailored to a specific audience, cadence, and focus.
The type of report determines the audience, frequency, and what it needs to cover:
Report type | Primary audience | Typical frequency | Core focus |
Delivery dashboard | PMs, team leads | Daily / weekly | Sprint progress, blockers, time in status |
Portfolio status report | PMO, CPO | Weekly / monthly | Cross-initiative rollup, milestones, slip indicators |
Financial health report | CFO, finance partners | Monthly | Plan vs. actual, CapEx/OpEx, budget variance |
Capacity report | VP Engineering, CPO | Weekly | Committed vs. available capacity, allocation conflicts |
Executive portfolio review | C-suite, board | Quarterly | Strategic alignment, ROI, forecast confidence |
Audit and compliance report | Internal audit, regulators | Quarterly / annual | Capitalization detail, work-item traceability |
A well-run portfolio report answers five questions: What's the current status of every active initiative? Are we on budget? Do we have the capacity to finish what we've started? What risks are materializing? Are our projects still aligned to the strategy we agreed on six months ago?
A report that answers all five gives leadership what they need to make decisions.
What a portfolio report includes
Portfolio reports have six elements. Include all the six and your executives have what they need to make accurate decisions.
Strategic alignment: Do your active projects still serve this year's priorities? Strategies shift. Projects you approved in Q1 planning may no longer serve the same objectives by Q3. The portfolio report surfaces misalignment early before it becomes a year-end conversation about wasted budget.
Financial health: Budget-versus-actuals across the portfolio so it’s not limited to each project. For enterprises with capitalization requirements, this includes a defensible CapEx/OpEx split: Categorize spending as CapEX or OpEx right at the project and ticket level, not estimated at month end.
Resource utilization: How much available capacity is committed, and where? Over-allocated teams create delivery risk. Under-utilized capacity signals poor prioritization. Neither shows up in a status deck built from Jira exports.
Risk and dependency flags: Which projects have stalled or fallen behind and are threatening to delay others? Portfolio-level risk oversight means leadership can see where multiple projects share a vulnerability before it compounds.
Timeline and milestone status: An on-track/at-risk/delayed view across the full portfolio. A dashboard any stakeholder can read without a PM walking them through it.
Escalations: What needs a decision before the next reporting cycle? If the report doesn't flag escalations, leadership assumes everything is fine. In a complex portfolio, everything is rarely fine.
Manual portfolio reporting: Why it breaks down
You spend two to three days every reporting cycle pulling data from multiple systems before you can analyze any of it. By the time you format and present the deck, the information is already a week or more out of date.
The cycle is familiar: Data lives in Jira, but reporting runs through Excel. You pull an export, sculpt it into charts, format the deck, and send it out. Then start over again the following month, and it works, until something breaks.
Three failure points show up again and again:
1. Data goes stale at export. The export is a snapshot, not a live view. If a project status changes between the export and the executive meeting, the report is wrong.
2. Version control breaks. This happens when multiple spreadsheets mean multiple owners and multiple versions in circulation. Two portfolio managers can show conflicting numbers for the same project, and by the time the CFO asks a follow‑up question in the middle of the presentation, nobody in the room knows which set of numbers is right, including the portfolio managers.
3. Capitalization tracking fails: For enterprises under audit scrutiny, the CapEx/OpEx split needs to hold up in a financial review and the way most teams produce it doesn't.
Engineers reconstructing their time at month-end are guessing. Patrick Savago, Solutions Engineer at Tempo, says that these individual contributors “go at the end of the month and fill out their timesheet and they're like, 'I don't remember. On this day, I think I spent eight hours on that.'" That data won’t survive a financial audit, and it can’t support accurate portfolio decisions either. So over time, the cost adds up.
Why built-in reporting falls short at the portfolio level
Execution systems like Jira track work at the team level. Portfolio reporting isn't what they were built for, and their native dashboards reflect that.
Jira's built-in dashboard gadgets have a fixed set of chart types, and you can't mix and match fields or write custom calculations.
Aleksandr Kliuchnikov, Senior Product Expert at Tempo, describes the constraint directly: "Jira gives you a list of available reporting tools or a list of available gadgets you can use. The information you can use in this gadget is also limited."
At enterprise scale, that limitation is visible. A large Jira instance can hold hundreds of thousands of issues across dozens of projects. Jira Plans extends the view, but it tops out at 5,000 issues, a ceiling most enterprise portfolios exceed. Besides, it’s built for timeline planning, not portfolio reporting. There's no financial layer for CapEx/OpEx tracking and no cross-product rollup.
So the default behavior is to export and pull the data to Excel. You build the report there, and present it to leadership. The moment the data leaves Jira, it stops being live. That cycle repeats every reporting period, with leadership sometimes discovering conflicting numbers mid-meeting, in front of a CFO.
What good portfolio reporting actually looks like
Good portfolio reporting is a single, trusted view that connects strategy, execution, and finance in one place. It surfaces the right level of detail for each audience (board, C‑suite, PMO, and engineering) without forcing your team to rebuild the same deck every reporting cycle.
A few properties that define it.
1. Live, not exported: The report reflects the current state of work.
2. Audience-tailored, single source: The board needs strategic alignment, top risks, and escalations. Your PMO team needs project-level status, resource conflicts, and dependency flags. Both views pull from the same data, not from two separate spreadsheets.
3. Connected to time and financial data: Status data alone is incomplete. A portfolio report that shows project health without connecting to the hours your team logs, the spend they committed, or the CapEx/OpEx split is missing the context your CFO would probably ask for.
Kim Loughead, VP of Marketing at Tempo, describes the CFO experience when this works: "So many CFOs struggle when they see data coming in from different tools that are used by different departments, and there's no real consistency to how it's being tracked. But when you can see down to the ticket level, this user spent this much time, this was their billable rate, and you know if it's CapEx or if it's OpEx, that's when the light bulb goes off."
4. No assembly required: The report is always ready. Your team's job shifts from building the report to interpreting it, which is where the actual strategic value is.
How Jira-native teams build live portfolio reports
Most Jira‑native teams already have the data they need. It lives in their system and can be turned into live, audience‑tailored reports without a weekly export cycle.
Your team can solve this with four tools, each focused on a different part of the portfolio reporting workflow. Here’s how to layer them as your reporting maturity grows:
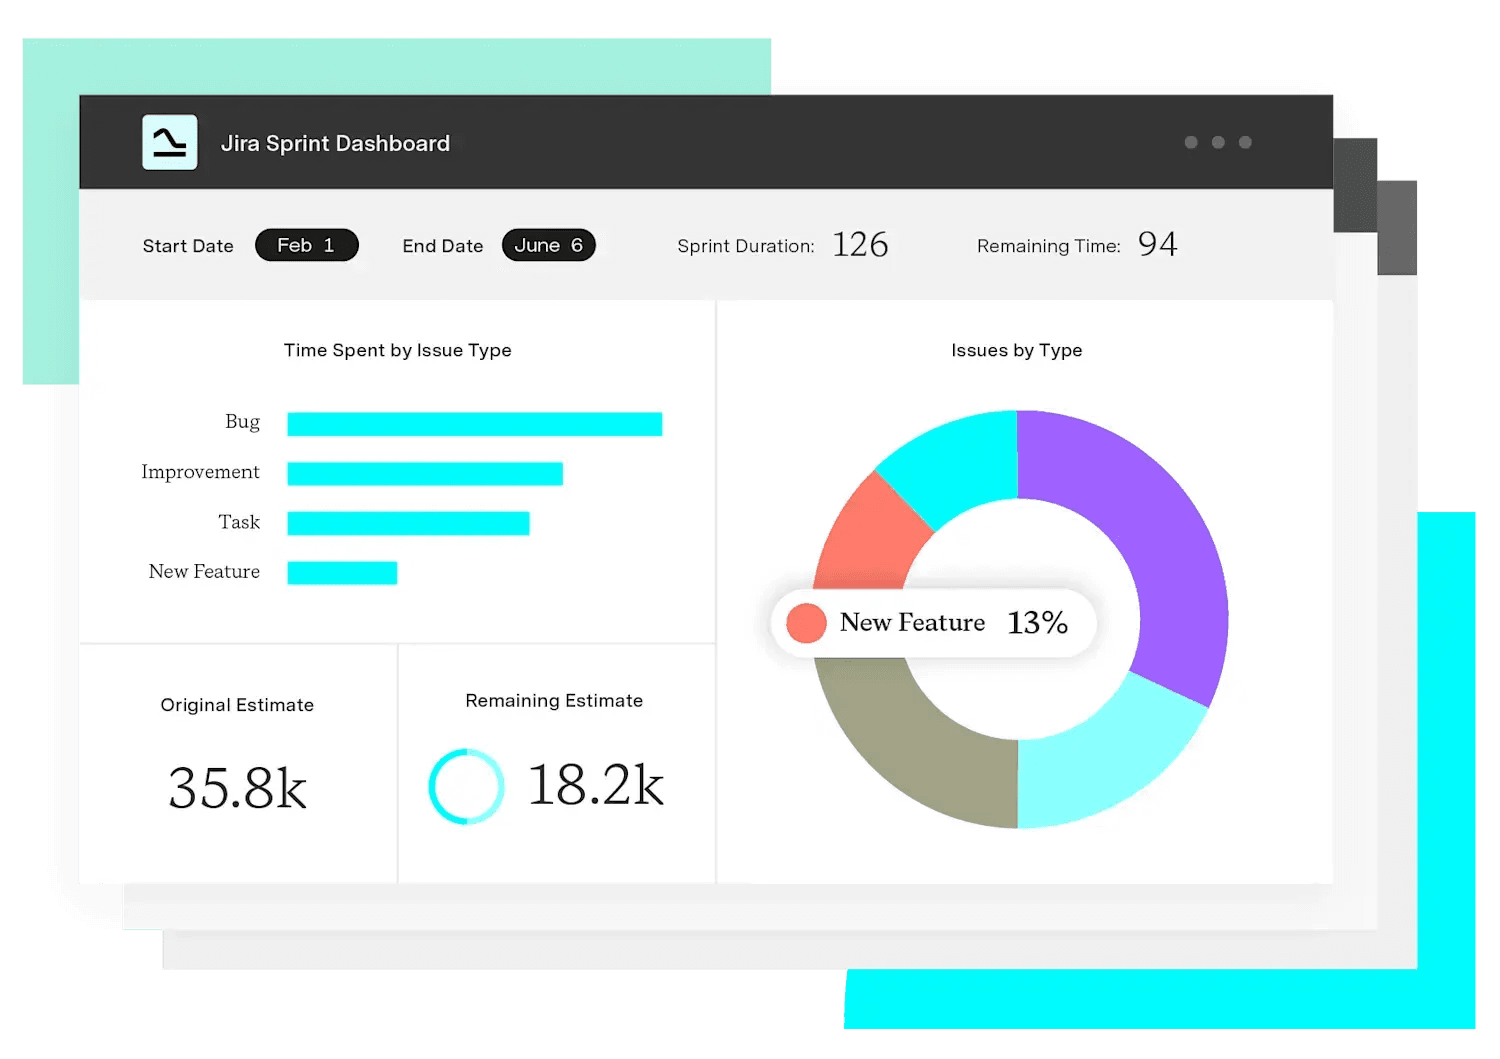
Layer 1: The dashboard layer — Custom Charts for Jira

Custom Charts for Jira replaces and extends Jira’s built‑in gadgets with fully customizable charts (bar, pie, line, table, funnel, and tile) built directly on live Jira data.
Before implementing Custom Charts, Sky Betting & Gaming spent hours pulling a full year of tickets into reports. The process was manual, slow, and always out of date by the time it reached leadership.
After rolling out Custom Charts, every team at Sky Betting & Gaming moved their reporting into Jira. PMs and team leads now surface multiple reports on a single screen with a few clicks, instead of rebuilding dashboards from exports. The team estimates the time per report dropped from about an hour to a few minutes, and all the data stays live in Jira.
Those dashboards can also be shared with executives who don't have access to Jira. Custom Charts' Shared Dashboards feature generates a shareable link, and they don’t need a Jira license to view the report.
Layer 2: The hierarchy layer – Structure PPM
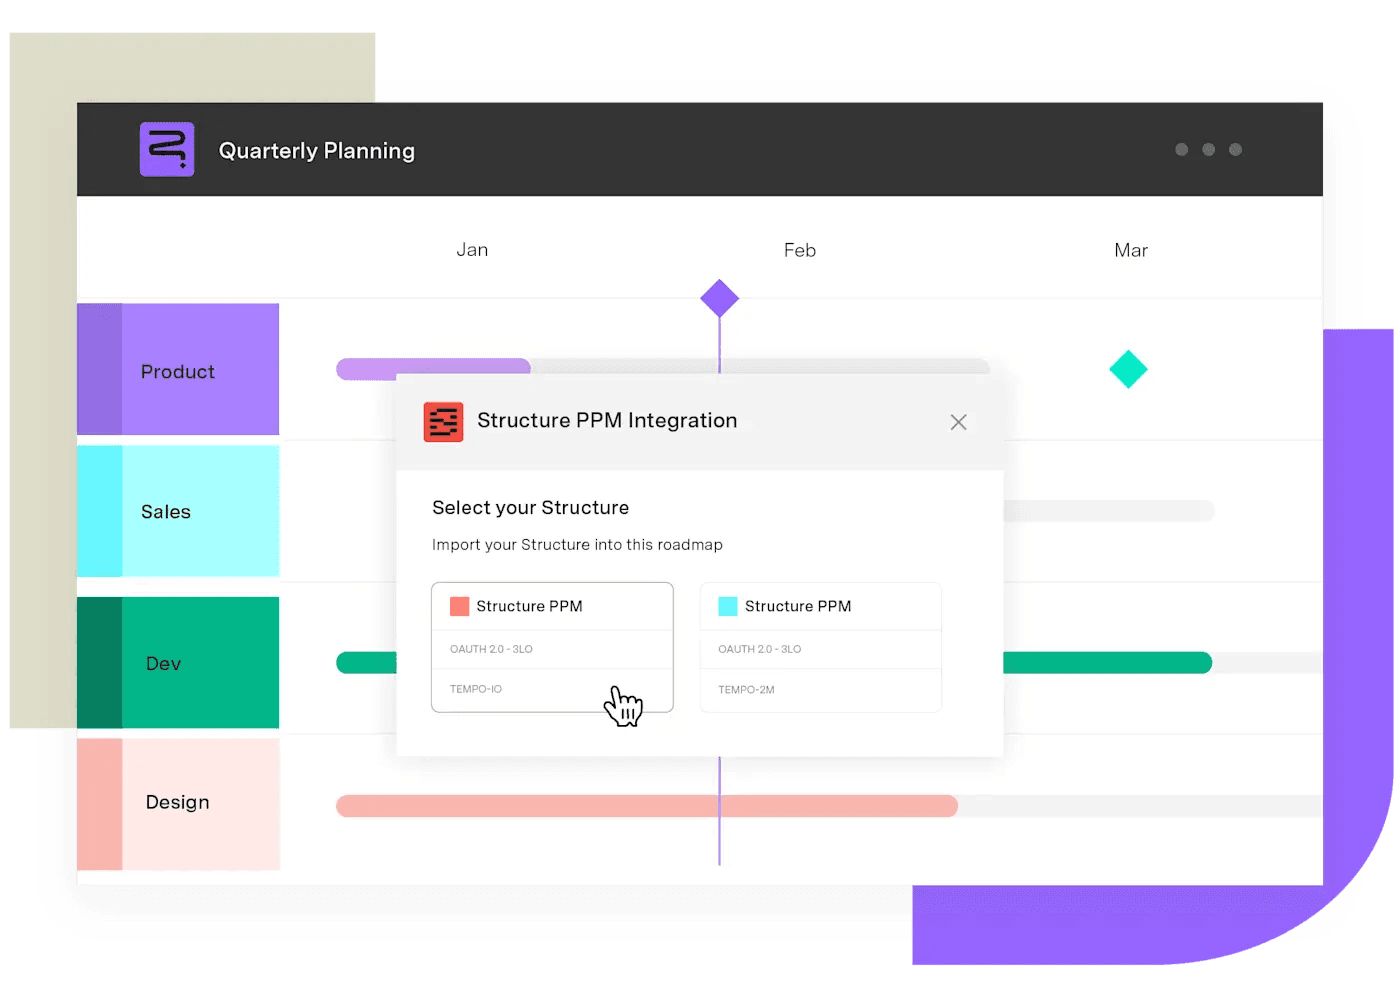
For portfolios that need to aggregate data at scale, Structure PPM handles what Jira Plans can't. Where Jira Plans tops out at 5,000 issues; Structure PPM handles 100,000+. It also adds a formula layer on top of your Jira data: Progress rollups, delay calculations, work breakdown structure (WBS) aggregation that's computed directly in the tool.
Kliuchnikov explains what that means in practice: "Structure has columns. And you can put a lot of data into these columns with formulas – a scripting language that allows you to juggle the data. Simple calculations like due date minus plan date to see a delay – not possible in Jira natively."
Layer 3: The financial layer – Tempo Timesheets + Financial Manager
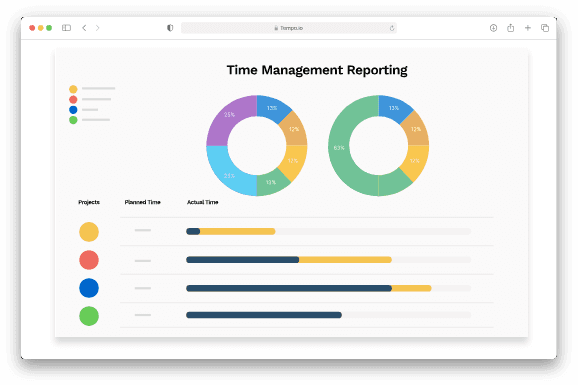
CapEx/OpEx tracking in a portfolio report requires time data connected to project categorization. Timesheets capture logged actuals at the ticket level. Financial Manager (Tempo's Cloud product for budget management), maps those actuals to financial categories. Together, they let you track CapEx versus OpEx at source, not estimate retrospectively.
This is the mechanism behind Savago's "audit-rigor-ready data points": Capitalization rates that hold up in a financial review, not numbers reconstructed at month's end. Loughead, on what happens when this setup is running, says, "If you're there using Financial Manager and Timesheets together, it's rainbows and happy noises from CFO departments."
Layer 4: The external reporting layer – BI Connector
For organizations already running Power BI, Tableau, or another enterprise BI system, Tempo's BI Connector moves Jira data to the external tool without custom API work. Most portfolio reporting use cases don't need it – it becomes relevant when you need to combine Jira execution data with ERP, HR, or finance data from outside the Atlassian ecosystem.
What makes portfolio reports get used
Portfolio reports often fail because they were built to document rather than to drive decisions. A few things separate reports that get used from ones that get ignored.
1. Define "on track" before building the dashboard: RAG status (Red/Amber/Green) means nothing without agreed criteria. Without a shared definition, two project managers will classify the same situation differently, and the portfolio view becomes noise.
2. One source of truth: The portfolio report should pull live from the execution system, not from a parallel spreadsheet someone on the PMO team maintains. When the report and the execution system can diverge, they will. You'll find out mid-meeting.
Start with the dashboard layer
Start with the question your CFO is actually asking. Build the report backward from there. The data is almost certainly already in Jira, and you can start with Custom Charts for Jira for free.


