
CEOs are asking their CTO and CFO: What did we get for the AI money we spent? Workforce Intelligence has the answer.
What is AI costing us, and what is it delivering? To get answers, we need more than a bill. We need an itemized receipt.

Shams Chauthani · CTO at Tempo Software

If you were to ask me how much AI is helping my team, I could hand you some great numbers on our usage and shipping velocity. If you then asked me to defend that number in a budget review and link those tokens to specific work... I might suddenly come down with the flu.
We get the AI bill every month, and it keeps ballooning. Every engineering leader is being asked the same things: What is AI costing us, and what is it delivering? Is it making us faster, and if so, by how much? Which AI tools are making the most impact?
To get answers, we need more than a bill: We need a receipt so we can see what each dollar of AI investment bought. Most leaders don't have the answers. What's missing is a connection between human effort, AI spend, and the engineering deliverables they produced.
When I joined Tempo, one of my first conversations with our CEO was how AI was reshaping the way we build. We were genuinely excited about it. All we had was a stack of invoices from GitHub, OpenAI, and Anthropic and a bar chart of seat activity.
“What did we get for this?” All we could do was stitch together some disconnected sources and guess. That didn't go over well with the rest of the room.
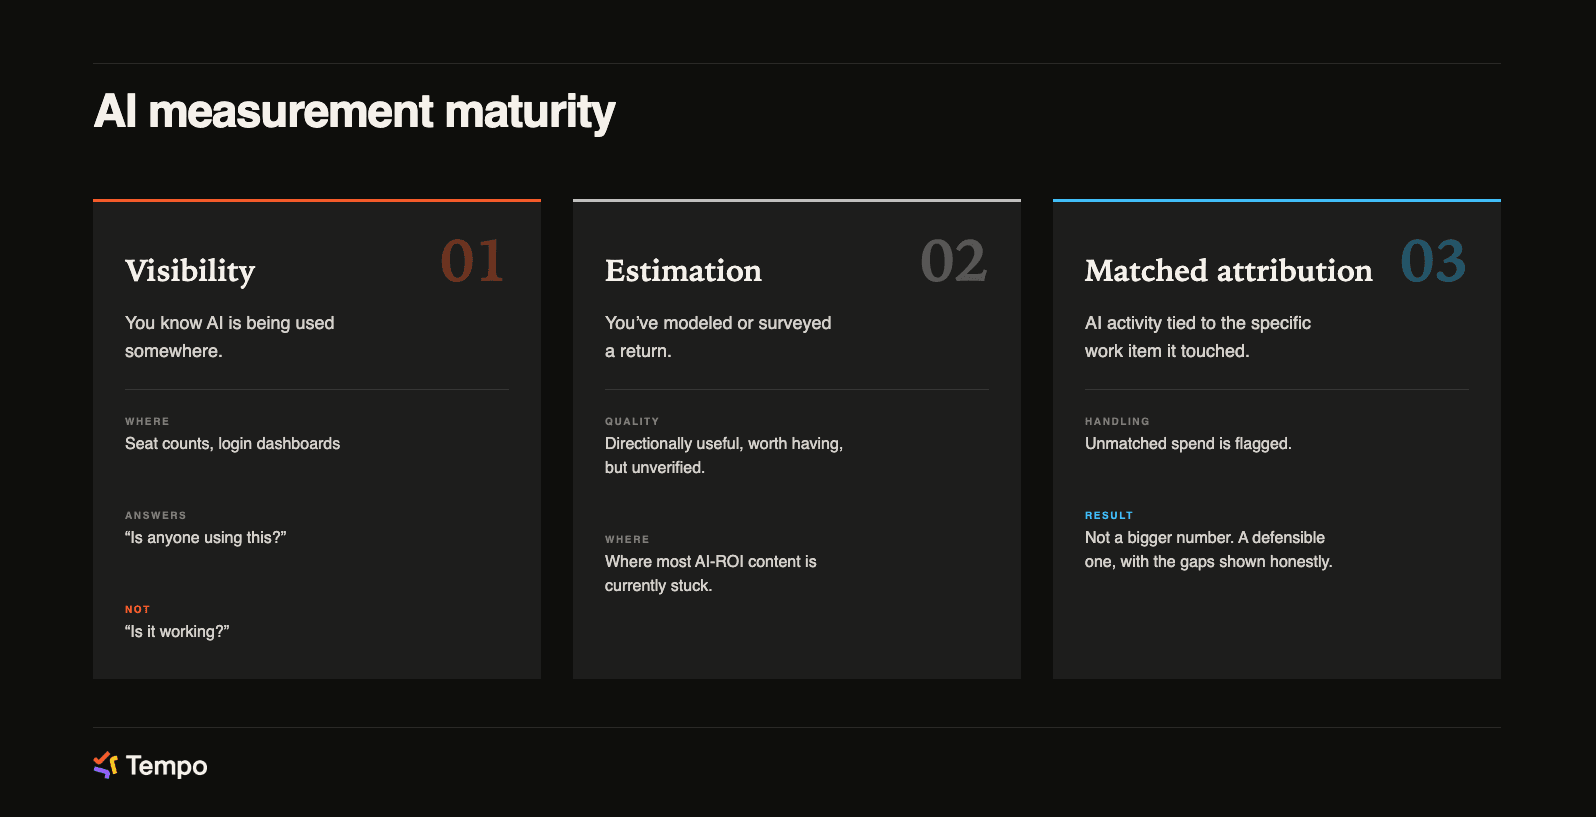
Part of the reason the answer is hard: The phrase AI ROI is doing three different jobs, and the industry blurs them together.
Term | What it measures | What it leaves out |
|---|---|---|
Adoption metrics | Seat counts, login frequency, feature usage | Whether any of that usage touched real, valuable work |
ROI estimates | Modeled projections, self-reported time savings | Whether the number reflects what happened |
Matched attribution | A verified record connecting units of work – human or AI – to specific funded outcomes | Nothing hidden. Every match is verifiable, every unattributed piece is visible and flagged. |
Cost tools tell you what you spent. Activity tools tell you what moved. Attribution ties one to the other. That third step is where most products in the market come up short.
PwC, BCG, McKinsey, Gartner, and MIT have all spent the last year and a half establishing the same basic fact: Companies are spending more on AI than ever, and most of them still struggle to show what the spending bought.
PwC's 29th Global CEO Survey found 56% of CEOs report neither increased revenue nor reduced costs from AI over the past year. Only 12% report both.
BCG's research on enterprise AI value found the median company realizes roughly 10% ROI on its AI investment, well under the roughly 20% most organizations targeted going in.
MIT's Project NANDA found 95% of enterprise generative AI pilots landed too small to measure on the P&L.
Gartner expects more than 40% of agentic AI projects to be canceled by the end of 2027. The cause is cost, unclear value, and weak risk controls.
Those data points show the same thing: AI spend and the work it produced live in separate systems.
Measurement tools often work backwards. They infer attribution from output – read the code, guess what generated it, and then back into a number. They produce correlation; finance teams need a receipt. And that receipt should be attached to work items, where each deliverable can be itemized – and tied to specific token costs.
A simple statement like “AI has helped us 20% this quarter” carries almost no information. What 20% changed? Which teams saw the impact? Which tickets moved differently, and which work moved slower?
Ethan Mollick's research at Wharton is useful here. His work on AI productivity gains draws an important conclusion: Workers self-report large gains from AI use, but self-reporting rarely holds up against controlled, task-level measurement.
Mollick's field research with Boston Consulting Group, studying AI's effect across 758 consultants, found the benefit ranged from dramatic improvement on some tasks to no movement at all on others. An aggregate “AI is helping” number smooths that variance away. Only work-item-level data can show where work truly benefited.
Averages work when the distribution underneath is even. This one is bimodal. The mechanism belongs at the issue-key level for that reason. A receipt has to be itemized before it can be summed.
Since AI cost attribution tools leave so many questions unanswered, leadership teams tend to question the ROI numbers they're handed. But distrust runs in the other direction too. Engineers avoid – and should be free to avoid – measurement systems that read their prompts or scan the code they wrote.
Many of the tools on the market right now haven't earned their trust. They scrape everything at the code level and they feel like surveillance. This is a design problem. If the system can see what an engineer typed, the trust question stays open even if the company promises to handle data with care.
So the design has to answer both audiences at once. Finance needs a number precise enough to defend in front of a board. Engineers need a boundary strict enough to preserve their working conditions. Most tools in this space pick one side.
The way through is to build a system that captures enough metadata – who, when, how much, which model – to answer finance, and reads none of the content that would rightly make engineers suspicious. The technical decisions follow from that constraint.
A small group at Tempo built the prototype we wanted for ourselves. Simple to start – pull data from the source-repo system and the ticketing system, and tie them together at the level where the work lives: The ticket, the epic; the strategy above them.
Once it was running against Tempo's own workforce, we found that roughly a quarter of our AI spend couldn't be linked to any funded initiative. It was legitimate spend, like maintenance, tech debt, or refactoring – and most of it was necessary. We hadn't decided to put a quarter of our AI budget there, and until we could see it, we couldn't make a call either way.
That's the underlying situation for most engineering organizations. A large volume of legitimate, unfunded work runs beside the funded work, and current tools show cost per person. Ticket-level attribution shows the purpose the spend served.
Workforce Intelligence is built around four steps: Capture, tag, connect, verify.
Cost comes from the provider APIs we connect, straight from the vendor's own usage data.
Provider coverage depends on how each vendor exposes cost. Anthropic session cost flows in directly. GitHub Copilot ships as a flat per-seat subscription; its API exposes seat billing rather than per-session cost, so we detect Copilot from commit metadata instead – plus 21 other AI tools, including Cursor. Detection runs server-side. Developer machines stay untouched.
The system reads session metadata – user, cost, model, branch. Source code and prompts stay out of scope. Engineers trust a measurement system more when the tool works from metadata alone, and that trust drives adoption harder than any dashboard feature.
When a session's code lands on a branch carrying a Jira issue key, its cost resolves to that ticket, rolls up to the epic, and joins the human hours already logged there. When a session's activity crosses multiple tickets on the same day, the cost splits proportionally across them by the work involved.
Drift, unattributed spend, and uneven adoption become visible while the cost of fixing them is still low. When no clean match ties a session to a work item, the spend appears as unattributed rather than force-fit to the nearest ticket. Capture and Tag deliver visibility. Connect delivers governance. Verify opens optimization.
Attribution gives you a fact base to spend from – an itemized receipt, to carry the metaphor. Every AI decision that lands on your desk – which models to consolidate, which contracts to renegotiate, how to plan headcount against AI-assisted throughput, where to double an investment and where to pull spending down – runs off the same underlying question:
What outcomes did I get, and at what cost?
The balance-sheet version of that question is capitalization. Under existing R&D accounting standards, the development-related portion of AI spend qualifies for capitalization – provided the finance team can trace which spend went to which project, ticket by ticket, with any unmatched portion shown honestly rather than papered over with an estimate.
On a large AI bill, that trace decides whether the spend lives on the P&L as expense or moves to the balance sheet as capitalized development cost. Attribution turns it into a CFO decision the auditor can accept.
Attribution tells you where you stand – a rare capability in this market. It gives finance a defensible number to bring to the board. It gives engineering leaders a lever they can pull with confidence in front of the CEO. It gives team leads a coaching signal that keeps prying and surveillance out of it.
And it gives the engineers who made the work a fair, accurate accounting of the value they created.
Turning AI spend into proof-of-value looks like this. The next question – what to do about it, how to reallocate while a quarter is still open – is where Intelligent Portfolio Orchestration begins. Attribution is the receipt. Orchestration is the next act.
Tempo has spent twenty-five years accumulating operational data on how work becomes output, mostly through Timesheets and Structure. We've been earning these insights and building a foundation that predates the AI conversation. Get in touch if you're ready to solve these challenges.
Sign up for a demo
Request Demo
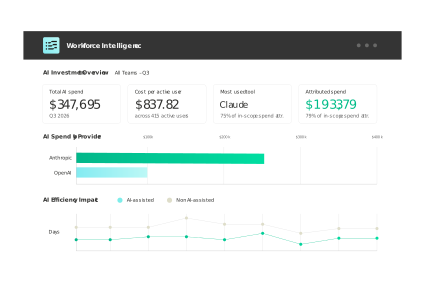
Workforce Intelligence
The only solution that ties AI vendor spend to the teams, epics, and Jira issues it supported.
Start a Free TrialCEOs are asking their CTO and CFO: What did we get for the AI money we spent? Workforce Intelligence has the answer.

Engineering intelligence platforms measure delivery, but 2026 buyers also weigh AI-effort attribution. Compare the tools and how to choose one.

Workforce intelligence captures human effort and AI activity per Jira ticket, so finance can classify AI costs and prove ROI to the board.

AI spend management software controls buying and meters usage. See the leading tools and how finance attributes AI cost to the work it produced.

SDLC best practices for every phase, and how AI in SDLC workflows changes them. Learn to record AI effort in Jira.
Tempo Workforce Intelligence connects AI tool usage to Jira work items so leaders can see what their AI investment is really delivering.

Strategic workforce planning still runs on headcount. For CIOs planning human and AI-agent teams, here's how to understand real capacity and cost.

If you’re someone with a non-technical background, the acronym API might not mean much. Here, we'll dive into the question, "What is an API?"

In this blog we’re not going to explain what project forecasting is. No, we’re going to explore how you make your forecasts more accurate.
















