
New report: The 2026 State of SPM
Tempo Team
Key Takeaways
81% vs. 45% execution gap between organizations practicing advanced portfolio management techniques and traditional organizations
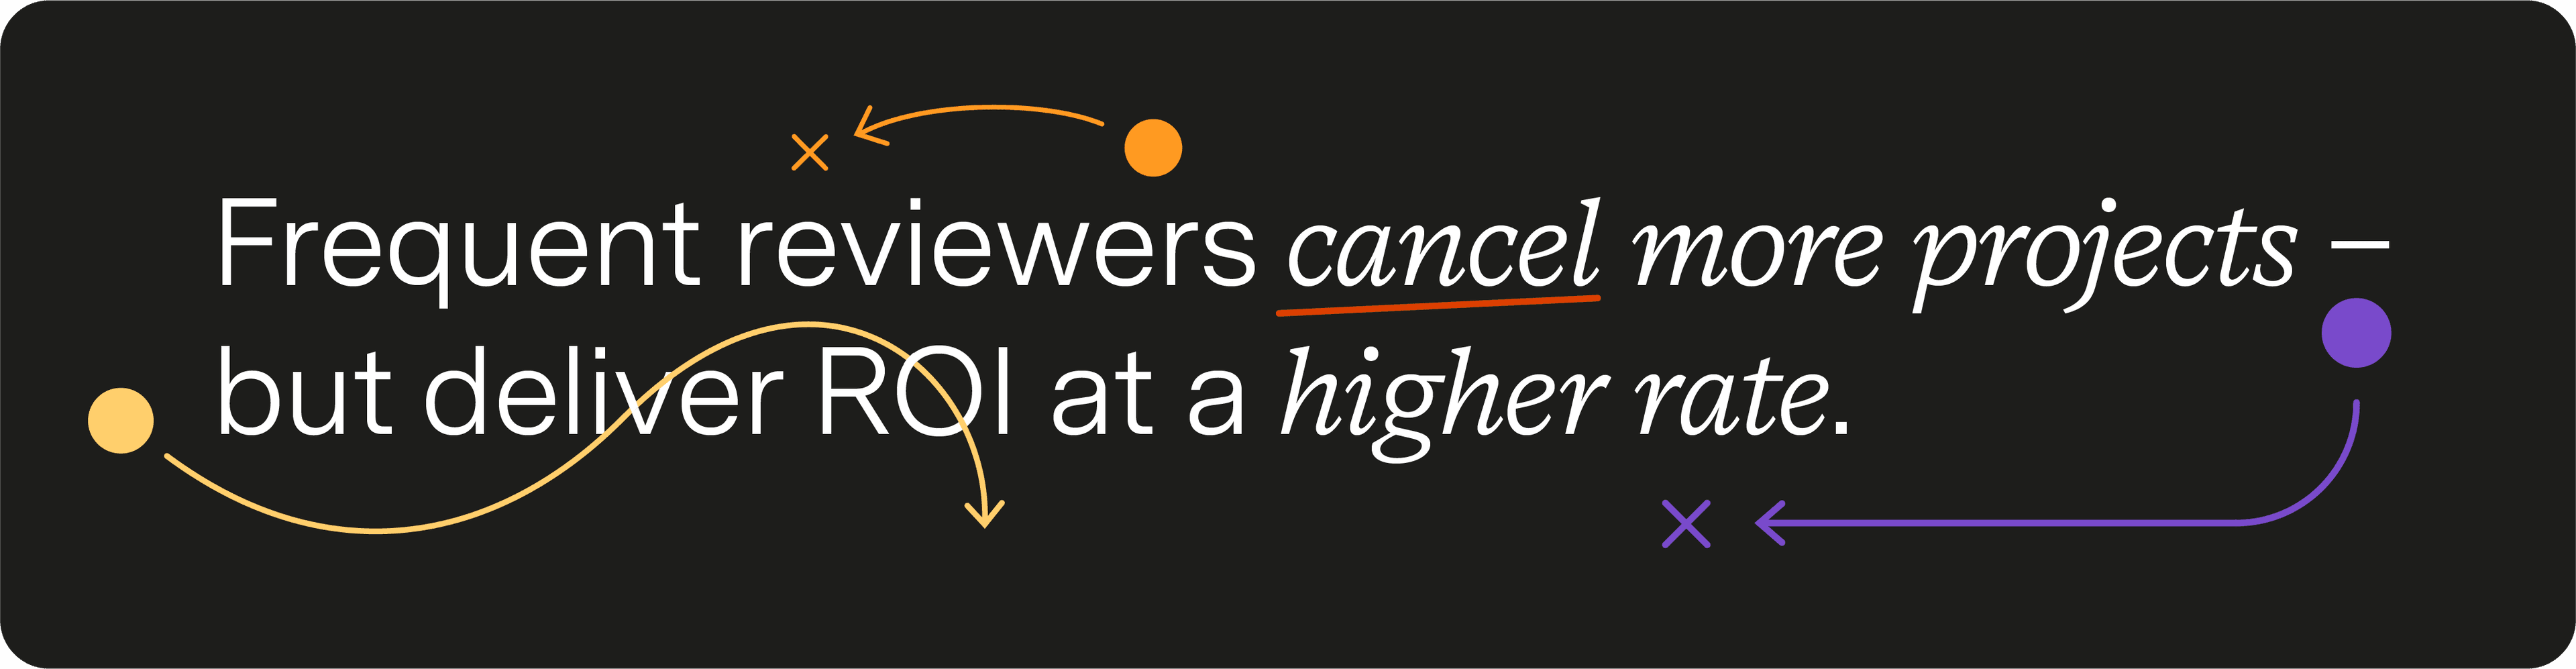
Teams that are canceling more projects overall are delivering ROI more efficiently
Almost one out of every three projects (30%) isn’t delivering meaningful ROI or strategic value
Foreword from Vic Chynoweth, CEO at Tempo Software
Welcome to the 2026 State of SPM report. We did this research to find out what is actually working for companies when they are trying to turn their strategic plans into strategic outcomes.
Strategic Portfolio Management is fundamentally about resource allocation: Are you dedicating money, people, and time to the work that drives measurable value? Simple concept. Hard execution.
This year's data is clear: Organizations practicing real SPM principles have a 32-percentage-point advantage in the share of projects delivering measurable ROI or strategic value compared to those stuck in annual planning cycles.
This report separates what's working from what's wishful thinking. My hope is that it helps you identify where your organization actually stands, what's holding you back, and what separates confidence from results.
Thank you for taking the time to explore the State of SPM with Tempo.
Methodology
Tempo Software conducted a survey of 667 planning and PMO leaders across 43 countries between October 28 and November 21, 2025. The survey captures perspectives on portfolio management maturity, project visibility, resource and budget agility, decision cadence, scenario planning adoption, value realization, and AI usage in enterprise planning.
Chapter one: Strategic drift
You’re not even aligned on being aligned

90% say their organization encourages adaptability and alignment across all teams
What happens when strategic plans gradually misalign with reality? It’s known as strategic drift, and it’s a true killer of enterprise value – costing hundreds of millions per year.
This report offers a snapshot of how it happens. The vast majority of organizations claim that they encourage alignment across teams – they want to believe high-level strategy is linked to the work being done on the ground. However, strategy starts to drift.
While respondents claim to be aligned, planning leaders crave cross-functional alignment more than anything else – as this year’s survey reveals.
"Which area would most improve your ability to deliver strategic outcomes?"
When we followed up and asked about the biggest barriers to executing their plans, cross-team alignment was one of the top culprits.
Something is going wrong.
Chapter two: The true cost of poor planning
The difference in ROI between mature and siloed portfolio management
While our perceptions can be flawed, you can’t run from the numbers.
The survey found a big difference in results between the teams with more mature processes and those operating in siloes. By this – we mean companies that have adopted capacity planning tools, measure resources against availability, and use scenario planning.
Overall, the organizations we surveyed reported that 70% of projects across the business are delivering measurable ROI or strategic value – meaning almost one out of every three projects isn’t delivering.
Projects delivering meaningful ROI
Over 33% of projects are canceled or stopped early due to misalignment or lack of ROI.

We’ll return to those cancelled plans later in chapter four – as the cancellation paradox arises with an interesting finding.
Teams that use scenario planning see a 17% percentage point advantage in ROI delivery compared to those who don’t use any scenario planning software.
What is scenario planning?
This is the use of tools that do “what-if” simulations – allowing you to model outcomes based on changes in scope, capacity, timing, and problems that can arise.
When we asked what factors are holding teams back, it became clear why scenario planning is such an advantage: The top three challenges are around which projects to prioritize and how to allocate people.
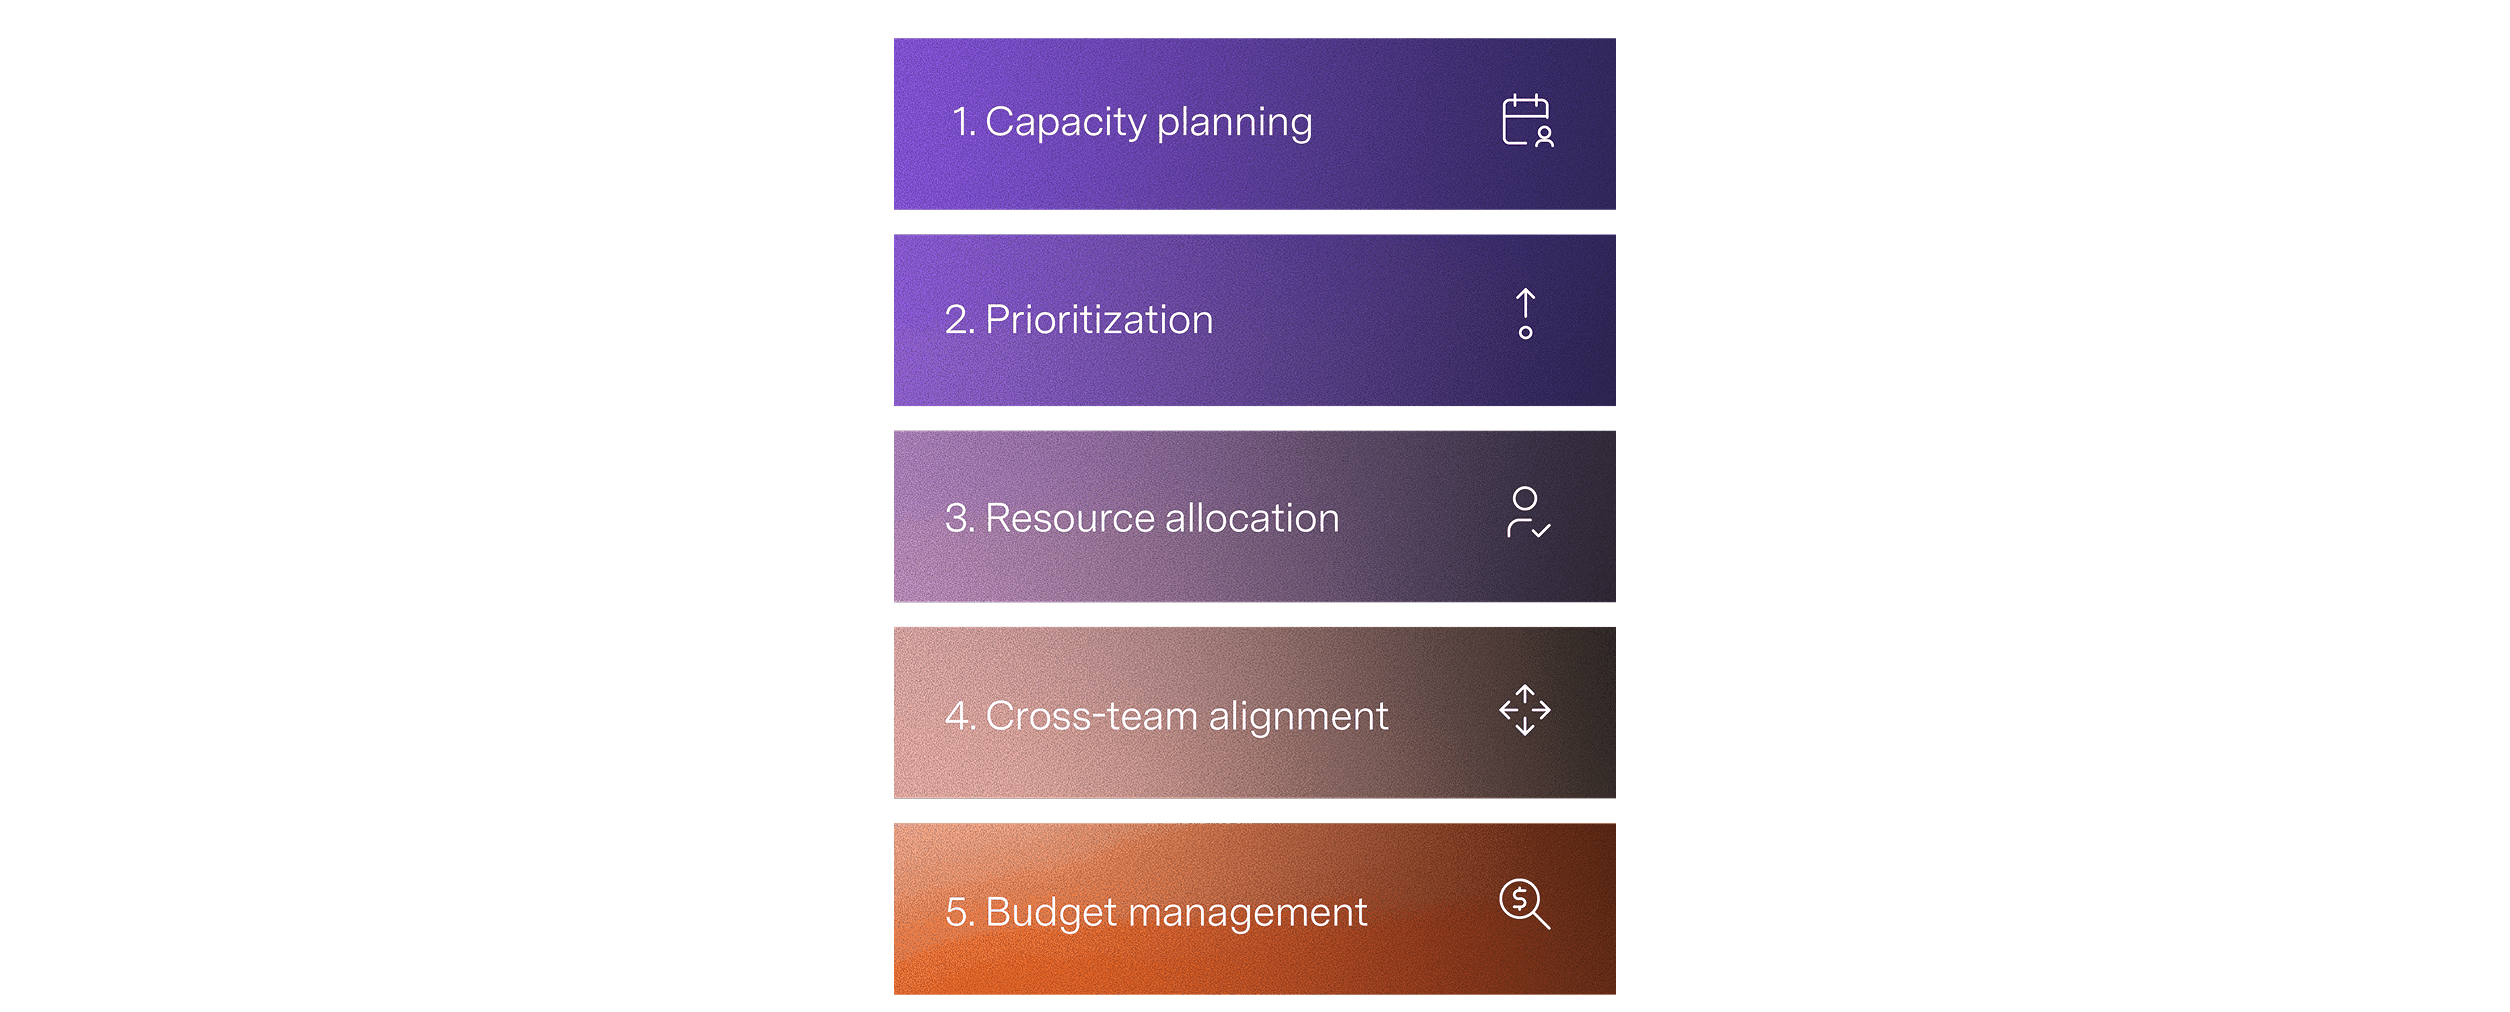
“This data reflects exactly what we see with our clients: The number one barrier to strategy execution isn’t vision, it’s capacity. Strategy fails when capacity is assumed. It succeeds when capacity is measured.
Michiko Quinones, Principal, Data Intelligence and Architecture, Praecipio
The scenario planning gap
We continued exploring the benefits of scenario planning and found that 85% of companies using it are extremely or very confident about adapting to change, vs just 46.3% of non-users – a nearly 2x difference on the top-reported issue for successful execution.
Additionally, scenario planning users are 3x more likely to use AI extensively in planning (36.3% vs 11.6%).
Because the teams that cancel more projects are delivering more ROI, it is hard proof that the most ambitious goals don't drive success – rather, success comes from goals that adapt to reality and keep people’s capacity and resources in mind.
Chapter three: The silo situation and how to fix it
What leaders are doing to succeed
When asked about what they see as their greatest concern for portfolio success in 2026, it wasn’t AI that brought the most stress.

"What are your top concerns for portfolio success over the next 12 months?"
1. Speed of change
2. Market volatility
3. Budget constraints and resource allocation
4. Talent shortages
5. Lack of visibility
6. Technology adoption / AI integration
This paints a picture of nervous markets – where leaders are worried that changes that are out of their control are going to rock their way of working.
However, when we asked which factors are most important for making portfolio decisions, external factors fell to the bottom. Ultimately, serving customers and delivering against the bottom line tops the list.
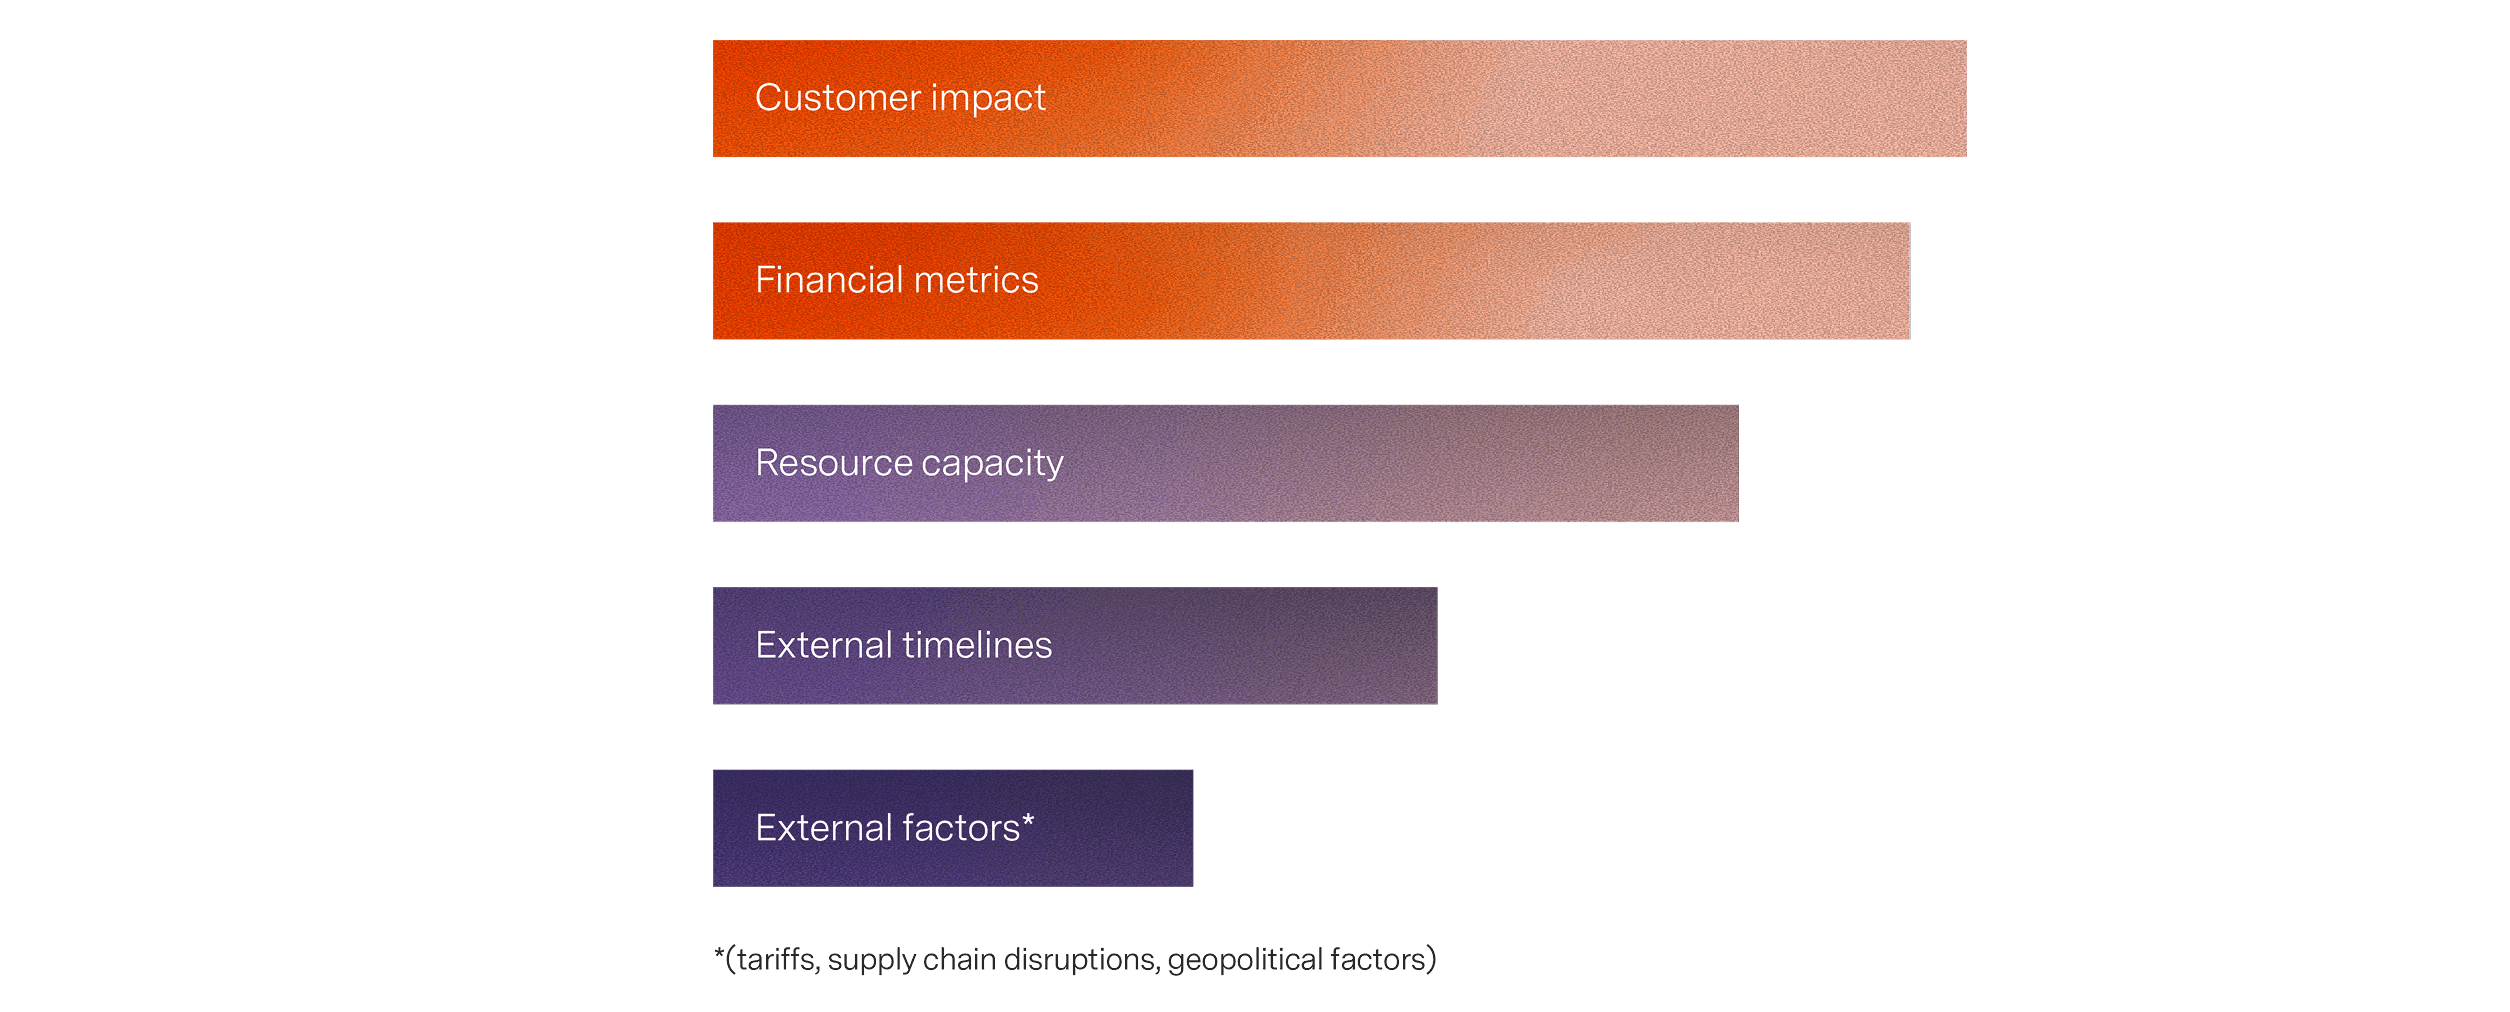
"Which of the following are the most influential in portfolio decisions?"
1. Customer impact
2. Financial metrics
3. Resource capacity
4. External timelines
5. External factors (tariffs, supply chain disruptions, geopolitical factors)
“The most resilient companies aren't ignoring external risk, they're aligning strategy with execution and client impact, all backed by clear metrics. "
Thad West, CEO, Isos Technology
Organizations with integrated portfolio processes report that 14% more projects deliver ROI than those operating in silos.
Our data shows that portfolio management tools and strategy are being implemented effectively within teams – however, these initiatives clash with other departments that have different demands, different tools, different processes, and are aligned to different goals.
Silos strike back
We asked respondents to characterize their organization’s portfolio management processes. Around 10% said they’re siloed, with 23.3% saying they’re lightly integrated across product pillars.
However – 34.1% report that their portfolio management processes are fully integrated within their team, but not across the business. Almost the definition of siloing.
If you look specifically at companies that feel their company doesn’t prioritize alignment, the problem is even more pronounced: They’re much more siloed (41.5%) than the overall sample (10%).
Siloed portfolio processes are a disadvantage across the board, as the results show:
Just 37% say they have good or complete visibility across projects, compared to 82% of those with fully integrated processes.
Only 40% are confident their company can adapt quickly to market or business changes, compared to 81% of those with integrated processes.
Less than half can reallocate resources in <2 weeks when pivoting plans, compared to 62% of integrated companies.
TL;DR: Siloes really do hold you back.
Chapter four: The cancellation paradox
Mama should have raised more quitters
While scenario planning was one of the strongest individual issue gaps for success, there was a strong runner-up as an indicator for team success: Review cadence and re-evaluation.
As we shared earlier, 70% of projects across the business are delivering measurable ROI or strategic value – that, of course, means 30%, or nearly one in every three projects, isn’t delivering.
One of the top difference-makers, the data shows, is when teams frequently review their work and plans – changing (or even canceling) them – and pivoting to new ideas.
The cancellation paradox
We found that the more mature your planning and portfolio management – the more projects get canceled. This isn’t due to a failure of planning – it is a change in the way we view planning.
The more often you review and update your plans, the more you know when to adjust to market changes, and make changes when roadblocks appear, or when resources and capacity shift.
How frequently does your organization re-evaluate and adjust portfolio priorities?
The teams that struggle are the ones that don’t review, so they don’t change their plans and are left hammering away at failing projects that should have been shelved long ago. This means frequent reviewers cancel more projects – but more of those projects deliver ROI.
Reforecast every 2 weeks or more
Mean percentage of projects delivering ROI
Mean percentage of projects cancelled
Math time! The ROI calculator
It can be hard to take all these numbers and stats and understand the impact on reality. To help with this, we’ve prepared a breakdown based on a sample enterprise company.
To start, let's crunch the numbers with real examples – based on 30 academic papers and informed by 70–80 studies around how people approach planning.
Reports often show that 30–40% of initiatives don’t deliver intended benefits. So 35% is a conservative midrange.
Portfolio studies commonly find 10-30% of active work is weakly aligned, duplicative, or legacy. So 20% is a conservative midpoint.
Now, benchmark $100/hr as the default for a fully loaded employee (salary, bonus, benefits, taxes, overhead), which is conservative for an enterprise.
Cost-of-delay literature often uses 1-5% per week depending on market exposure. So let’s go with 2% as a cautious estimate.
Tallying that up:
35% of initiatives don’t deliver intended benefits
20% of active work is weakly aligned / duplicative / legacy
$100/hr per employee
2%/week cost of delay
So what’s the damage?
For an example company with $880M in strategic spend, that’s $260M annually lost. Recoverable waste? $75M to $85M annually.
Every day spent reallocating resources = $200k-$500k in waste.
ROI impact calculator
Adjust the inputs to see how portfolio waste and value at risk change.
Industry benchmark: 35%
Industry benchmark: 20%
Industry benchmark: 2%
Industry benchmark: 25%
Estimated waste from failed initiatives
$308,000,000
Estimated waste from misaligned work
$176,000,000
Total potential annual waste
$484,000,000
Cost of delay from reallocation lag
$17,600,000
Daily cost of delay
$3,520,000
Total estimated value at risk
$501,600,000
Projected annual savings
$125,400,000
Based on 25% reduction.
"When visibility improves, organizations don't just save time – they prevent millions in wasted spend and accelerate delivery of the work that actually matters."
Jess Fraser-Darling, Director of Atlassian Solutions at Eficode
Chapter five: Planners vs Plodders
The difference SPM makes
To fully understand the advantages of adaptivity, we see that the companies embracing all the difference makers above are seeing the best results.
We’ll call this group Dynamic Planners, and they account for about 1/10 of our overall sample. These high-performing teams have four key attributes.
Dynamic Planners
1. Their business encourages adaptability and alignment across all teams
2. They use scenario planning
3. They adjust their plans monthly or even more often
4. Their portfolio processes are integrated across product pillars or adopted and integrated across the business.
The second group have the opposite traits.
The Plodders:
1. They report that their business doesn’t encourage alignment
2. They don’t use scenario planning, and often have no plans to implement it
3. They adjust their strategy annually or quarterly at best
4. Their portfolio processes are siloed or only integrated within specific business functions
It can’t be overstated how differently these groups are performing:
Notably, the ROI gap between these groups is substantial. A full 81% of Planners’ projects deliver measurable ROI compared to 45% of Plodders’ projects.
This is where the gap between perception and reality narrows down – as the Planners actually have the data to back up the confidence they have to adapt to change.
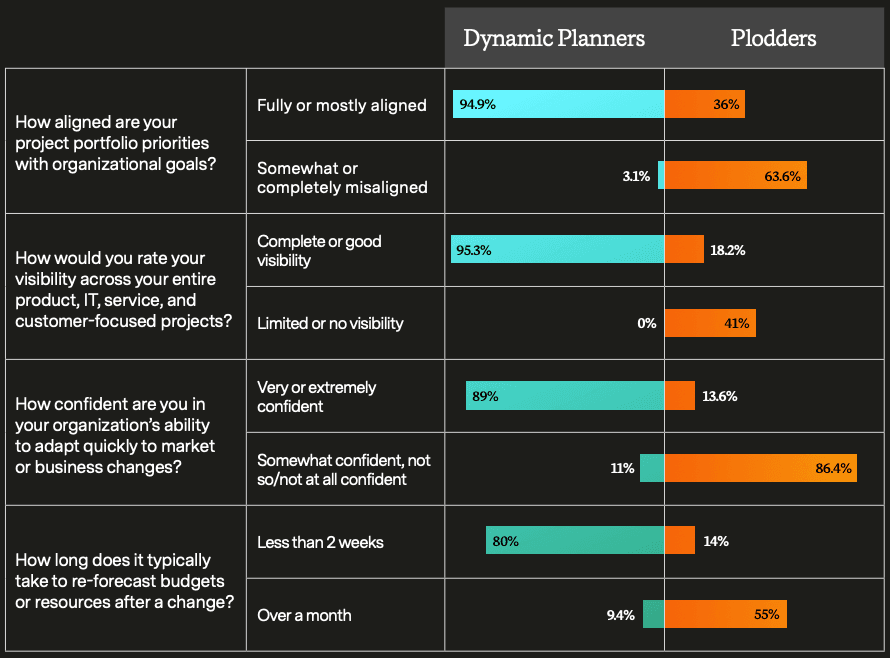
Planners can re-forecast budgets and resources quickly: Only 55% of our overall sample is able to reallocate in less than two weeks, but 80% of Planners can hit that two-week target.
“That disconnect isn’t about confidence – it’s about decision friction. Adaptability isn’t measured by how leaders feel, but by how fast organizations can reallocate capacity when priorities shift.”
Vando Gonçalves, Solutions Architecture Specialist at e-Core
Planners vs Plodders 2: Plan Harder
Visibility gap is dramatic: 95.3% vs 18.2% (+77.1 pts). Zero Plodders have "complete visibility" and more than four in ten have limited or no visibility across portfolio projects.
Alignment gap is dramatic: 95% vs 36% (+59 pts). Over half of Plodders (63.6%) report somewhat or complete misalignment with organizational strategy.
AI adoption: No Plodders use AI extensively (0.0%), while 30.3% of Planners do.
SPM was developed to tackle these problems – and it appears to be working.
Conclusion: All according to plan
So is SPM working? The data says yes. Not because it promises certainty, but because it’s built for change.
The highest-performing teams aren’t clinging to perfect plans or heroic roadmaps. They’re reviewing frequently, creating alignment across teams, reallocating resources without drama, and canceling projects early when the numbers stop adding up.
The “cancellation paradox” turns out to be one of SPM’s biggest strengths: Fewer sunk costs, more focus, and higher ROI.
After decades of making our tools for delivery the most fine-tuned machines they can be – it is about time we apply that energy to our planning. Priorities will always shift, markets wobble, and problems will arise. SPM is giving teams something far more valuable than a static roadmap: The ability to keep choosing the right work, at the right time, with eyes wide open.
Download the full report to see the measurable advantages of integrated processes and scenario planning, and get a framework for identifying what's holding your team back.


