

Compare the 7 best software development analytics tools of 2026 across delivery, developer experience, and R&D capitalization.
The tools worth your team's time this year, grouped by the job each one does

Key Takeaways
Developer productivity tools that help a team do the work and the ones that show whether the work is on track against the hours available
Five categories cover most of what an engineering org needs in 2026, from AI coding assistants to the tools that read delivery data
AI coding tools are now used daily by most teams, which increases the value of measuring real output over raw activity
Tempo reads delivery data from Jira, so a leader sees output against the hours a team really had that quarter
Ask ten engineering leaders how to measure developer productivity, and you'll hear ten different answers.
The reality is there are so many tools to choose from, each one measuring developer productivity in different ways, that there’s no one right answer.
The hard part is choosing which one you need. This guide sorts the tools by the job each one does, from writing and shipping code to reading how delivery actually went, so you can match a tool to tasks where your team loses the most time.
Developer productivity measures the efficiency with which an engineering team transforms effort into functional software for end-users. The emphasis lies on "efficiency," as productivity is defined by strategic outcomes rather than mere activity. This distinction is important because organizations frequently rely on easily quantifiable metrics, such as commits, lines of code, and tickets closed, which may not accurately reflect true value creation.
Two frameworks dominate developer productivity metrics in 2026.
DORA (DevOps Research and Assessment) measures delivery through four signals: Deployment frequency, lead time for change, change failure rate, and time to restore service. Together they show how efficient a team is at shipping products.
SPACE widens the lens to satisfaction, performance, activity, communication, and efficiency. That captures the parts of productivity delivery metrics miss, including how developers feel about the tasks at hand. A team might post clean delivery numbers, but they also might feel burned out.
Both frameworks share a limit worth knowing before you choose a tool. Each measures the work, and neither measures the capacity behind it. A metric is only as trustworthy as that capacity data.
Velocity reads like a productivity signal, but it blends how fast a team moved with the hours left after incident load and unplanned work took their share. Without that context, the same number can make a struggling team look strong, and a strong team look weak.
There's also a newer piece neither framework was built for: How much of the work AI now does, and whether that shows up against real capacity. So when you weigh tools, ask whether they cover the metrics you actually plan against, capacity and AI-blended effort included, or only the ones that are easy to count. That is why a capacity-measurement tool belongs in the stack, next to the tools that speed up the work.
Below, we've organized developer productivity tools into five categories: AI coding assistants, code-review bots, CI/CD automation platforms, code-search engines, and delivery-analytics tools. All position themselves as productivity software, but each does a genuinely different job.
Over the past year, AI coding assistants have transitioned from pilot programs to daily implementation. This category is evolving more rapidly than any other in the field.
GitHub Copilot provides inline code suggestions and answers questions about a codebase in the editor. It’s the most widely adopted assistant. It integrates with GitHub and popular editors, making it the default first choice for many teams. However, while it’s effective for general use cases, it may be less effective for specialized tasks.
Cursor is an AI-native editor that indexes entire codebases to provide context-aware suggestions and manage multi-file edits from a single instruction. The trade-off is that teams need to adopt a new editor. Teams report the biggest lift on unfamiliar code, where repository-wide context saves the developer from hunting through files to find the right place to make an edit.
Claude Code runs as a coding agent in the terminal. It reads a codebase and turns issues into pull requests, handling multi-file edits along the way. That suits developers who prefer working at the command line. For a one-line change, it can be slower than editing the file manually.
Windsurf is an agentic editor for teams that want an alternative to Cursor. It combines codebase-aware assistance with cloud agents that are capable of working on more time-consuming tasks. Like Cursor, it is strongest once a team adopts the editor itself.
Review is where completed code waits. Delays in this phase often impact delivery times more than the initial development phase.
CodeRabbit reads a pull request the moment it opens and posts line-by-line feedback that includes severity levels and one-click fixes. It integrates with GitHub, GitLab, and Bitbucket, Atlassian's Git host, allowing teams to use it without switching to another tool. The line-by-line pass accelerates the initial review process without adding a reviewer to the rota.
GitLab manages the entire lifecycle, from planning to deployment in one. Built-in security scanning reduces the number of separate tools a team maintains. It suits organizations that prefer a single platform to a stitched-together toolchain. It may be less cost-effective for teams that only need specific review capabilities.
Continuous Integration and continuous deployment (CI/CD) pipelines turn merged code into production-ready software, so a slow or unreliable one limits the pace of everything upstream.
Buildkite runs builds and deployments on a team's own infrastructure while managing cloud-based orchestration. That split gives control over the build environment without the upkeep of a self-hosted server. It scales effectively for heavy or highly parallel test suites, where hosted runners tend to slow down.
CircleCI is a dedicated pipeline platform that provides granular control over build environments and parallelism. It works across code hosts, and its caching and concurrency controls shorten feedback time on large builds. Teams that outgrow a bundled CI often move here for the control, then spend some of the time they save on configuration.
Once code is written, three jobs remain: understanding an unfamiliar codebase, securing it, and diagnosing what goes wrong in production.
Sourcegraph provides code search and context across large, multi-repository codebases. It helps developers and agents work in systems that exceed individual cognitive capacity. . The value shows up mainly on large or legacy infrastructures. A small single-repo team will find the setup excessive for their needs.
Snyk Code scans for vulnerabilities in code during development. It surfaces issues in the editor, pull requests, and pipelines, providing explanations and suggested fixes. It runs as code is written, so it catches vulnerabilities before they reach review and cost more to undo.
Sentry Seer diagnoses production errors from the telemetry a team already collects. It identifies a root cause and drafts a fix based on available team data. The diagnosis is only as good as the telemetry, so it’s most valuable for teams already using the Sentry platform.
This category checks whether progress matches the real capacity a team has. Real capacity is the hours left after incident load, on-call, and unplanned work take their share. Without that baseline, a team running several incidents can look less productive than one with a lighter load.
Tempo Workforce Intelligence leads this category. It reads delivery data from Jira and reports output against the hours a team really had.
It also captures blended effort, the mix of human work and AI activity on a single work item. That lets a leader attribute AI cost to a specific initiative rather than a team-wide total. Most delivery-analytics tools stop at team-level AI adoption. Workforce Intelligence ties the work-item record to the initiative. A VP of Engineering can then show whether AI investment turned into delivered work. Finance gets the same record to classify the spend as CapEx or OpEx.
Workforce Intelligence is more accurate with the best-possible effort data beneath it, which comes from two Tempo products.
Tempo Timesheets captures hours against Jira issues, drawn from calendar and development activity. Engineers confirm the suggested entries as they work. Finance sets CapEx and OpEx classification once at the project or issue-type level, and it applies to every confirmed worklog. Setup takes the most effort at the start, then runs on its own.
Tempo Structure builds a portfolio view inside Jira. It rolls issue data into the hierarchy an org plans against and updates as the work changes. Matthieu Beaufils, Corporate Application Manager at Rexel, describes what that gives his teams. "With Structure, we have a cockpit for managing work."
Together they feed Workforce Intelligence the hours and the hierarchy. The output it reports then rests on real capacity, not raw activity.
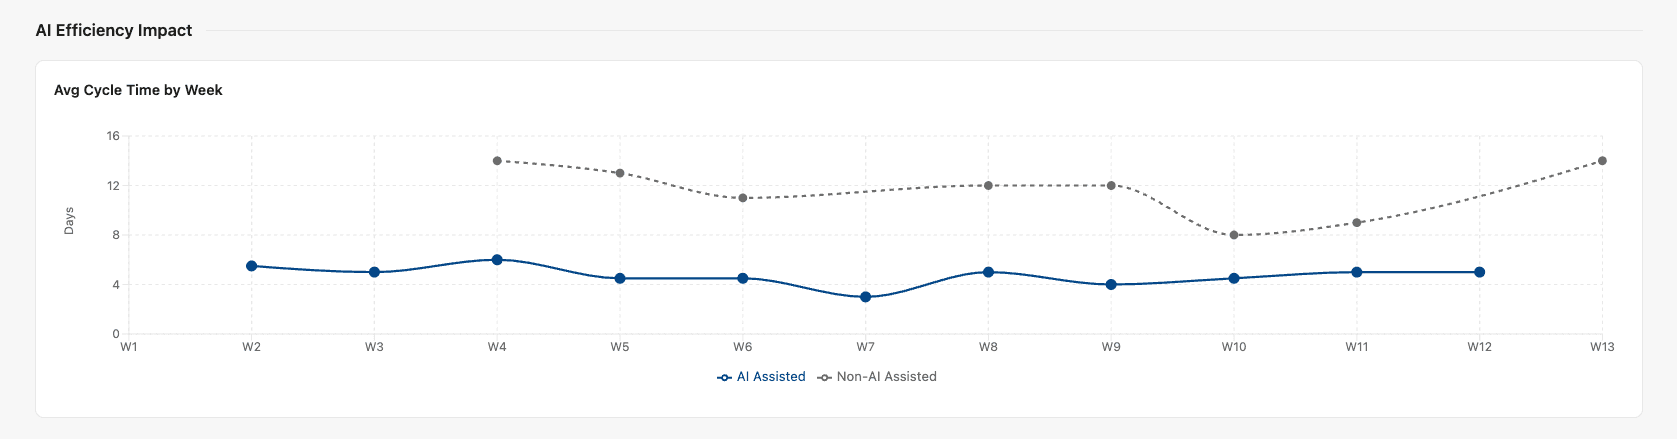
The payoff shows up in audits and budgets. After moving time tracking into Jira with Tempo Timesheets, TransUnion reduced annual time-tracking costs from $1 million to $62,000. It also reduced its Authority for Expenditure approval chain from 17 approvers to four.
Tool | Category | Best for | Where it fits |
Tempo Workforce Intelligence | Capacity measurement | Output against real capacity | Jira-native engineering orgs |
GitHub Copilot | AI coding assistant | Inline suggestions in the editor | Teams on common editors |
Cursor | AI coding assistant | Whole-repo context and multi-file edits | Teams standardizing on an AI editor |
Claude Code | AI coding assistant | Agentic work from the terminal | Command-line developers |
Windsurf | AI coding assistant | Cloud agents inside an editor | Teams wanting a Cursor alternative |
CodeRabbit | Code review | AI review across code hosts | Teams on any major Git host |
GitLab | Code review | One platform from plan to deploy | Teams consolidating tools |
Sourcegraph | Code search | Context across large codebases | Multi-repo organizations |
Buildkite | CI/CD | Self-hosted builds, cloud orchestration | Teams needing environment control |
CircleCI | CI/CD | Complex, parallel test suites | Teams across multiple code hosts |
Snyk Code | Security | Developer-first vulnerability scanning | Teams shifting security left |
Sentry Seer | Debugging | Root-cause help from production data | Teams with telemetry in place |
Start with one question. Where does your team lose the most time?
If the answer is writing or shipping code, a tool measuring delivery against capacity will not accelerate it. Reach for an assistant, a review tool, or a pipeline automation platform first. Pick one that integrates with your existing stack. A team already on GitHub gets more from tools that live there than from a better product sitting outside it.
If you want to know if work is on track, look at the capacity-measurement category. Remember, a leader who sees delivery against actual capacity can defend a roadmap and price the next initiative honestly.
Most orgs past a certain size run tools from several categories, because the jobs are genuinely different. A faster editor or a cleaner pipeline still cannot tell you whether the team was productive against its actual capacity.
Measuring how fast a team ships is solved. Measuring AI's share of the work against real capacity is what you need now. See how with Tempo Workforce Intelligence .
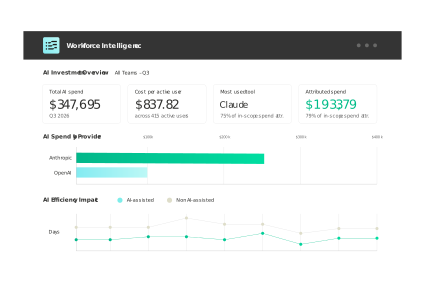
Workforce Intelligence
The only solution that ties AI vendor spend to the teams, epics, and Jira issues it supported.
Start a Free TrialCouldn't find what you need?Go to our documentation
Often, though not automatically. AI assistants speed up boilerplate and well-scoped tasks. On complex or unfamiliar problems, the time spent checking a suggestion can offset the time it saves. Measuring output against real capacity is how a team sees whether a tool is helping.
Fewer than most vendors suggest. Start with one and add tools to overcome bottlenecks that appear. A team that ships slowly because the review phase is slow should add a review tool first, ahead of another assistant. Find the single largest source of friction, fix it with one tool, then reassess before adding the next.
A capacity-measurement tool produces the numbers, but the numbers hold up only when the capacity data feeding them is accurate. A platform that reads sprint data and logged hours from where the work happens can show real output. That output makes sense only against the capacity a team had. One that reports activity without that context flatters a busy team and penalizes a lean one.
Compare the 7 best software development analytics tools of 2026 across delivery, developer experience, and R&D capitalization.

Learn how to measure developer productivity beyond story points and velocity, with effort data and AI-contribution tracking for engineering leaders.

Software engineering intelligence platforms read time logs, Jira, and Git as one dataset. See what they measure and where AI spend fits in.

Six getdx alternatives compared. See what each measures, where each falls short, and which fits developer experience, DORA, or cost attribution.

SDLC best practices for every phase, and how AI in SDLC workflows changes them. Learn to record AI effort in Jira.

Scenario planning software spans three categories. Compare the best tools for portfolio and delivery planning against real team capacity.

Learn the fundamentals and the importance of continuous integration and delivery (CI/CD), a mainstay of the DevOps development pipeline.

Four trends from Tempo's leadership on what 2026 has in store for the workplace, as well as where we we’ll be in 12 months.

Explore Scrum ceremonies and their purpose. Learn how to run them to keep agile teams aligned, productive, and delivering real results.





















