5 reporting tips for dev teams who want to improve agility
Tempo Team
A lot of software development teams have a tendency to keep their heads down, focusing on minutiae and execution, hardly ever looking at strategy and results. Sure, continuous delivery is one of the core principles of the Agile Manifesto. But so is continuous improvement:
At regular intervals, the team reflects on how to become more effective, then tunes and adjusts its behavior accordingly.
Reflecting on how to become more effective comes through reporting. You need to be concerned not just with what you’re doing but how you’re doing, and build in a continuous improvement mindset that involves consistently validating your way of working against the 12 agile principles.
Many of the Jira teams we encounter aren’t doing nearly enough reporting because their continuous delivery mindset has taken over, and they’ve forgotten the importance of regularly evaluating themselves and their practices.
So here are 5 tips to help teams reorient and build in a continuous improvement mindset.
1. Report regularly and consistently
If you’re using Scrum or another agile methodology that involves sprints, you want to be reporting before, during, and after each sprint. If you’re using Kanban, you can be reporting at any time, and as often as you need to, to ensure that work is being delivered on schedule.
In general, though, every team and organization are different and the level of reporting is often dictated by the stakeholders you’re having to report to, as well as the reports you’re having to prepare. For example, Jira Burndown Charts require multiple daily inputs whereas a Jira Velocity Chart is only reviewed once per sprint. The types of reports you’re preparing can help set your reporting schedule.
What’s important is that once you’ve established the frequency level of your reporting, stick to it. Irregular report timing can cause teams to continue making the same mistakes.
2. Understand why you’re reporting
Reporting in Jira stops being useful as soon as you forget what it’s for. If you’re reporting just for the sake of documentation or formality, then you won’t be able to pinpoint any actionable outcomes.
The overarching purpose of all reporting is to help teams improve the speed and quality of their delivery. If there are scope changes, bottlenecks, or disproportionate workloads, reports help you identify and manage them, whether by reallocating resources, retraining team members, or changing the delivery timeline. Reports also help team leaders and Scrum Masters communicate progress and results to other teams and higher-level managers.
3. Understand what you’re reporting
Singling out report-worthy data can be tricky, particularly when it seems like all data must be important.
The thing is, in this age of information, businesses churn out dizzying volumes of data – more than any human could know what to do with. To avoid getting lost, focus on agile metrics and build your reports around those. Agile metrics enable teams to monitor their progress, pinpoint impediments, and reflect on performance.
Here are some reports that Jira teams can use to measure the most relevant and commonly used agile metrics:
Jira Cumulative Flow Diagrams to identify your bottlenecks
Jira Sprint Reports to track scope creep and team velocity
Jira Version Reports to track release progress
Jira Workload Reports to make sure your team members aren’t overwhelmed
Jira dashboards to look at the bigger picture, more than just your team/product
You might also want to have a look at Atlassian’s most commonly used agile metrics, too. (Although we would recommend you ignore the section about Control Charts; we’re not fans.)
4. Refine your questions if you need to
If your delivery and/or quality are inconsistent, you’re taking too long to deliver value, or your backlog is growing faster than you’re burning it down, then it means you’re not doing enough reporting. And if you are doing a lot of reporting, it means you’re not doing it in the best way.
The true value of any report lies in the questions you’re asking it. So if your reports aren’t working, perhaps you need to refine your questions. Skip back to tip 3 and check what it is you’re measuring, or maybe back to tip 2 to ask why you’re measuring it.
In our article about the basics of Jira reporting, we listed the most likely questions that most teams will be asking, grouped under relevant headings. For clarity let’s repeat them here:
Productivity
How much work is being completed per sprint? How much of our planned work was completed?
Predictability
What’s our variability/consistency? How well can we plan?
Schedule
Are we on track to complete our sprint goal? Are we delivering what and when we say we will?
Scope
Is our backlog growing or are we burning it down?
Quality
Are we addressing enough bugs versus stories in each sprint?
Flow
How long does it take us to deliver value? Where are our bottlenecks? How well are we managing our work-in-progress?
5. Visualize, visualize, visualize
Once you’ve decided what reports you’re building, you need to consider how you want the data to be displayed. This is key. A report is basically useless if the data presented isn’t clear, engaging, or memorable. Think about how you’re visualizing the data, i.e. what chart or graph you’re using, how it looks, and whether it communicates the message of the report in an easily digestible way. Visualization creates transparency. It also lowers the barrier for others to join in discussions.
Unfortunately, the out-of-the-box reports that come with Jira aren’t the most visually appealing, and their lack of customization doesn’t let you make them more so. Sure, they’re easy to build, but they might not be the right chart for your purposes, or be the right colors, or show the right amount of data.
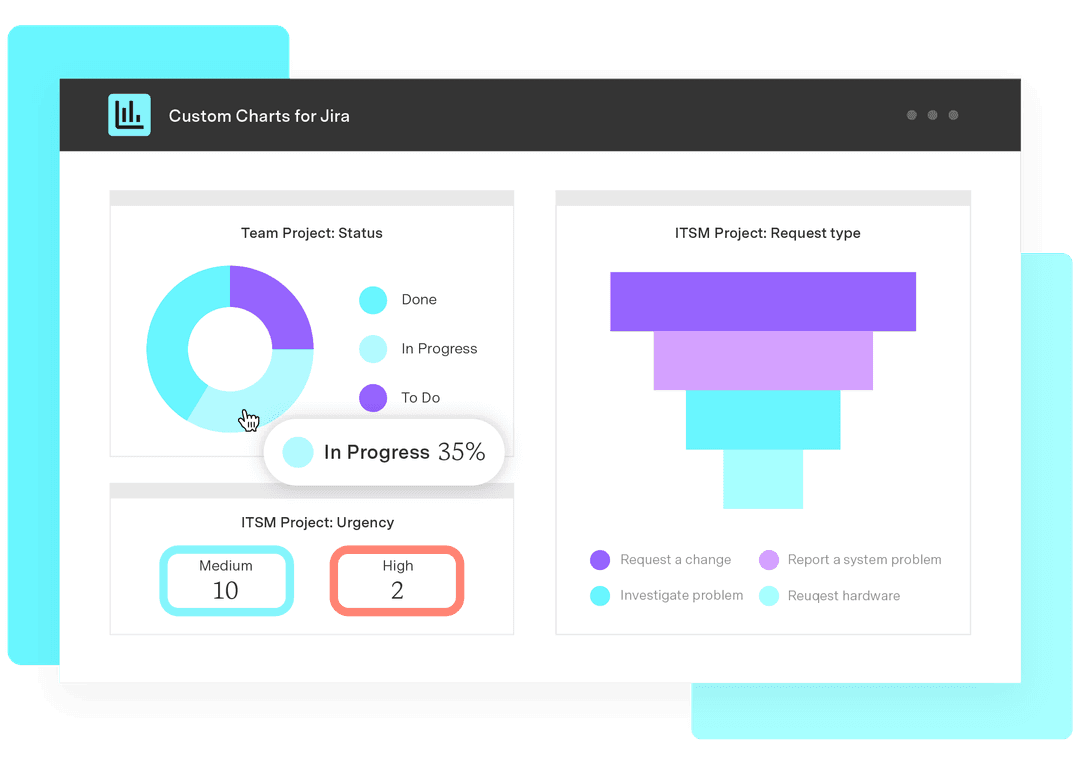
It means you should invest in some better tools. Tools that give you more control over the way your data is presented. Custom Charts for Jira is one such tool – an Atlassian add-on that allows you to replace a number of the native reports in Jira with more visual and customizable ones.
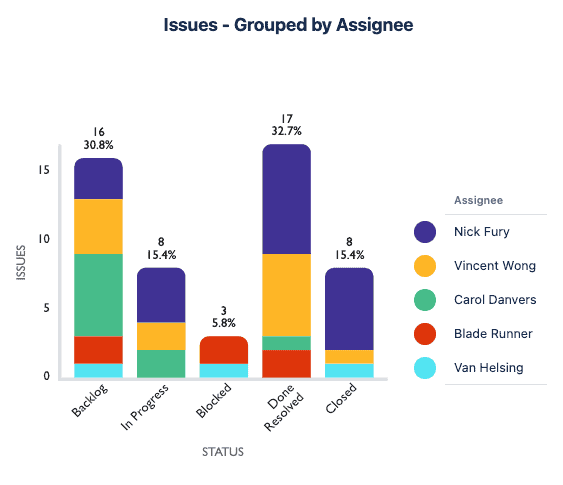
For example, your only visualization option for workload reporting in native Jira is a pie chart. But pie charts aren’t the clearest, particularly if there are only small differences in workload between the assignees. In Custom Charts for Jira, you could visualize the workload as a bar chart instead, and adapt it to display custom names, percentages, different colors etc. Also, while a pie chart will show how much work an assignee has, what you may want to show is how many tickets they have in a specific status. In this case, a 2D stacked/grouped bar chart might be more appropriate. There’s no way of creating a stacked bar chart in native Jira, but in Custom Charts, there is.

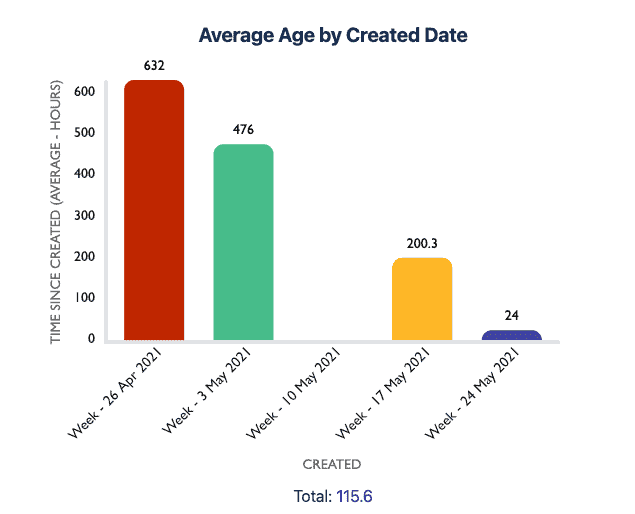
Many Jira teams also want to track the average age of unresolved issues in order to see how well they are moving through their backlog. However, the built-in average age bar chart is limited. Custom Charts’ calculate functionality allows users to build the same chart, but a much more visually appealing, colorful, and dynamic Custom Charts version.

For more information about the importance of visualization in Jira, check out this article.
Conclusion
Dev teams that are always concerned with what they’re doing and never how they’re doing may miss opportunities for improvement that are fundamental to being agile. If you move through the tips above and take full advantage of the reporting functionality in Jira, and through apps on the Atlassian Marketplace that strengthen your Jira reporting capabilities, you’ll be able to extract significant business value from the work that you do. So before you embark on another reporting cycle, work through these five tips and make sure that your reports are as meaningful and purposeful as they should be.
Remember, the need for good reporting is spelled out in the Agile Manifesto. And they say that what gets measured gets managed, so if you want to be a team that delivers, you have to measure what and how you’re delivering. At the end of the day, doing the work only matters if you’re doing it right.
Sign up for a demo
Register


