

Engineering intelligence platforms measure delivery, but 2026 buyers also weigh AI-effort attribution. Compare the tools and how to choose one.
A comparison based on key metrics, from delivery speed to R&D capitalization

Key Takeaways
Every platform in this guide pulls from the same raw material: Issue tracker, version control, and CI/CD data. What separates them is how they process the information, and few excel in more than one area.
Best for capitalization built on a time record: Tempo Workforce Intelligence. Hours are logged against Jira work items, so every capitalized line traces back to an entry.
Start with the question you need answered, not with a feature list.
Engineering leaders start looking at software development analytics when a spreadsheet no longer answers board-level questions: "How fast are we shipping?" "Where did the time go?" "What did last quarter's engineering investment return?"
The problem is they don’t know which one to choose. One development analytics platform shows a CFO where R&D spend went. Another shortens the time a pull request waits for review. Buying the wrong one is an expensive mistake because the data models differ and are hard to retrofit.
This guide will help you make the right choice by comparing the leading platforms based on the metrics you need to present to the board. If you already know which category of development analytics tool you need, skip ahead to the tool comparison.
Software development analytics tools collect data from the systems engineering teams already use: the issue tracker, version control, and CI/CD (continuous integration and continuous delivery) pipelines. They turn that activity into metrics leaders can act on, reading what already happened in the tools of record rather than asking engineers to report status manually.
The output ranges from delivery metrics, like cycle time and deployment frequency, to investment views that map engineering effort to initiatives and cost.
Benefits of software development analytics tools
Development analytics tools give leadership defensible metrics, making the following areas a lot easier:
Decisions backed by data rather than anecdotes: You can point to where delivery slows, which initiatives consumed the most effort, and whether a change helped.
Upward communication: These tools translate engineering activity into language finance and the board can use. That's what turns an engineering org from a cost center into a measurable investment in the eyes of the people funding it.
Earlier course correction: When the data continuously reconciles against reality, you can spot drift while there's still room to act, rather than at the quarter-end review.
Defensible capitalization: Finance gets engineering cost mapped to initiatives and classified as CapEx or OpEx, instead of reconstructing it from memory at quarter-end.
The benefits you get depend on the platform you choose. Before making a selection, review the features and tools below and shortlist those that are the best fit for your team.
No platform offers every capability, and the mix you need depends on whether your biggest pain point is delivery or the books. Review these five features before you shortlist anything:
Breadth of integration: The platform should integrate with your issue tracker, version control, and CI/CD without heavy custom work. Missing coverage biases every metric built on top of it.
Support for industry standard metrics: Support for DORA (DevOps Research and Assessment) and SPACE (satisfaction and wellbeing, performance, activity, communication and collaboration, and efficiency and flow) means the platform measures delivery and experience based on industry standards. .
Capacity awareness: A delivery number means little without capacity data. The strongest platforms weigh output against the remaining available hours after incidents and unplanned work. Investment and cost mapping: For finance-facing teams, the platform should map effort to initiatives and produce R&D capitalization reporting that finance can use without rework.
One place for data: A platform that reports inside the system your teams already work in removes a sync layer that leaks lag and error every cycle.
The first three features decide whether the metrics are trustworthy. The last two decide whether finance can use them, and that's where the category thins out.
The list is grouped by the three questions the category answers, and it leads with investment and capitalization because that requirement rules out more platforms than the other two. Capabilities and pricing move quickly here, so double-check each vendor's documentation before an evaluation.
Tempo offers a suite of Jira-native Atlassian Marketplace apps covering time tracking, capacity planning, portfolio management, and financial reporting. It fits when your work already lives in Jira, and your question spans delivery, capacity, and capitalization at once. The product that sets it apart from the rest of this list is Tempo Workforce Intelligence.
Workforce Intelligence captures blended effort, meaning logged human hours and AI activity recorded against the same Jira work item. This lets you see activity from tools like Cursor and Copilot alongside human hours on the same ticket. AI cost is then attributed to specific work items rather than individuals. That is the form finance needs to classify spend as CapEx or OpEx. The other platforms here report AI adoption and impact at the developer and team level. That answers how widely the tools are used, not which initiatives the spend supported.
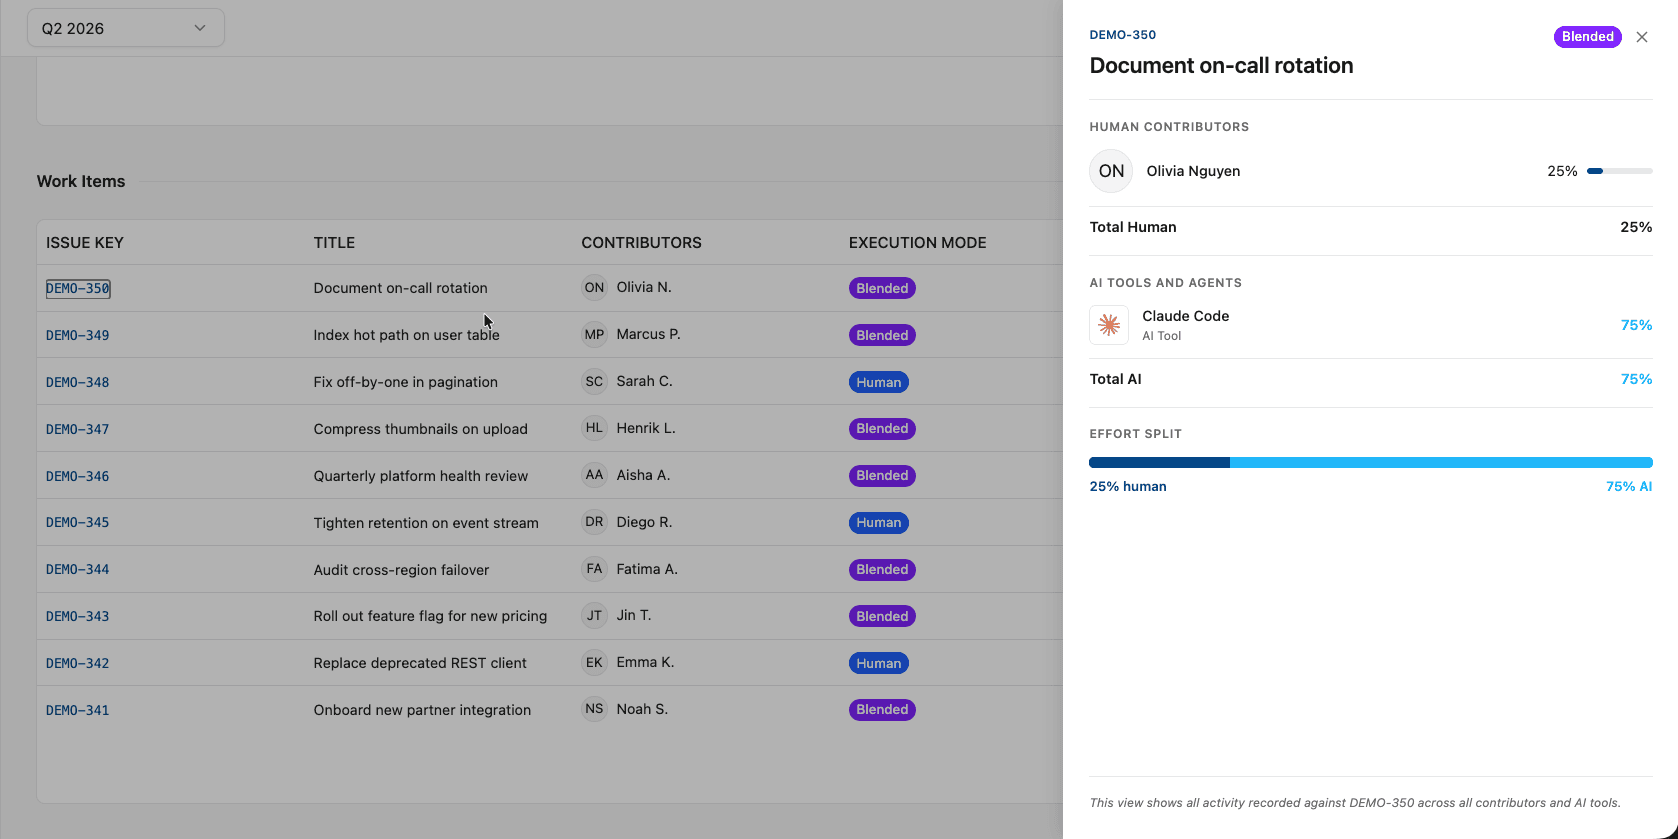
That work-item basis is also what makes Tempo's capitalization number different. It rests on a time record rather than an allocation model. Tempo Timesheets records hours logged against individual Jira work items, with suggestions drawn from calendar and development tool activity. Engineers confirm a suggestion rather than reconstructing a week. Tickets are categorized by CapEx and OpEx, so every capitalized line traces to a specific entry, with its hours, classification, and period.
Two more products round out the suite. Tempo Capacity Planner converts sprint data and story points into time-based capacity through a two-way Jira sync. It reconciles against logged actuals, so plan-versus-actual variance surfaces during the quarter. Tempo Structure PPM builds the portfolio hierarchy inside Jira, so leaders see where work stands today rather than at the last export.
Matthieu Beaufils, Corporate Application Manager at Rexel, describes the value of a live model. "With Structure, we have a cockpit for managing work."
Best for: Jira-native engineering organizations that need delivery, capacity, and capitalization in one place, and that want AI spend tied to the initiatives it supported.
Not for you if: you need DORA metrics and repository-level developer analytics out of the box, or engineer time entry is a rollout risk you'd rather not take.
Jellyfish maps engineering activity to business investment categories: new features, maintenance, and tech debt. It turns that into reporting a CFO or board can read, and its DevFinOps module automates software capitalization reporting from a patented Allocations model.
The main difference between Jellyfish and Tempo is their approach to capitalization. Jellyfish estimates engineering time distribution across initiatives using existing activity data.. In contrast, Tempo records hours in real-time.
Both produce audit-ready output. The one you need depends on what your auditor accepts. Ask your finance team what they'd hand an auditor questioning a single capitalized line item.
Setup is the common trade-off. HR data imports, initiative mapping, and ongoing maintenance make onboarding a multi-week commitment.
Best for: VPs of Engineering who present R&D spend and capitalization data to a CFO or board on a recurring basis.
Not for you if: your finance team requires a time entry against a named ticket, or you want a short onboarding.
Waydev has the broadest range of features in the category, covering DORA and SPACE frameworks, more than 130 metrics, and a cost capitalization module with configurable rules. Its AI reporting is the most developed of the platforms here, with separate modules for AI adoption, AI impact, and AI ROI.
Breadth is also a trade-off for some. A platform with that many metrics needs someone to decide which ones the organization will manage, and teams without that clarity use a fraction of what they paid for.
Best for: organizations with a mixed toolchain that want one platform reading all of it, and teams that know which metrics they intend to manage.
Not for you if: you want a focused metric set or AI reporting at the work-item level rather than at the individual and team level.
LinearB pairs DORA metrics with workflow automation, distinguishing itself from traditional dashboards. Its gitStream feature applies policy-as-code rules for pull request routing, reviewer assignment, and merge conditions, and its bot provides notifications in Slack and Microsoft Teams.
Several factors should be considered during an evaluation. Features like gitStream automations, project management integrations, and Slack and Teams delivery are all exclusive to the Enterprise tier. The Essentials tier covers GitHub Cloud only. R&D cost capitalization is Enterprise-only too, so a team buying LinearB for finance reporting must opt for the higher tier.
Best for: delivery-focused teams that need a tool to actively resolve bottlenecks rather than simply monitor them.
Not for you if: you don’t meet minimum seat requirements, or those whose primary objective is cost capitalization.
Faros AI is an enterprise-scale engineering intelligence platform built for organizations with hundreds or thousands of engineers. It covers DORA metrics, cycle time and throughput, analysis of human versus AI-generated code, and token intelligence that traces AI spend to outcomes. Gartner lists it in the developer productivity insight platforms market.
It also produces finance-ready R&D reports, so it branches out into capitalization. What separates it from Jellyfish is scale and customization rather than basis. Both model effort from activity, and Faros AI leans harder on custom metrics, custom dashboards, and unified catalogs for teams and services.
Best for: large enterprises measuring AI adoption and impact alongside delivery, across a wide toolchain.
Not for you if: you're a mid-market team, or you want upfront before a sales conversation.
Haystack is a delivery analytics platform that reports solely at the team level, avoiding individual scorecards and leaderboards. Engineers see the same dashboards leadership sees. The design is a strategic choice intended to mitigate concerns about surveillance that often cause engineering teams to reject such tools.
It covers cycle time, DORA metrics, and delivery bottlenecks, with GitHub, GitLab, and Bitbucket integration. Haystack also states that it doesn't store, read, or access source code, which tends to shorten the security review.
Best for: teams where engineering trust is the binding constraint and leadership wants delivery visibility without an adoption fight.
Not for you if: you need capitalization or financial reporting, or you need individual-level data.
Swarmia combines engineering metrics with investment tracking and developer experience analysis. It focuses on transparency by surfacing data to both teams and management. Working agreements let teams set and track their own targets, which is what makes it land with engineers.
That same position keeps it deliberately light on resource allocation and compliance-ready output. Its capitalization support is allocation-based, like Jellyfish, so it doesn't resolve a time-record requirement. The integration surface is also narrower than the rest of the category, centered on GitHub and Jira or Linear. Teams running a wider tool estate should ask about coverage early.
Best for: GitHub and Jira teams that want developer-first metrics and buy-in from the people being measured.
Not for you if: you run a wide tool estate, or executive financial reporting is the priority.
Tool | Answers best | Capitalization basis | Where data lives |
Tempo | Delivery, capacity, and capitalization | Time record, in Jira | Jira issue and time data |
Jellyfish | R&D investment and capitalization | Allocation model (DevFinOps) | Jira, HR, and finance systems |
Waydev | Breadth of metrics and AI ROI | Allocation model, configurable | Git, CI/CD, and ticketing |
LinearB | Delivery speed and pull request workflow | Allocation model, Enterprise tier | Git and CI/CD data |
Faros AI | Enterprise AI impact and delivery | Allocation model, finance-ready reports | Wide toolchain, any source |
Haystack | Team-level delivery without surveillance | Not offered | Git data |
Swarmia | Developer-first team metrics | Allocation model, light by design | Git and issue-tracker data |
Confirm current capabilities and pricing against each vendor's documentation before an evaluation. This category ships frequently, and the comparison above reflects what each vendor published as of August 2026.
Start with the requirement that's hardest to satisfy, and work outward from there.
Finance needs a time record: Only a time-logging tool produces one, which points to Tempo. An allocation model produces a different artifact, however defensible it is on its own terms.
Finance accepts an allocation: Jellyfish, Waydev, Faros AI, and LinearB Enterprise all produce one. Choose on integration coverage, scale, and how much platform you want to own.
Delivery speed is the priority: LinearB leads for teams that want automation alongside measurement. Haystack fits when the metric set should stay small and team-level.
Engineers have rejected a tool before: Haystack removes the objection by design. Tempo's time entry is the opposite trade-off, and it's worth being honest about internally before committing.
The board wants to know the return on AI investment: Waydev and Faros AI report AI adoption and impact at the developer and team level. Work-item-level attribution, which connects spend to specific initiatives for CapEx and OpEx classification, is where Tempo's AI attribution differs.
Most organizations past a certain size end up weighing two of these against each other, because the jobs are genuinely distinct. Shortlist two, run both against your own Jira instance or project history, and watch each reproduce a result you already know before you trust it with a decision you haven't made yet.
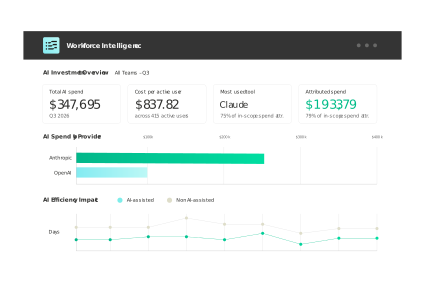
Demonstrating the value of AI has become a priority for many teams. Start capturing human effort and AI activity together in Jira with Tempo Workforce Intelligence, so you can prove the value of your AI investments.
Workforce Intelligence
The only solution that ties AI vendor spend to the teams, epics, and Jira issues it supported.
Start a Free TrialCouldn't find what you need?Go to our documentation
A project management tool helps a team plan and do the work, tracking tasks, sprints, and status. A software development analytics tool reads the data those systems generate and reports what the work is producing, using metrics like cycle time, deployment frequency, and engineering investment by initiative. A project tool is where the work happens. An analytics tool is where leaders interpret it. Many teams run both, with the analytics layer sitting on top of the project tool.
Tempo and Jellyfish are the two most purpose-built for it, and they differ in basis. Tempo uses a time record, capturing logged hours against Jira work items, so a capitalized line traces to an entry. Jellyfish uses an allocation model that estimates how engineering time is divided across initiatives, delivered through its DevFinOps module.
Waydev, Faros AI, and LinearB Enterprise also produce allocation-based capitalization reporting. Both bases produce audit-ready output, so the right choice depends on which one your auditor requires and whether your work already lives in Jira.
Most do. Jellyfish, LinearB, Waydev, Faros AI, Swarmia, and Haystack pull from a range of issue trackers, version control systems, and CI/CD pipelines, so a team on GitHub Issues or Azure DevOps is well covered. Tempo is the exception, built specifically for teams whose work runs through Jira, which is a strength for those teams and a constraint for teams on other stacks.
It varies by data model. Delivery-focused tools that read Git and CI/CD data can surface metrics within days, since the data is already structured. Investment and capitalization platforms take longer, often several weeks, because they need initiative mapping and sometimes HR and finance imports before the reporting means anything. A platform that reads from a system your teams already maintain shortens that runway, since less setup stands between installation and a number you can trust.
Rarely with equal depth. Each group is built around a different data model, and a tool that's strong in one tends to treat the others as secondary. The realistic goal is a platform that covers your primary question well and your secondary question adequately, rather than one that claims all three. Deciding which question is primary, before you evaluate tools, is the step that prevents an expensive mismatch.
Engineering intelligence platforms measure delivery, but 2026 buyers also weigh AI-effort attribution. Compare the tools and how to choose one.

Six getdx alternatives compared. See what each measures, where each falls short, and which fits developer experience, DORA, or cost attribution.

Six Jellyfish alternatives compared: See what each one measures, where it runs, and which requirement it fits.

The best developer productivity tools for 2026, compared by category, from AI coding assistants to real-capacity measurement.

LinearB vs Jellyfish compared. See what each measures, where each falls short, and which fits delivery automation or investment reporting.

Compare Swarmia and Jellyfish on DORA metrics, integrations, AI cost tracking, and capitalization to find the right fit.

Finding the best software for your business is hard work. Read about the different processes to figuring out software requirements for your company.

Timesheets by Tempo's integration with Jira Align, product leaders can effortlessly assess development investments

Streamline your invoice management with Tempo. Learn how to handle invoices, avoid mistakes, and use tools to save time and keep cash flow on track.



















