Tempo logotype
📅 Webinar: Turn your Cloud migration into a catalyst for transformationSave my seat

KPI software to track performance and drive results

Explore the best KPI software for tracking performance and aligning goals. Compare top tools and see how Tempo surfaces real-time KPIs directly in Jira.
From Team '23

Tempo Team

Every team has goals, but even the best strategy can lose momentum without visibility into progress. That’s where KPI software comes in. It gives organizations a clear, real-time view of their performance across projects, departments, and strategic priorities.

In this guide, we define what KPI software is, review some of the top tools available, and explain how Tempo helps teams surface meaningful metrics directly from Jira. Whether you’re focused on project delivery, financial results, or operational performance, using the right platform turns data into thoughtful decisions.

What’s KPI software?

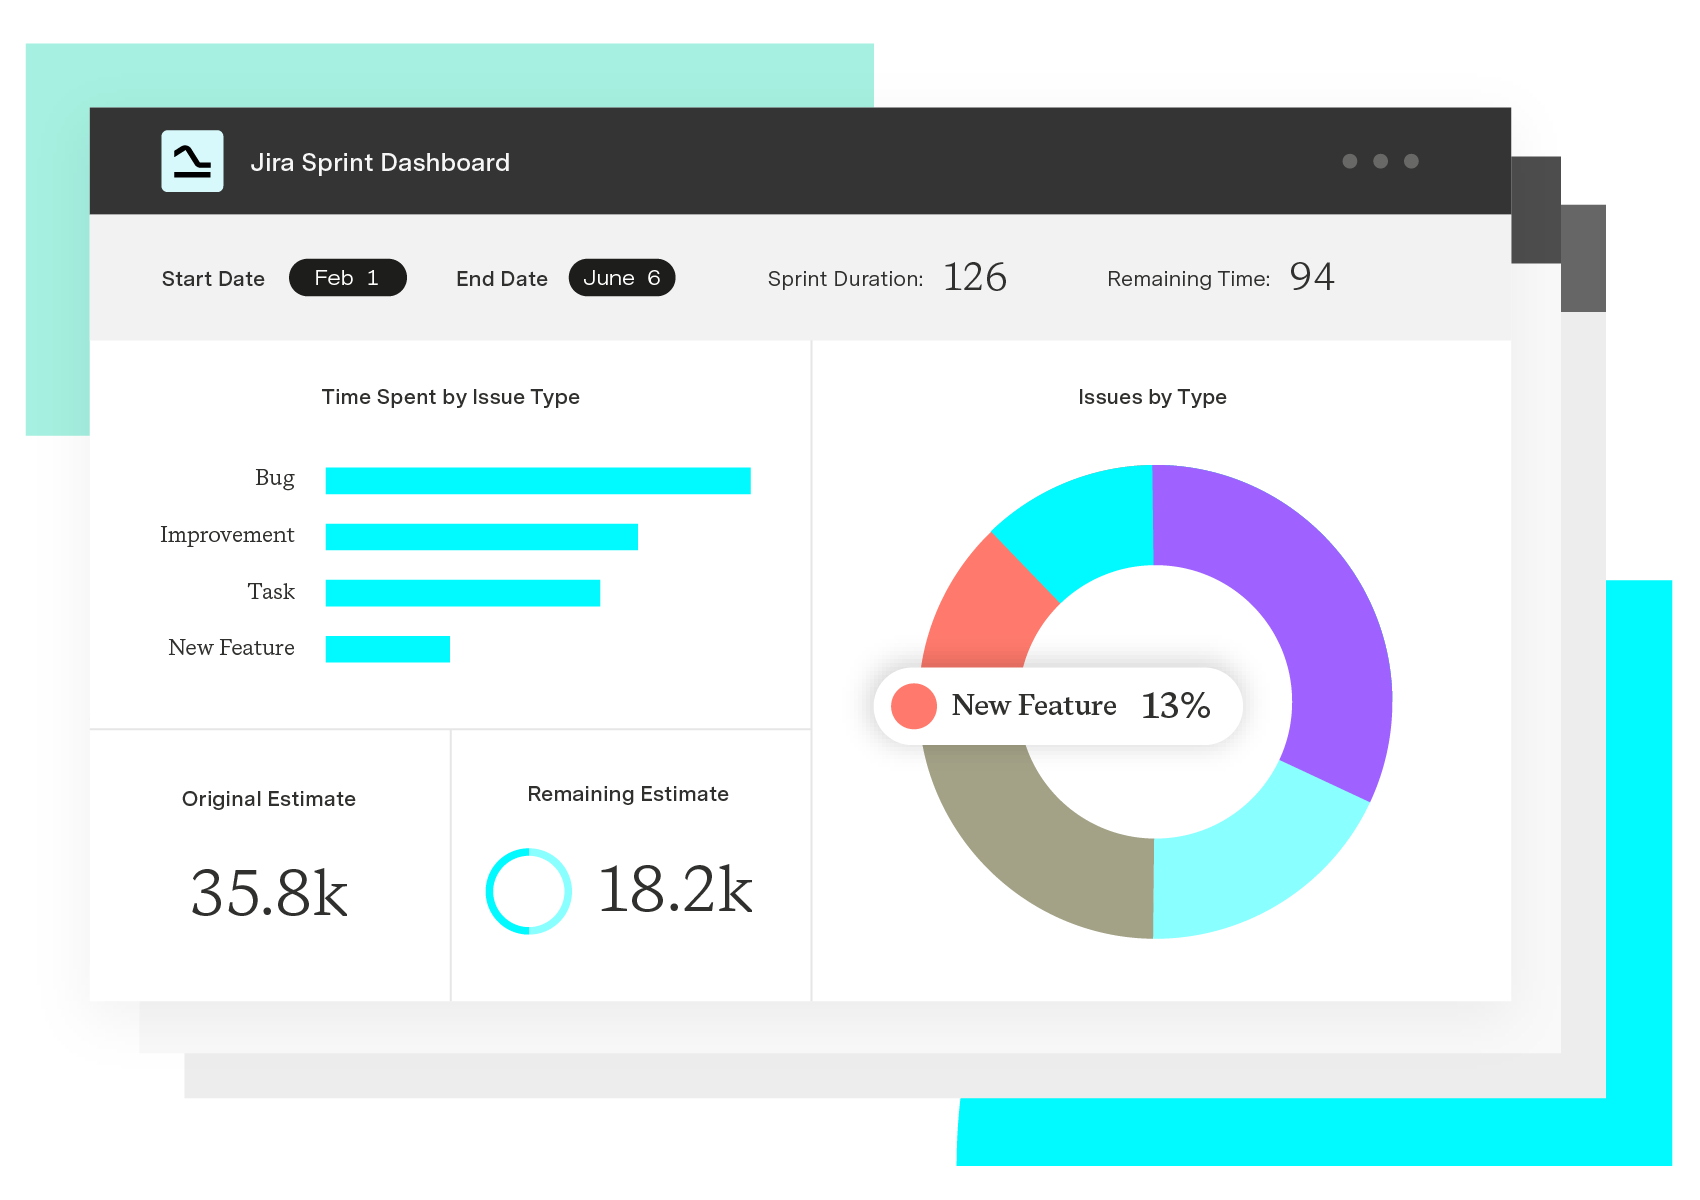
KPI software is a digital solution designed to help businesses track, visualize, and analyze key performance indicators (KPIs) across projects and departments. It centralizes data in an easily digestible format like a dashboard to provide real-time insights into an organization's performance. This enables companies to align their goals, track progress, and improve decision-making.

Some platforms are all-in-one solutions with built-in data connectors. Others, like Tempo, work directly within your tools to surface insights and metrics where the work happens.

10 best KPI software tools

Here are some of the most popular and reliable performance management software options. These tools support everything from data visualization to real-time dashboards and reporting.

1. Tempo dashboards

Tempo dashboards help organizations surface KPI data directly from Jira. This enables businesses to track performance against goals, which helps gain operational alignment and support smarter decision-making. These insights are ideal for Jira users who want to visualize key metrics related to time tracking, resource planning, and project dashboard views.

Best for: Teams that want KPI dashboard software embedded in Jira workflows.

2. Microsoft Power BI

Microsoft Power BI is a business intelligence tool that allows users to create interactive dashboards and reports from various data sources. This tool is highly versatile and suitable for businesses of all sizes that require robust data visualization and analytical capabilities. You can also integrate tools like Power BI dashboard templates for more customized reporting.

Best for: Enterprises with large data sets and complex reporting needs.

3. Tableau

Tableau is a leading analytics platform known for its powerful data visualization features. It enables users to connect to various data sources and create interactive dashboards for in-depth KPI analysis. Tableau is great for organizations that need advanced data exploration paired with storytelling capabilities, or teams that work in more visual mediums.

Best for: Teams that need visual, flexible KPI reporting software.

4. HubSpot

HubSpot's reporting tools include features for tracking marketing, sales, and customer service KPIs. It's an integrated platform ideal for small to mid-sized businesses looking to manage customer relationships and track performance within a unified system.

Best for: Marketing and sales teams who need ready-made dashboards.

5. Plecto

Plecto’s real-time dashboard software helps companies visualize their KPIs from many different data sources. It's known for its engaging and customizable dashboards, which are often used to motivate team members and promote healthy competition through gamification.

Best for: Teams that want instant visibility into progress to improve accountability, all while having a little fun.

6. QuickBooks Advanced

QuickBooks Advanced offers enhanced reporting and analytics features, allowing businesses to track financial and operational KPIs directly within their accounting software. It’s ideal for growing businesses that rely on QuickBooks for their financial management and need deeper insights into their performance.

Best for: Finance teams and business leaders managing budget health and profitability.

7. ClickUp

ClickUp, a comprehensive work management platform, includes features for setting and tracking goals, which can be used for KPI tracking. It allows teams to customize dashboards and visualize progress across projects and tasks. ClickUp is an option for teams that want a simple platform for project management and KPI monitoring.

Best for: Teams that need both project tracking and key performance indicator software in the same workspace.

8. Monday.com

Monday.com is a work operating system that provides customizable dashboards and reporting tools to measure various KPIs. Its visual interface and collaborative features allow teams across different departments who won’t always share a common lingo to communicate easily. Monday.com is great for organizations seeking a flexible, easy-to-learn platform to manage work and track performance.

Best for: Teams that want to tie project updates and status reports directly to measurable outcomes.

9. Lattice

Lattice is for companies that want to integrate their HR processes with KPI monitoring. It’s a people management platform with features for goal setting and performance tracking. It can be leveraged for HR-related KPIs and helps connect individual performance to organizational objectives. 

Best for: Companies focused on employee development, engagement, and performance transparency.

10. Profit.co

Profit.co is an objective and key result (OKR) and KPI management software that provides a comprehensive suite of tools for goal setting, tracking, and performance reviews. It offers robust reporting and analytics on customizable objectives, allowing users to decide what goal is most important, and rank it against others. Profit.co is a strong option for businesses looking for dedicated software to manage both OKRs and KPIs.

Best for: Organizations that want structured alignment and accountability across multiple business units.

Drive KPI visibility and goal tracking with Tempo

KPI tracking is about understanding how daily work contributes to the goals that move your business forward. Tempo dashboards make it easy to visualize your KPIs in Jira, in real-time. Whether you're recording logged hours, scaling practices like agile PI planning, or monitoring project health, dashboards keep everyone aligned and informed. You choose the metrics that matter, and the dashboard updates as the work progresses.

Tempo Timesheets adds a time-based view of performance. Teams can track time by issue, employee, or initiative and compare actuals to estimates. These insights help managers rebalance workloads, manage capacity, and confidently plan projects.

With Tempo’s modular, integrated platform, teams can stay focused on the metrics that matter. 

Tags

  • Custom Charts for Jira

Custom Charts for Jira

A dashboard for every occasion

Build charts and dashboards to evaluate delivery, capacity, and speed for all teams with Jira's most flexible custom reporting app

Start a Free Trial
Special Offer

Frequently Asked Questions

Couldn't find what you need?Go to ourHelp Center

Managing Key Performance Indicators effectively is crucial for aligning your team's efforts with strategic goals. Several tools cater to different needs, from real-time dashboards to comprehensive performance management systems.

Top KPI management tools

Databox excels at real-time KPI tracking with customizable dashboards. It offers over 300 pre-built dashboards, integrations with various data sources, and mobile access. A free plan provides essential features.

SimpleKPI serves small to medium-sized businesses seeking straightforward KPI tracking. Features include customizable dashboards, a KPI generator tool, and industry-specific templates. A free tier is available with premium features at additional cost.

Geckoboard provides teams needing clear, visual KPI dashboards. It offers real-time data updates, 90-plus integrations, and customizable layouts. A free trial is available with paid plans for advanced features.

Cascade focuses on aligning KPIs with strategic goals and objectives. Features include strategy mapping, goal setting, and performance tracking. It offers a free plan with basic functionalities.

Power BI from Microsoft suits organizations already using Microsoft products. It provides advanced data analytics, customizable reports, and integration with Microsoft tools. A free version is available with a Pro version offering additional features.

Tips for effective KPI management

Define clear KPIs that align with your strategic objectives and are measurable. Ensure each KPI directly supports your goals.

Use dashboards for regular monitoring to track performance in real-time and make data-driven decisions. Consistent monitoring keeps you informed.

Review and adjust KPIs periodically to ensure they remain relevant. Adjust as necessary to stay aligned with changing business needs.

Engage stakeholders by sharing KPI insights with your team. This fosters accountability and alignment across the organization.

Choosing the right tool

These tools offer a range of functionalities to suit various organizational needs, from simple tracking to comprehensive performance management.

Your specific requirements will determine which tool works best for your business context. Consider your team size, technical capabilities, and integration needs when selecting a KPI management tool.

KPI dashboard tools provide visual interfaces for monitoring and analyzing Key Performance Indicators in real time.

Leading KPI dashboard tools

- SimpleKPI serves small to medium-sized businesses seeking straightforward KPI tracking. It offers customizable dashboards, a KPI generator tool, and industry-specific templates. The platform provides a free tier with premium features available.

- Tableau suits organizations requiring advanced data visualization and analytics. It delivers interactive dashboards, an extensive visualization library, and robust data analytics capabilities. Various pricing tiers accommodate different feature needs.

- Geckoboard focuses on teams needing clear, visual KPI dashboards. Features include real-time data updates, 90-plus integrations, and customizable layouts. A free trial lets you test the platform before committing to paid plans.

- Databox excels at real-time KPI tracking with customizable dashboards. It provides over 300 pre-built dashboards, integrations with various data sources, and mobile access. A free plan includes essential features.

- Klipfolio delivers real-time data dashboards across multiple devices. It offers customizable dashboards, mobile and TV compatibility, and extensive data source integrations. Pricing tiers vary based on features and user needs.

Selecting the right dashboard tool

For small teams needing straightforward tracking, SimpleKPI provides accessible features without overwhelming complexity.

For organizations requiring sophisticated visualization and analytics, Tableau delivers enterprise-grade capabilities with extensive customization options.

For teams prioritizing visual clarity and quick setup, Geckoboard offers an intuitive interface with strong integration support.

For real-time monitoring across devices with mobile access, Databox or Klipfolio provide flexibility and accessibility.

Consider your team's technical expertise, budget constraints, and integration requirements when choosing a KPI dashboard tool. The right platform aligns with your specific monitoring needs and organizational workflows.

A KPI application is a software tool designed to help organizations define, monitor, and analyze their Key Performance Indicators. These are quantifiable metrics that gauge progress toward strategic objectives.

The applications centralize performance data, enabling teams to make informed decisions and align efforts with business goals.

What KPI applications do

KPI applications consolidate data from various sources into interactive dashboards. They present real-time insights on metrics such as revenue growth, customer satisfaction, or operational efficiency.

These tools are essential for tracking performance, identifying trends, and making data-driven decisions.

How to use KPI applications

Define strategic goals that align with your organization's mission. Set clear objectives first.

Identify relevant KPIs by choosing metrics that directly measure progress toward these goals. The metrics should be quantifiable and actionable.

Integrate data sources by connecting the application to various data streams like CRM, ERP, and marketing platforms. This gathers comprehensive data in one location.

Monitor performance using dashboards to track KPIs in real time. Quick identification of issues or opportunities becomes possible.

Analyze trends using analytical tools within the application to identify patterns and make forecasts. This supports better planning.

Make informed decisions by leveraging insights to adjust strategies, allocate resources effectively, and drive continuous improvement.

Popular KPI applications

- Databox works well for real-time performance tracking. Key features include customizable dashboards and mobile access.

- Tableau excels at advanced data visualization with interactive charts and extensive integration options.

- Geckoboard provides visual KPI reporting through a simple interface with real-time updates.

- Klipfolio offers customizable dashboards with extensive data source integrations.

- Zoho Analytics delivers business intelligence reporting with AI-powered insights and collaboration tools.

Benefits of using a KPI application

- Centralized data aggregates information from multiple sources for a unified view. Everything lives in one place.

- Real-time monitoring enables immediate detection of performance issues. You can respond quickly to changes.

- Data-driven decisions support strategic planning with factual insights rather than assumptions. Better information leads to better outcomes.

- Goal alignment ensures all team members focus on the same objectives. Everyone works toward common goals.

- Continuous improvement facilitates ongoing assessment and refinement of strategies. You can optimize over time.

A KPI application is a vital tool for organizations aiming to track and enhance their performance. By providing real-time insights and analytical capabilities, it empowers teams to make informed decisions and achieve their strategic goals.

KPI software helps organizations monitor performance, visualize trends, and ensure that team activity supports business strategy. It replaces manual reporting with clear, shareable insights.

Most performance management software includes KPI tracking as part of a larger system for reviews, goal setting, and feedback. This creates a clear line between individual contributions and team-level success.

Dashboards are designed for daily monitoring. KPI reporting software offers deeper analysis, historical comparisons, and scheduled reports for leadership and planning.

Tempo integrates directly with Jira to track time, resource usage, and progress. With KPI dashboard software like Tempo Dashboards and Timesheets, you can view and act on KPIs without leaving Jira.

Common KPIs include revenue growth, time to resolution, task completion rates, utilization percentages, and budget variance. The best tools let you define KPIs that reflect your goals and workflows.

Explore More Content

Get the data you need to succeed

Time Tracker

Extend your Jira with prebuilt and highly configurable reports for straightforward time tracking.

Learn more

No-code Tableau Jira integration

Tableau Connector for Jira

Effortlessly bridge Jira with Tableau, unlocking unparalleled insights and enhancing decision-making

Learn more

Time Tracking Software for Jira

Timesheets

Tempo’s intuitive automation and Jira-native design make it the most trusted time tracking tool for enterprise organization.

Learn more

Jira Team & Resource Management

Capacity Planner

#1 Jira Resource Management App: Optimize team allocation, skillset utilization, capacity planning & project management

Go to marketplace

Jira Project Cost Tracking

Financial Manager

Project financial management for Jira & Timesheets. Monitor project costs, expenses, revenue, billing & budgets. Track Capex/Opex

Go to marketplace

Take control of your projects

Portfolio Manager and Jira

Portfolio Manager integrates seamlessly with Jira to give you predictive scheduling, real-time scenario modeling, and advanced resource management – ensuring you stay on track, no matter what challenges arise.

Learn more

Ensure compliance and optimize spending

Governance and auditing

Portfolio governance and auditing excellence

Learn more

No more reporting limitations

Custom Charts for Confluence

Create and share all kinds of highly visual and customizable charts directly on your Confluence pages.

Learn more

Industry-leading project plan and roadmap visualizations with a Gantt chart extension

Gantt Charts for Structure PPM

Visualize project plans and roadmaps with a Gantt chart extension for Jira

Learn more

Agile at Scale Software

Agile at Scale

Adapt to changing business needs, rapidly adjust plans, and reallocate investment.

Learn more

Unified time and team management

Timesheets and Capacity Planner

Seamlessly manage project timelines and resources while accurately tracking time spent on tasks. This integration enhances visibility, improves planning accuracy, and supports data-driven decision-making for better overall project outcomes.

Learn more

No-code BigQuery Jira integration

BigQuery Connector for Jira

Integrate Jira with Google BigQuery to seamlessly export and sync data for advanced analytics and customized reporting

Learn more

Project and program management for Jira

Structure PPM

Visualize all your Jira data & manage portfolios of projects in real-time.

Learn more
Colleagues interacting around a desk

No-Code Power BI Jira Integration

Power BI Connector for Jira

Effortlessly bridge Jira with your preferred BI tool, unlocking unparalleled insights and enhancing decision-making

Learn more

No-code Power BI ServiceNow integration

Power BI Connector for ServiceNow

Seamlessly connect ServiceNow with Power BI, transforming complex enterprise data into actionable insights and driving smarter, data-informed decisions across the organization

Learn more

Centralize real-time plans in one view

Structure and Gantt Charts

Gain a more complete project management solution, simplifying project reporting, improving collaboration, and ensuring projects stay on time and within budget.

Learn more

Powered by Structure’s custom hierarchies, visualize your roadmap, project plans, timeline & dependencies within Jira Gantt charts

Go to marketplace

Unified time and team management

Timesheets and Structure

Combining Tempo Timesheets and Structure PPM provides a unified view of time tracking and project progress, enabling more accurate reporting and effective portfolio management. Simplify workflows, enhance collaboration, and ensure projects stay on time and within budget.

Learn more
Team working together at board with sticky notes

No-code Power BI monday.com integration

Power BI Connector for monday.com

Get powerful data export capabilities and connect monday.com to Power BI effortlessly

Learn more

Strategic Portfolio Management

Strategic Portfolio Management

Modern modular PPM solutions that scale with your business. Align your teams with the integrated platform that bridges the gap between strategy and execution.

Learn more

Align your organization with proactive portfolio management

Portfolio Manager (LiquidPlanner)

Predictive scheduling and the ability to forecast project timelines and spot risks so you can meet deadlines with confidence.

Learn more

Never lose track of a brilliant idea again

Idea Manager for Strategic Roadmaps

Never lose a brilliant idea again. Idea Manager for Strategic Roadmaps has built-in best practices to help.

Learn more

Align strategy and execution

Structure PPM and Strategic Roadmaps

For planning leaders looking to add a big-picture roadmap view to their structured Jira data, this integration is essential. Improve visibility to leadership, reduce reporting admin, and keep your team aligned.

Learn more

Jira Time Tracking

Timesheets by Tempo

#1 Jira Time Tracking & AI Apps: Log Tempo Timesheets for Planning, Project Management & Billing. Plugin Office365, Google & Slack

Go to marketplace

Roadmapping software for teams of all sizes

Strategic Roadmaps (Roadmunk)

The roadmapping tool designed for high-performing teams delivering boardroom-ready strategic roadmaps.

Learn more

Monitor financial health at every level

Financial Manager

Monitor projects and portfolios to get simple, clear, and real-time views of your costs, budgets, and profits that can be shared throughout your entire organization.

Learn more

Strategic portfolio management for PMO leaders

Strategic portfolio management for PMO leaders

Tempo gives PMO directors and portfolio managers the tools to reduce delivery friction, align teams, and drive measurable outcomes.

Learn more

Jira ITSM Solutions with Tempo

ITSM

Build and scale a custom ITSM solution at your own pace with Tempo's modular suite of integrated tools. Enhance Jira's capabilities and take control of your entire IT portfolio.

Learn more

Custom charts and dashboards for Jira

Custom Charts for Jira

See how work is progressing and where blockers are with the most flexible reporting app in Jira.

Learn more

Real-time collaboration and capacity planning in Jira

Capacity Planner

A powerful team resource management tool designed to optimize capacity planning and project management in Jira

Learn more

Jira Portfolio Management PPM

Structure by Tempo

Jira Project Portfolio Management (PPM): Visualize data and manage projects within spreadsheet-like tables — in less than a minute

Go to marketplace