KPI reporting: Measure performance and drive growth
Regular quarterly goals and long-term growth strategies both guide projects, but without the right metrics, it’s hard to know what’s working. Teams can look and feel busy without making meaningful progress unless they’re measuring the outcomes that matter.
Key performance indicator (KPI) reporting helps teams track performance against specific goals to make more informed decisions and stay aligned at every level. Clear, consistent reporting allows you to analyze trends and adjust course before minor issues become major setbacks.
In this guide, we’ll explain what a KPI report is, explore five common KPIs, and share best practices for effective reporting. We’ll also show how Tempo helps teams connect their KPI tracking directly to Jira data for smarter, more actionable insights.
What’s a KPI report?
A KPI report is a document or dashboard that tracks and presents performance against selected key metrics. These indicators are tied to common business objectives – they should be specific, measurable, and achievable to enable teams to realistically track their progress.
KPI reports are mainly used by managers to communicate results across departments and support data-informed decisions. Depending on the audience, a KPI report can be as simple as a spreadsheet or as dynamic as an interactive project dashboard connected to live data sources. If thorough, a KPI report helps translate complex activities into clear signals of success or highlight areas for improvement.
What are the 5 leading performance indicators?
While different teams prioritize different metrics, some KPIs are widely used because they reflect core business health. Below are five examples of commonly used performance indicators across industries.
1. Revenue growth
Revenue growth measures a company's sales increase over a specific timeframe. It’s one of the most direct indicators of business success and is often reviewed by leadership, investors, and sales teams. A positive revenue growth rate signals effective market strategies and customer demand, and can also mean you’re ready to reinvest your profits in the company.
2. Customer acquisition cost (CAC)
CAC measures the cost of acquiring a new customer. It includes spending on sales, marketing, and onboarding activities. Tracking CAC helps businesses evaluate the efficiency of their growth efforts. A rising CAC may indicate the need to optimize marketing campaigns or sales processes.
3. Net promoter score (NPS)
NPS gauges customer satisfaction and loyalty by asking how likely someone is to recommend your product or service. Scores generally range from -100 to 100. A high NPS suggests a strong customer experience, while a low score may highlight service, quality, or usability issues.
4. Employee productivity
This KPI evaluates how effectively individuals or teams complete work within a given period. It may include metrics like output per hour, tasks completed, or time logged. Tracking productivity supports resource planning and helps identify blockers your team may be facing.
5. Project delivery time
Project delivery time measures how long it takes to complete a project from start to finish, and it should be compared against planned timelines to assess schedule accuracy. This KPI is essential for project managers looking to improve efficiency and meet stakeholder expectations.
What are some examples of KPI reports?
KPI reporting varies by department and role. Here are a few KPI report examples illustrating how different teams track performance.
Marketing KPI report
A marketing KPI report may include metrics like website traffic, conversion rates, cost per lead, and campaign ROI. These KPIs help marketers understand which channels drive revenue and where to point their next efforts.
Sales KPI report
Sales teams often track KPIs such as total revenue, lead conversion rates, sales cycle length, and win/loss ratios. A sales KPI report helps managers assess pipeline health and forecast future performance.
Financial KPI report
Finance teams rely on reports that monitor cash flow, profit margins, expense ratios, and budget variance. These financial KPIs guide spending decisions and show if the organization is on track to meet its economic goals.
Project management KPI report
Project managers might track metrics like time spent per task, scope changes, risk exposure, and milestone completion rates. These reports offer real-time visibility into project health and ensure deliverables stay aligned with objectives.
IT operations KPI report
IT teams often monitor KPIs such as system uptime, mean time to resolution, ticket volume, and user satisfaction scores. Many IT teams enhance service visibility by using SLA reporting dashboards built with Custom Charts for Jira. These reports help IT professionals identify recurring issues and support continuous improvement across their infrastructure.
In addition to the above, many teams also rely on a progress report to provide consistent visibility into milestones and outcomes for ongoing project tracking.
KPI reporting best practices
If you’re wondering how to write a KPI report, effective reporting relies on clarity, relevance, and consistency. The following best practices will help your reports drive the right actions:
Define goals first: Start by clarifying what success looks like for your team or project. Choose KPIs that align directly with these outcomes.
Use current data: Real-time or frequently updated data sources increase accuracy and build trust. Stale data can lead to misinformed decisions.
Tailor visuals to the audience: Executives may prefer reports or dashboards with summaries, while analysts may want detailed tables or charts. If your audience includes senior leadership, consider reporting formats similar to CEO-level reports that focus on high-impact KPIs.
Limit the number of KPIs: Too many metrics can dilute focus. Stick to a small set of meaningful indicators tied to clear objectives.
Review regularly: As business goals shift, revisit your KPI selections at regular intervals to make sure they still reflect your priorities.
Provide context: Highlight trends, comparisons, and benchmarks. A number alone only tells part of the story – the right interpretation makes it worthwhile.
Align KPI tracking and reporting with Tempo
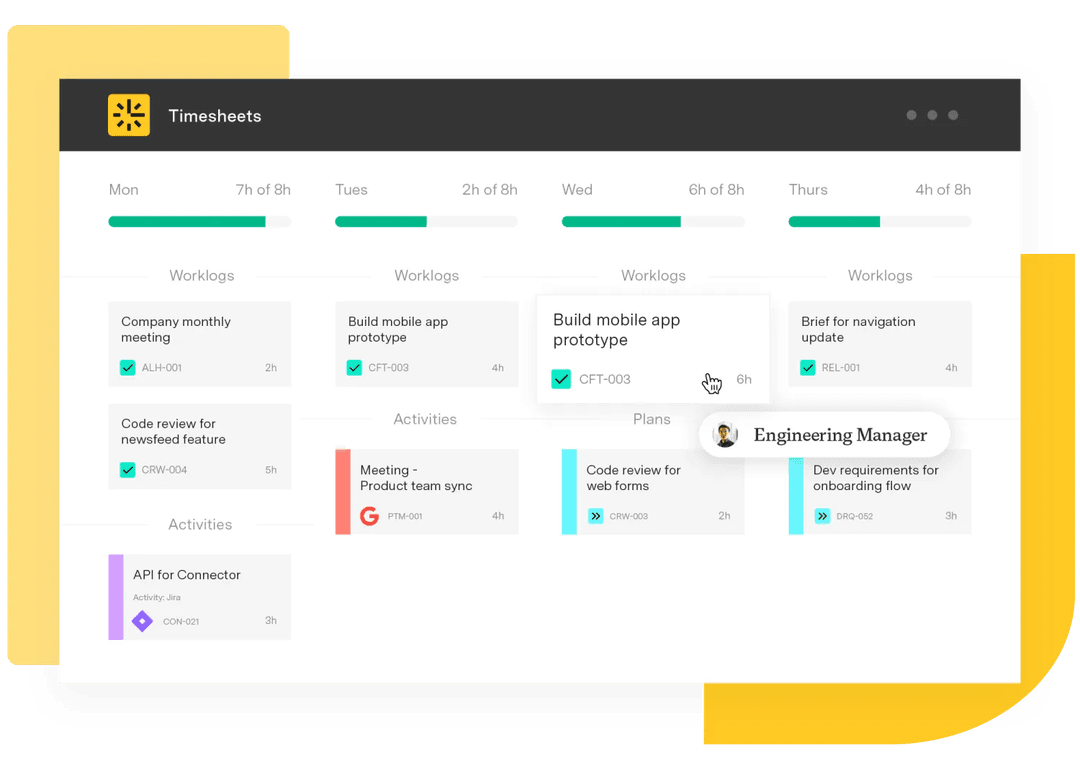
Tempo helps teams connect their KPI reporting directly to real-time Jira data, making performance tracking more accurate, efficient, and actionable. For instance, Timesheets allows teams to log and categorize time spent across projects, giving managers insight into worker productivity. And Financial Manager supports accounting and project leads in tracking costs, managing budgets, and forecasting spending. Its built-in dashboards and reporting capabilities make it easier to monitor financial KPIs and stay on top of resource allocation.
Additional tools like Capacity Planner and Strategic Roadmaps extend Tempo’s reporting capabilities by supporting long-term planning and resource visibility. Together, these solutions reduce manual reporting and keep teams aligned on performance.
For teams using ServiceNow, Tempo offers a top-rated tool called Power BI Connector for ServiceNow – along with guidance on optimizing KPI dashboards with Power BI to support even more customizable reporting.
Using Tempo’s integrated tools, KPI reporting becomes a real-time guide for action, not just a reflection of performance.