

Forecast project costs in Jira with Tempo Financial Manager. Combine actual and planned data to prevent overruns and improve budgeting.
Learn how revenue tracking and projection help your teams monitor project income and forecast financial performance – using Tempo Financial Manager.

Revenue tracking and projection is the practice of monitoring the income a project generates and forecasting how that income will develop over time. For technology-driven work, it isn't a bookkeeping chore — it's how leaders decide where to allocate cost, capacity, and attention.
Two disciplines sit inside the term. Tracking compares actual revenue against actual costs so you can see variance as it happens. Projection estimates future revenue from current status, trend lines, and planned work — harder to do well, and far more valuable when you get it right.
Accurate financial planning: Project managers can allocate resources, manage budgets, model revenue, and choose which projects to take on with real numbers behind the decision.
Project staffing: Prioritize the projects most likely to return investment, so teams and individuals spend their hours where they count.
Risk management: Spot underperforming projects early and take corrective action — or double down where revenue is trending up.
Performance evaluation: See whether technology projects are hitting their financial targets rather than guessing from delivery status.
Strategic decision-making: Give stakeholders the data they need to weigh market expansion, partnerships, or a change in direction.
Stakeholder communication: Set expectations, build trust, and demonstrate the financial health of your initiatives.
Long-term sustainability: Surface revenue growth opportunities and keep revenue streams tuned to a shifting technology market.
Methods vary by how much accuracy you need, what insight you're chasing, and how much time you're willing to invest. Common approaches include:
Historical data analysis: Read revenue from prior projects to find trends, patterns, and year-over-year growth. Forecast quality tracks the quality of the underlying data.
Project milestones and billable hours: Anchor revenue to defined milestones and to hours worked against client rates, adjusting for rate changes.
Analytics and reporting tools: Use BI tools to track KPIs and generate projections, then feed real-time data back into the model to keep it current.
Tempo Financial Manager tracks project and portfolio revenue, and — when paired with Tempo Capacity Planner — projects future revenue against planned capacity.
Financial Manager lets you:
Track a project's cost and revenue side by side
Compare revenue against actual costs
See profitability at the project or business-plan level
The following video walks through tracking a project's revenue in Financial Manager (formerly Cost Tracker).
How to Track a Project's Revenue in Financial Manager
Financial Manager's forecasting features let you:
Calculate projections from logged time and planned time
View actual and projected metrics at a granular level
See how projects are performing and what they are costing
Compare actual KPIs against projected KPIs
Adjust current or future costs to stay inside the allocated budget
The project overview surfaces current and projected KPIs so you can watch progress against plan. The project timeframe spans every worklog and planned task tied to the project.
Ready to change how you track project revenue? Start monitoring financial metrics at every level of your portfolio.
#### Comparing the project scope KPIs
Financial Manager builds a project scope from the hours team members have logged plus their planned time for upcoming tasks. The scope chart splits into two views: current and projected values for labor and revenue.
Changes to the holiday scheme or the workload scheme flow through Capacity Planner, which updates the projected labor and projected revenue for the Cost Tracker projects automatically.
#### Comparing the project team KPIs
Like Timesheets and Capacity Planner, Financial Manager uses the Tempo Team custom field. It draws on the time each team spends to calculate labor costs, then compares actual time — by team and by team member — against the labor costs projected from Capacity Planner data.
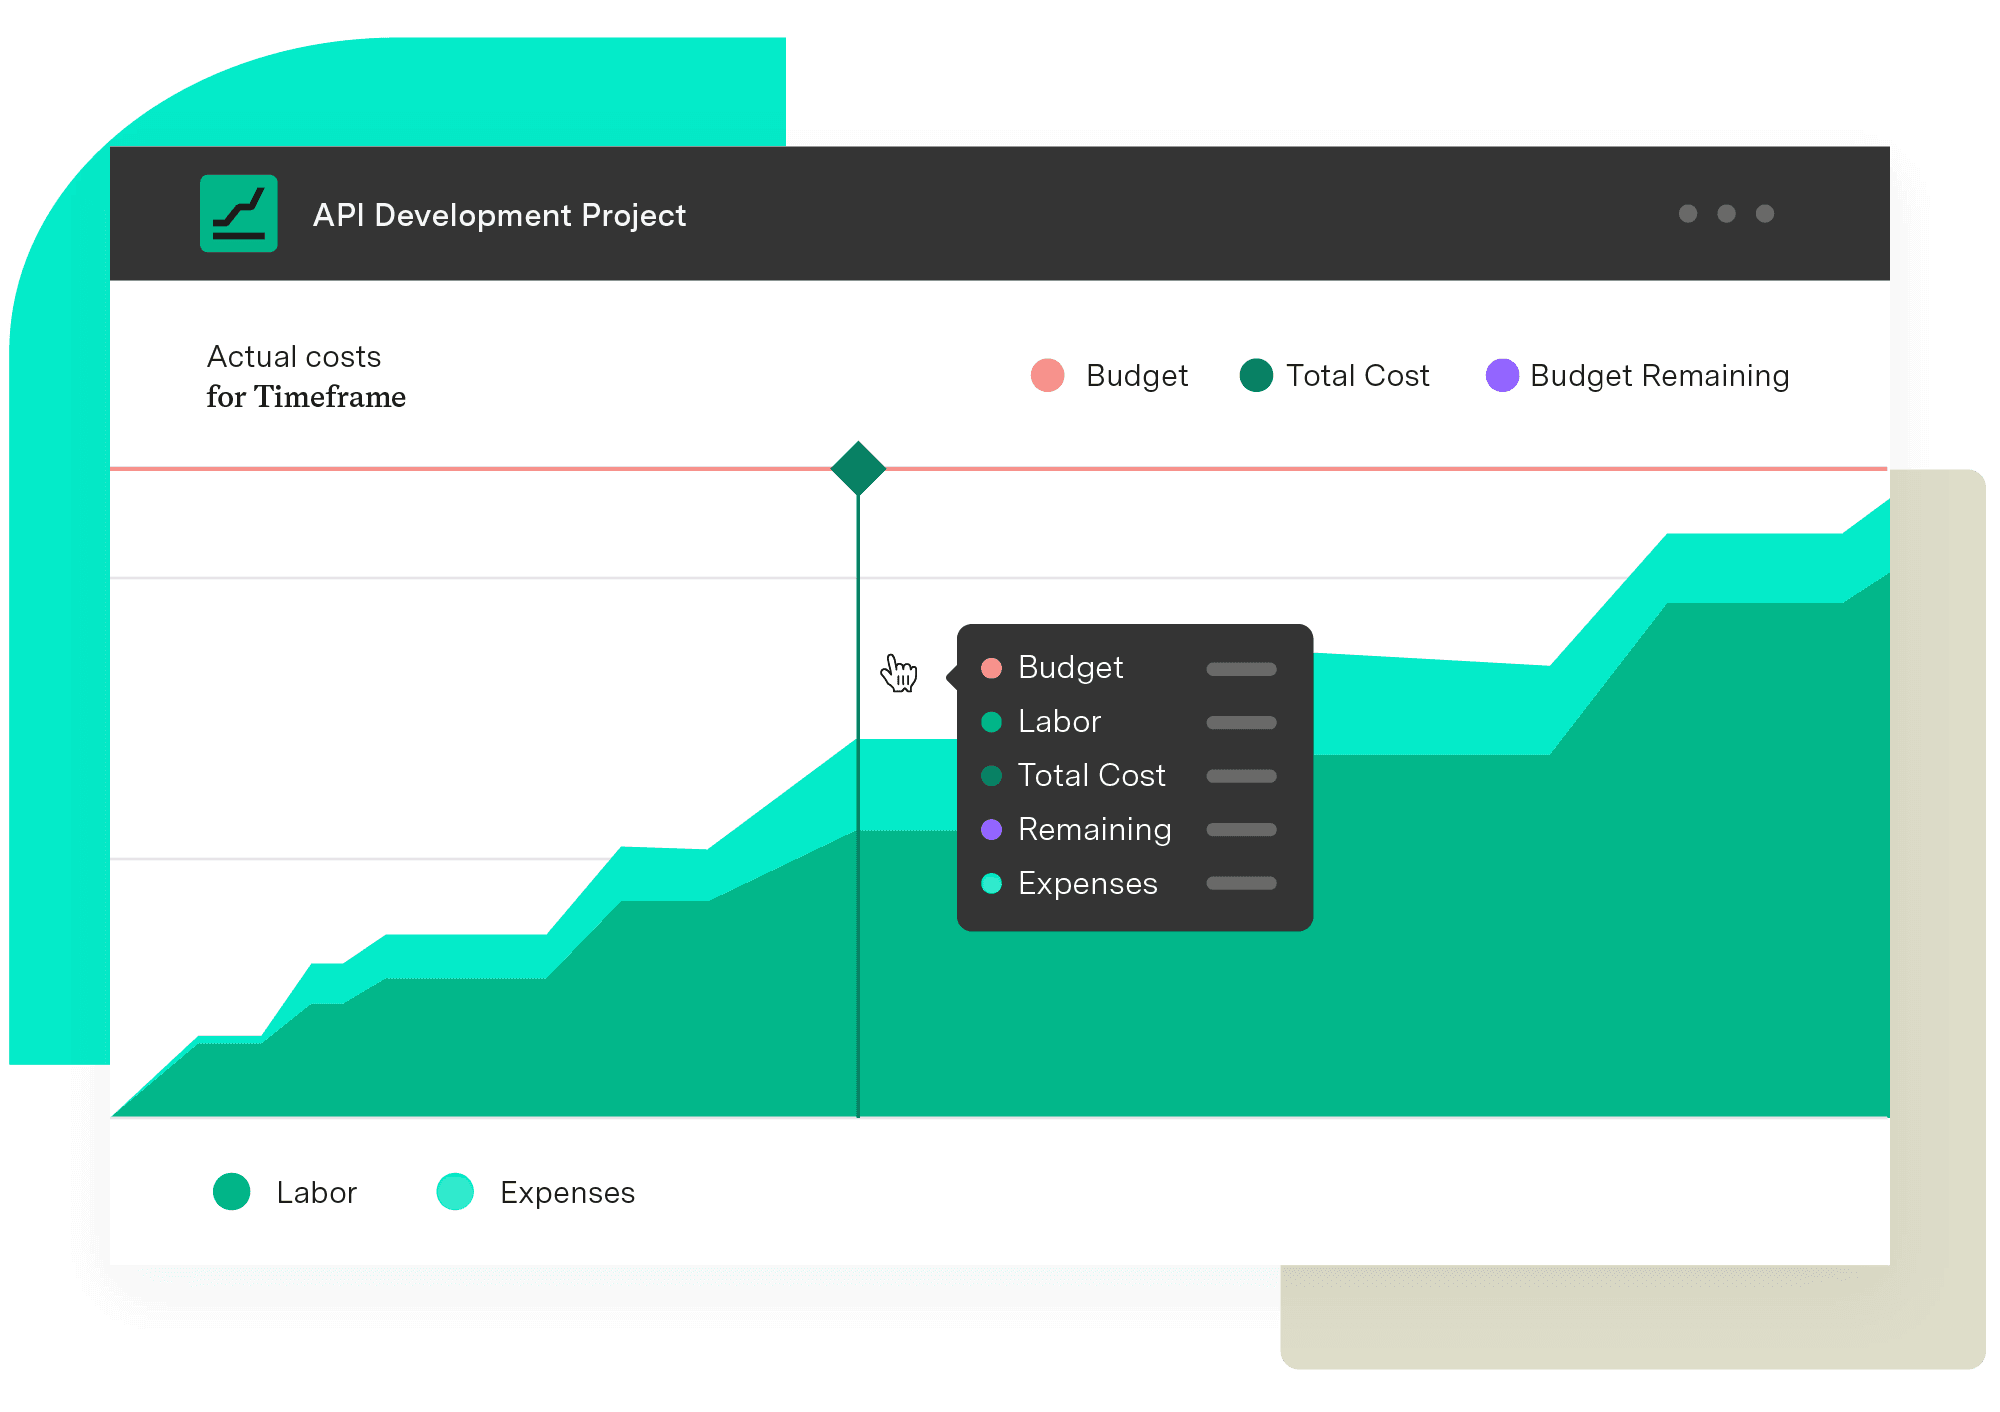
Financial Manager
Implement standardized processes and calculations when creating your budgets and monitoring them. Make informed, real-time decisions with an accurate reflection of the work being done and know when you need to pivot.
Start a Free TrialForecast project costs in Jira with Tempo Financial Manager. Combine actual and planned data to prevent overruns and improve budgeting.

Learn how Financial Manager delivers project revenue reporting for Jira teams — real-time reporting, dashboards, and portfolio rollups in one view.
Learn how project budget tracking contributes to financial success by reigning in spending, controlling costs, and ensuring accurate estimations.

Learn how project management and time-tracking techniques work together to monitor and improve team performance, resource estimate accuracy, and more.

Discover 10 proven strategies to drive profitability. Learn to control costs, mitigate risks, and drive revenue growth for business success.

Learn how Tempo amplifies Jira across capacity planning, time tracking, financial management, and reporting – all in one connected system.

Take control of your business’s future by learning how financial forecasting can positively impact your balance sheet and economic evolution.
Stay on track and hit every deadline with milestone tracking. Learn how to monitor and optimize project milestones for seamless execution with Tempo.

Using Tempo Planner to streamline the management of teams and resources to find available team members and maximize your resource utilization.





















