Use these tips to learn how to discover your greatest personal strengths so you can apply them to various aspects of your job and succeed.
Understand where AI spending goes and what business value it creates.

Key Takeaways
LLM cost tracking helps organizations connect AI spending to the engineering work, features, and outcomes that generated it.
Provider dashboards can report usage and costs, but they rarely explain what business value that spending produced.
Cost attribution links AI spend to teams, products, and Jira work items, creating a clearer foundation for ROI analysis.
Organizations typically progress through four stages of AI cost maturity: visibility, attribution, governance, and optimization.
The most effective AI cost management strategies focus on business outcomes, not just token consumption and model usage.
AI coding assistants, LLM-powered features, agent-based workflows, and enterprise AI copilots are driving a new category of engineering spend. As adoption grows, engineering and finance teams face a common challenge: understanding which AI investments are improving delivery outcomes and which are simply increasing costs.
Most organizations can see their AI invoices and token usage. Far fewer can connect that spend to the engineering work it supported or the outcomes it helped deliver. This guide explains LLM cost tracking, levels of AI cost visibility and how organizations connect AI spend to business outcomes.
LLM cost tracking captures token consumption, compute cost, and model usage at the individual request level, then attributes that spend to the team, feature, or work item that generated it.
Provider dashboards such as OpenAI, Anthropic, and Google AI Studio report account-level totals with a reporting lag. They show what you spent, but not who spent it, which feature generated the cost, or what business outcome the spend supported.
Token tracking measures volume per call. Cost attribution, often referred to as AI attribution, connects that volume to a business dimension such as a team, product area, or Jira issue. Cost observability extends further by connecting infrastructure costs and inference spend to business outcomes.
AI vendor invoices arrive as a single monthly total. GitHub Copilot, OpenAI, and Anthropic each bill at the account level, with no line connecting spend to the Jira work it funded. Every AI-assisted engineering org carries three cost layers, and they live in separate systems:
Layer | What it covers | Where the data lives | Who owns it |
Layer 1: Cloud infrastructure | GPU compute, storage, networking | Cloud provider billing | Platform engineering |
Layer 2: Inference and application | Token costs, retries, agent steps, caching | AI vendor dashboards | ML / product engineering |
Layer 3: Business attribution | Cost per team, feature, strategic objective | Jira, planning tools | Engineering leadership / finance |
The invoice you receive reflects Layer 2 at best. Layers 1 and 3 require instrumentation your vendor doesn't provide, which is why spend totals land in finance without context and why budget reviews require manual reconstruction from disconnected reports.
47% of organizations say they lack full visibility into their AI spend. Engineers run unapproved subscriptions, share API keys, and route requests through tools that never appear in a gateway log. Spend from those tools never reaches any attribution system. Before tagging or routing begins, an inventory of active AI tools across every team is the prerequisite.
Shared API keys and ungoverned model access create spend that no one owns. The inventory step surfaces that spend as a visible line item rather than leaving it outside the allocation view.
Once every active tool appears in the inventory, the implementation levels below apply to the full picture, not just the sanctioned API calls. A team that starts at Level 1 instrumentation without completing this step builds attribution on an incomplete data set from day one.
Most engineering orgs operate at Level 1 or Level 2. Each of the four levels builds on the previous one, so skipping a level means missing the foundation needed for the next.
Level | Name | What you can answer | Key capability required |
1 | Visibility | How much did each call cost? | Gateway/proxy logging per request |
2 | Attribution | Which team or feature generated this cost? | Metadata tagging (team, feature, environment, customer ID) |
3 | Governance | Are teams within budget? | Per-team budget policies, soft and hard limits |
4 | Optimization | Which model delivers the best cost-per-outcome? | Cross-provider comparison, caching, prompt review |
The harder leap is from Level 2 to Level 3: connecting spend to the work it supported. Tempo Workforce Intelligence helps close that distance by linking AI usage and costs to the Jira work items, teams, and initiatives they support. This gives engineering and finance a shared view of where AI investment goes.
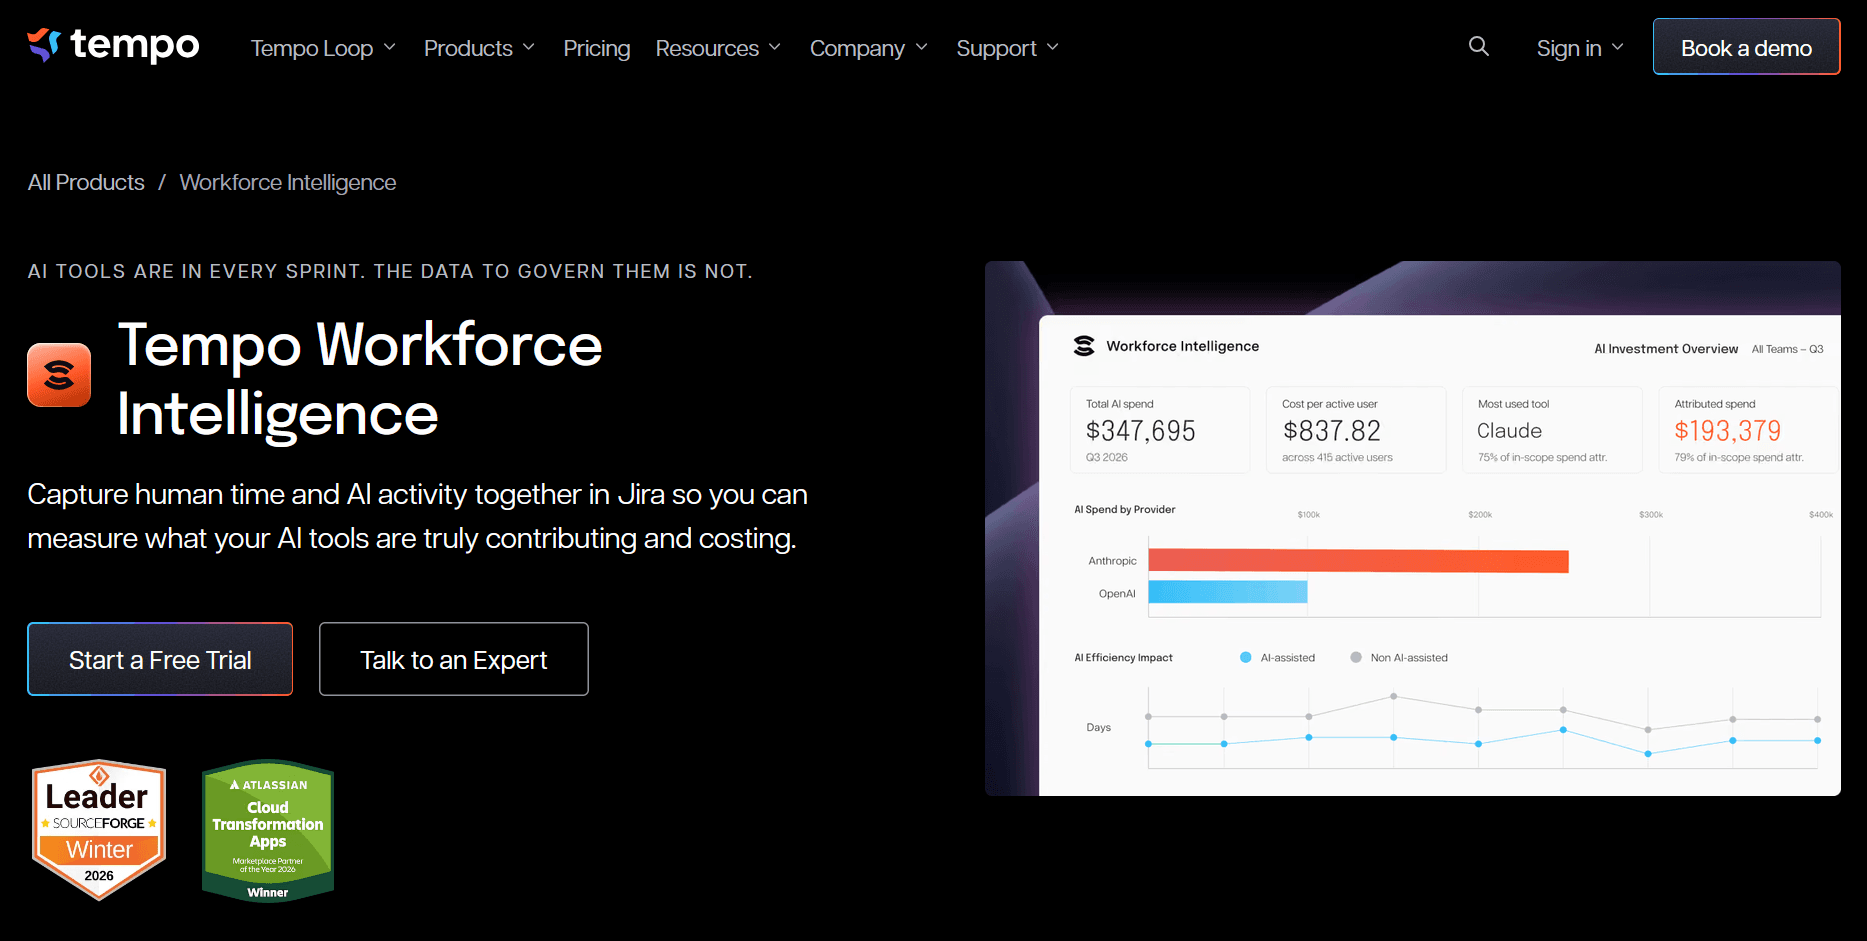
Related recording: Where is your AI spend actually landing? shows how Tempo Workforce Intelligence connects AI spending to Jira work items, epics, and objectives to help teams understand where AI investment is creating value.
Level 1 starts with AI spend management tools or centralized LLM gateway (LiteLLM, Portkey, or Bifrost) that captures tokens, model, latency, and retries per call.
Level 2 adds standardized metadata tags on every request: team_owner, feature_name, environment, customer_id.
Level 3 sets budget policies against those tags and routes alerts before spend exceeds a threshold.
Level 4 runs monthly cross-functional reviews comparing cost-per-outcome across models and uses caching to cut repeated inference costs. Each level produces data the next level consumes.
A team that skips Level 2 tagging can't enforce Level 3 budgets by team, because the spend carries no owner.
Feature-level tagging answers which product area spent this? Initiative-level attribution answers what did that spend deliver.
The difference comes down to the data each requires:
Feature tagging: Identifies which product area consumed tokens through metadata such as feature_name.
Work-item attribution: Connects AI requests to Jira issues, epics, and strategic objectives.
Delivery context: Brings in logged human hours and delivery dates for the same work.
Tempo Workforce Intelligence pulls token and compute costs from provider APIs, including Anthropic, OpenAI, and GitHub Copilot. When AI-generated code lands on a branch with a Jira issue key, Tempo traces the cost to that issue, its epic, and its strategic initiative.
Tempo's internal rollout found that 25% of AI spend was initially untied to a strategic objective. After implementing work-item attribution, 88% resolved to specific work items. Unattributed spend remains visible rather than disappearing into an uncategorized total. This helps address growing pressure to prove AI ROI.
Organizations need work-level evidence to support CapEx classification. Provider dashboard totals alone aren't enough for audit review.
Finance needs to distinguish between:
Without issue-level attribution, finance has to estimate how costs should be classified rather than rely on an auditable record.
Tempo Workforce Intelligence, combined with Timesheets, provides that record at the Jira work-item level:
Tracks AI tools involved and their compute costs.
Shows AI costs alongside human hours logged against the same issue.
Makes classification rules visible in the underlying data.
Maintains attribution continuously, rather than leaving finance to reconstruct it at month-end.
This gives finance issue-level evidence for reporting and audit review.
Teams implementing LLM cost tracking often run into these eight mistakes:
Common mistake | Why it matters |
Tracking token costs only | Misses GPU and infrastructure costs, understating total AI spend. |
Relying on provider billing dashboards | Shows account-level totals without team or feature-level attribution. |
Skipping metadata tagging | Makes budget enforcement difficult because spending has no clear owner. |
Treating cost management as an engineering-only concern | Leaves finance without the issue-level detail needed for capitalization review. |
Ignoring model price differences | Can lead teams to use expensive models for tasks that cheaper models could handle. |
Overlooking unused or idle AI resources | Creates ongoing infrastructure costs without delivering value. |
Failing to account for retries and failed requests | Underestimates spending caused by repeated or unsuccessful inference calls. |
Optimizing for token reduction alone | Can compromise output quality without meaningfully reducing overall costs. |
Where to start: Caching is often the highest-return first step for teams already past Level 2. Repeated inference on identical or near-identical prompts adds cost without additional delivery value. A caching layer at the gateway can reduce that spend before further optimization is needed.
Turning LLM spend into business value requires more than tracking tokens and model usage. The real challenge is understanding how AI costs relate to the work being delivered and the outcomes that matter to the business.
Tempo Workforce Intelligence helps close that distance by connecting AI activity with engineering, project, and workforce data. The result is a clearer view of where AI investment is creating value.
Book a demo to see Tempo in action.
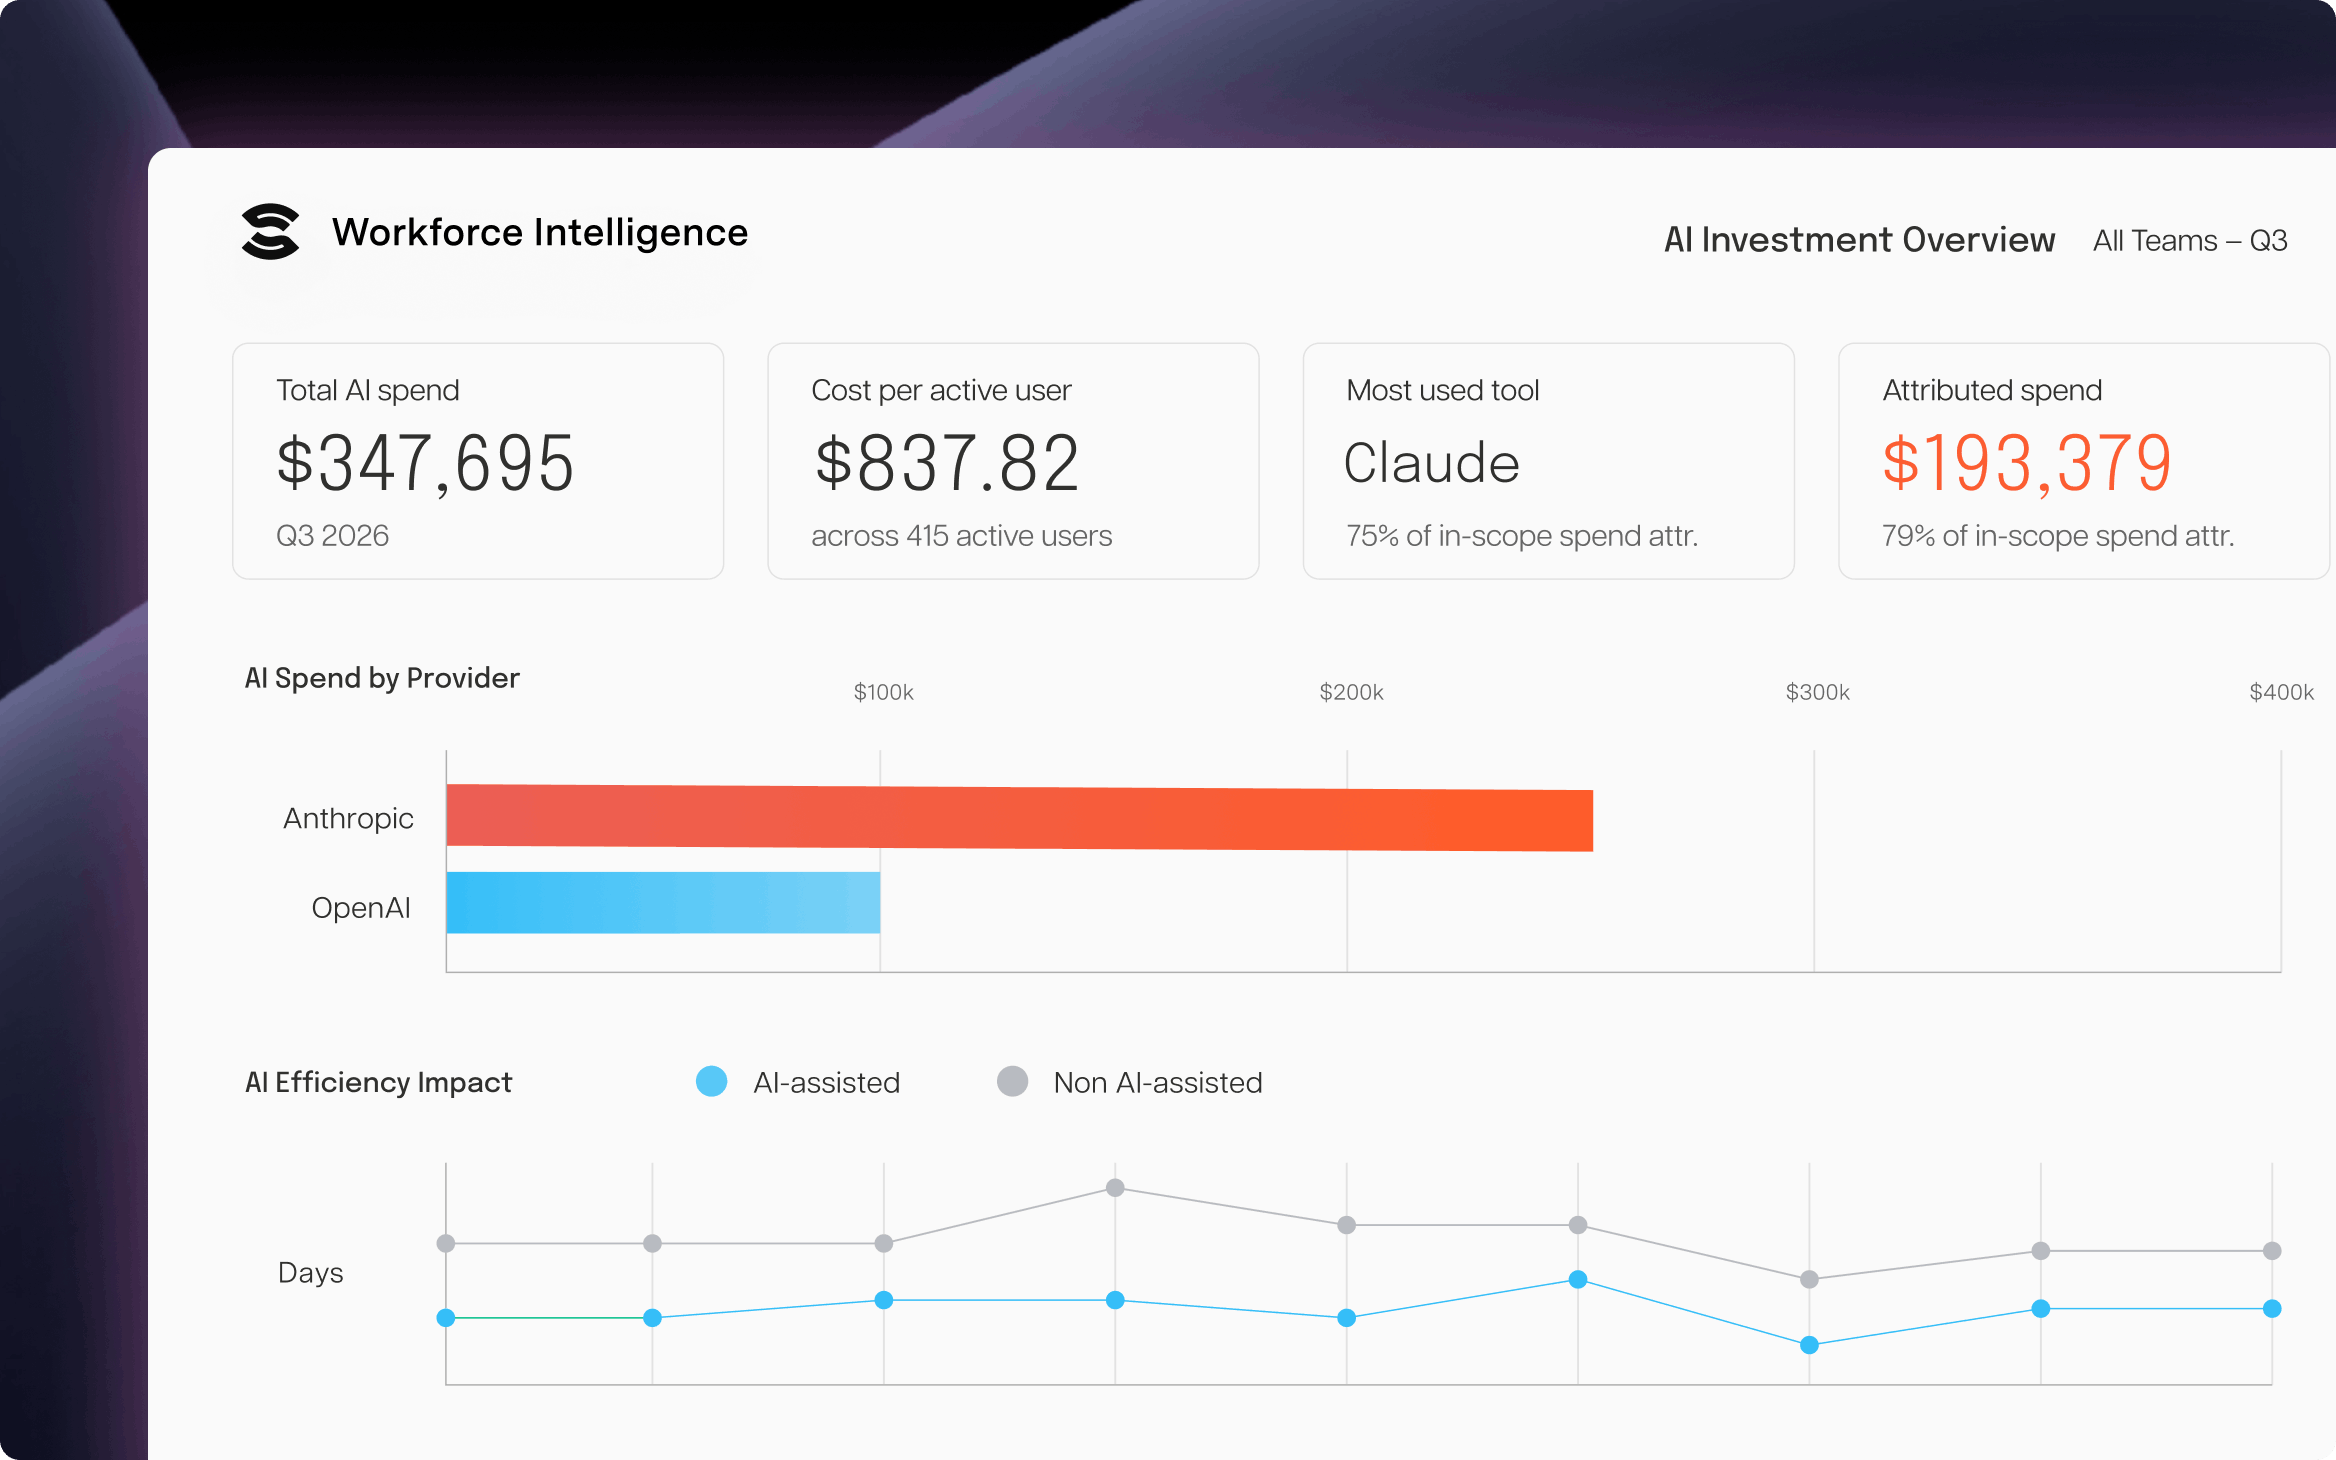
Workforce Intelligence
The only solution that ties AI vendor spend to the teams, epics, and Jira issues it supported.
Start a Free TrialCouldn't find what you need?Go to our documentation
AI usage can grow quickly across engineering teams. Cost tracking helps organizations understand where spending occurs, identify waste, and measure whether AI investments are delivering business value.
Token tracking measures model usage by counting input and output tokens. LLM cost tracking goes further by translating that usage into costs and linking those costs to specific business activities.
AI cost attribution is the process of assigning AI expenses to a team, product, feature, project, or Jira work item so organizations can understand who incurred the cost and why.
Use these tips to learn how to discover your greatest personal strengths so you can apply them to various aspects of your job and succeed.

Boost team connection and collaboration with 99 engaging team-building questions for goal-setting, bonding, and everything in between.

Learn eight project portfolio dashboard best practices for reliable reporting, consistent rollups, and current data across Jira projects.

Learn what portfolio reporting contains, report types by audience, why cycles break, and how continuous reporting changes the executive conversation.

Uncertainty and change are inherent in all project plans but if you adopt an agile methodology, you can embrace any changes in your project.

Different work styles have unique impacts on motivation, productivity, and business outcomes. Identify your style & better understand your colleagues.

Learn how to use different types of marketing calendar templates to streamline your workflows. Find free template resources to get you started.

Known as "Eat the frog," this oddly named technique helps tap into productivity, overcoming procrastination and lack of motivation.

Finding the best software for your business is hard work. Read about the different processes to figuring out software requirements for your company.