

Do some of your teams use Confluence but not Jira? Find options for getting Jira reports into Confluence & keeping these teams in the loop.
Learn how to generate Jira reports in Confluence to help build transparency, informed decision-making, and facilitate organizational collaboration.

Jira reports in Confluence combine issue data from Jira with the documentation and collaboration layer of Confluence, so teams can track work-in-progress and share status from a single project dashboard. Linking the two Atlassian tools consolidates project documentation and issue tracking in one place, giving leaders visibility from conception to completion.
Atlassian Jira is a project management tool for IT and software teams that tracks issues, tasks, and workflows. Confluence creates, organizes, and shares project documentation and other content as part of collaboration management efforts. Connecting the two creates a shared environment for cross-team transparency.
Here's how to generate Jira reports in Confluence by linking the two platforms and using the features that improve information sharing.
Jira reports in Confluence are dashboards that pull live Jira issue data into a Confluence page, letting users create issues, track tasks, and collaborate from one view. Jira ships several out-of-the-box macros that surface data as tables, charts, or graphs. The Jira Issues macro renders issues in a table; the Jira Chart macro produces:
Bar charts
Pie charts
Line charts
Area charts
XY scatter plots
Time series graphs
Gantt charts
Once Jira reporting lives on a Confluence dashboard, tools like Table Filter and Charts for Confluence can operate on the Jira issue table output to:
Filter Jira issues by specific parameters
Aggregate or summarize data with pivot tables
Visualize data using customizable charts and graphs
These functions let you build reports and presentations that address every stakeholder, from project team members to upper management and investors.
The connection method depends on the platform you run.
On Confluence Cloud, no separate connection is needed. Edit the Confluence page and paste the Jira task or project URL onto the dashboard. Use a JQL query to specify report parameters, then click Save; the page updates with live project data. The Jira Issues macro handles multiple issues at once.
Confluence Server and Data Center users have a heavier process. It requires administrator credentials for both applications, so verify access before attempting to establish the two-way link.
With administrative privileges in place, follow these steps:
1. Open Confluence 1. Click the settings icon in the top right corner of the interface 1. Under "Confluence Administration," select "General Configuration" 1. Select "Application Links" 1. Type the Jira task, issue, or project URL into the text field 1. Click "Create new link" 1. Use the Setup Wizard to configure the linkage
Setup is complete, and you're ready to create Jira reports and charts in Confluence.
To view a dynamic list of Jira issues from the Confluence dashboard:
1. From the Confluence page, tap "+," then select "Jira," or open the page to edit and type "/jira" 1. Enter the Jira issue name or search options in the search bar 1. Select the names of existing issues to display, create a new Jira issue, or choose from recently viewed issues. You can also search by issue key, search URL, Jira link, JQL, plain text, or filter. 1. Click "Display options" to customize the output 1. Select "Insert"
Jira's native macros also populate Confluence reports used in status updates and other information-sharing formats.
Jira Issues macro: Posts a single issue, a subset, or a summarized count of Jira issues.
Jira Chart macro: Adds a Jira dashboard gadget listing a table of issue types and their status.
Depending on how you want to manipulate the data, there are several ways to visualize it.
Single issue: Confluence lets you report on a single issue or task within the dashboard.
Total issue count: Generates an overview of project tasks.
Detailed issue table: Jira provides display options to shape the data, such as customizing the number of columns or the count of issues in a table. Tables can hold up to 1,000 issues. Beyond that, create separate tables and merge them with the Table Transformer macro. The combined table's weight may slow page load times.
Pivot table: Summarizes issues or aggregates data against a specific parameter, so users can format and access table data for further visualization.
To create a Jira report from a Confluence page:
1. Log into Confluence and navigate to the page where you want to embed the Jira report 1. Search for "Jira report" in the template selection area of the page 1. Select the report format to display (Issue Status Reports, Sprint Burndown Charts, Velocity Reports, Time Tracking Reports, Project Overviews, etc.) 1. Identify which Jira project to pull data from 1. Customize the report using filters, fields, and the Jira Charts macro 1. Save the page configuration and publish it
The Jira Charts macro visualizes project or issue data with several chart types, including:
Pie chart: Distributes issue data by type, project assignee, priority, or another parameter.
Created vs. resolved chart: Shows the ratio of created and resolved tasks over a specific period.
Two-dimensional chart: Like a pivot table, aggregates issues against two data sets.
Tempo's Custom Charts for Confluence extends Confluence's native report generation, taking data visualization further.
Custom Charts creates a central hub with real-time updates on key project metrics. Chart macros are fully customizable and pull from a range of fields, including third-party apps, JQL queries, and saved filters. The app works alongside other Tempo products like Timesheets, Structure, and Custom Charts for Jira.
Use pre-built templates, or personalize charts and graphs with custom colors to simplify communication with stakeholders. With Tempo, the choice is yours.
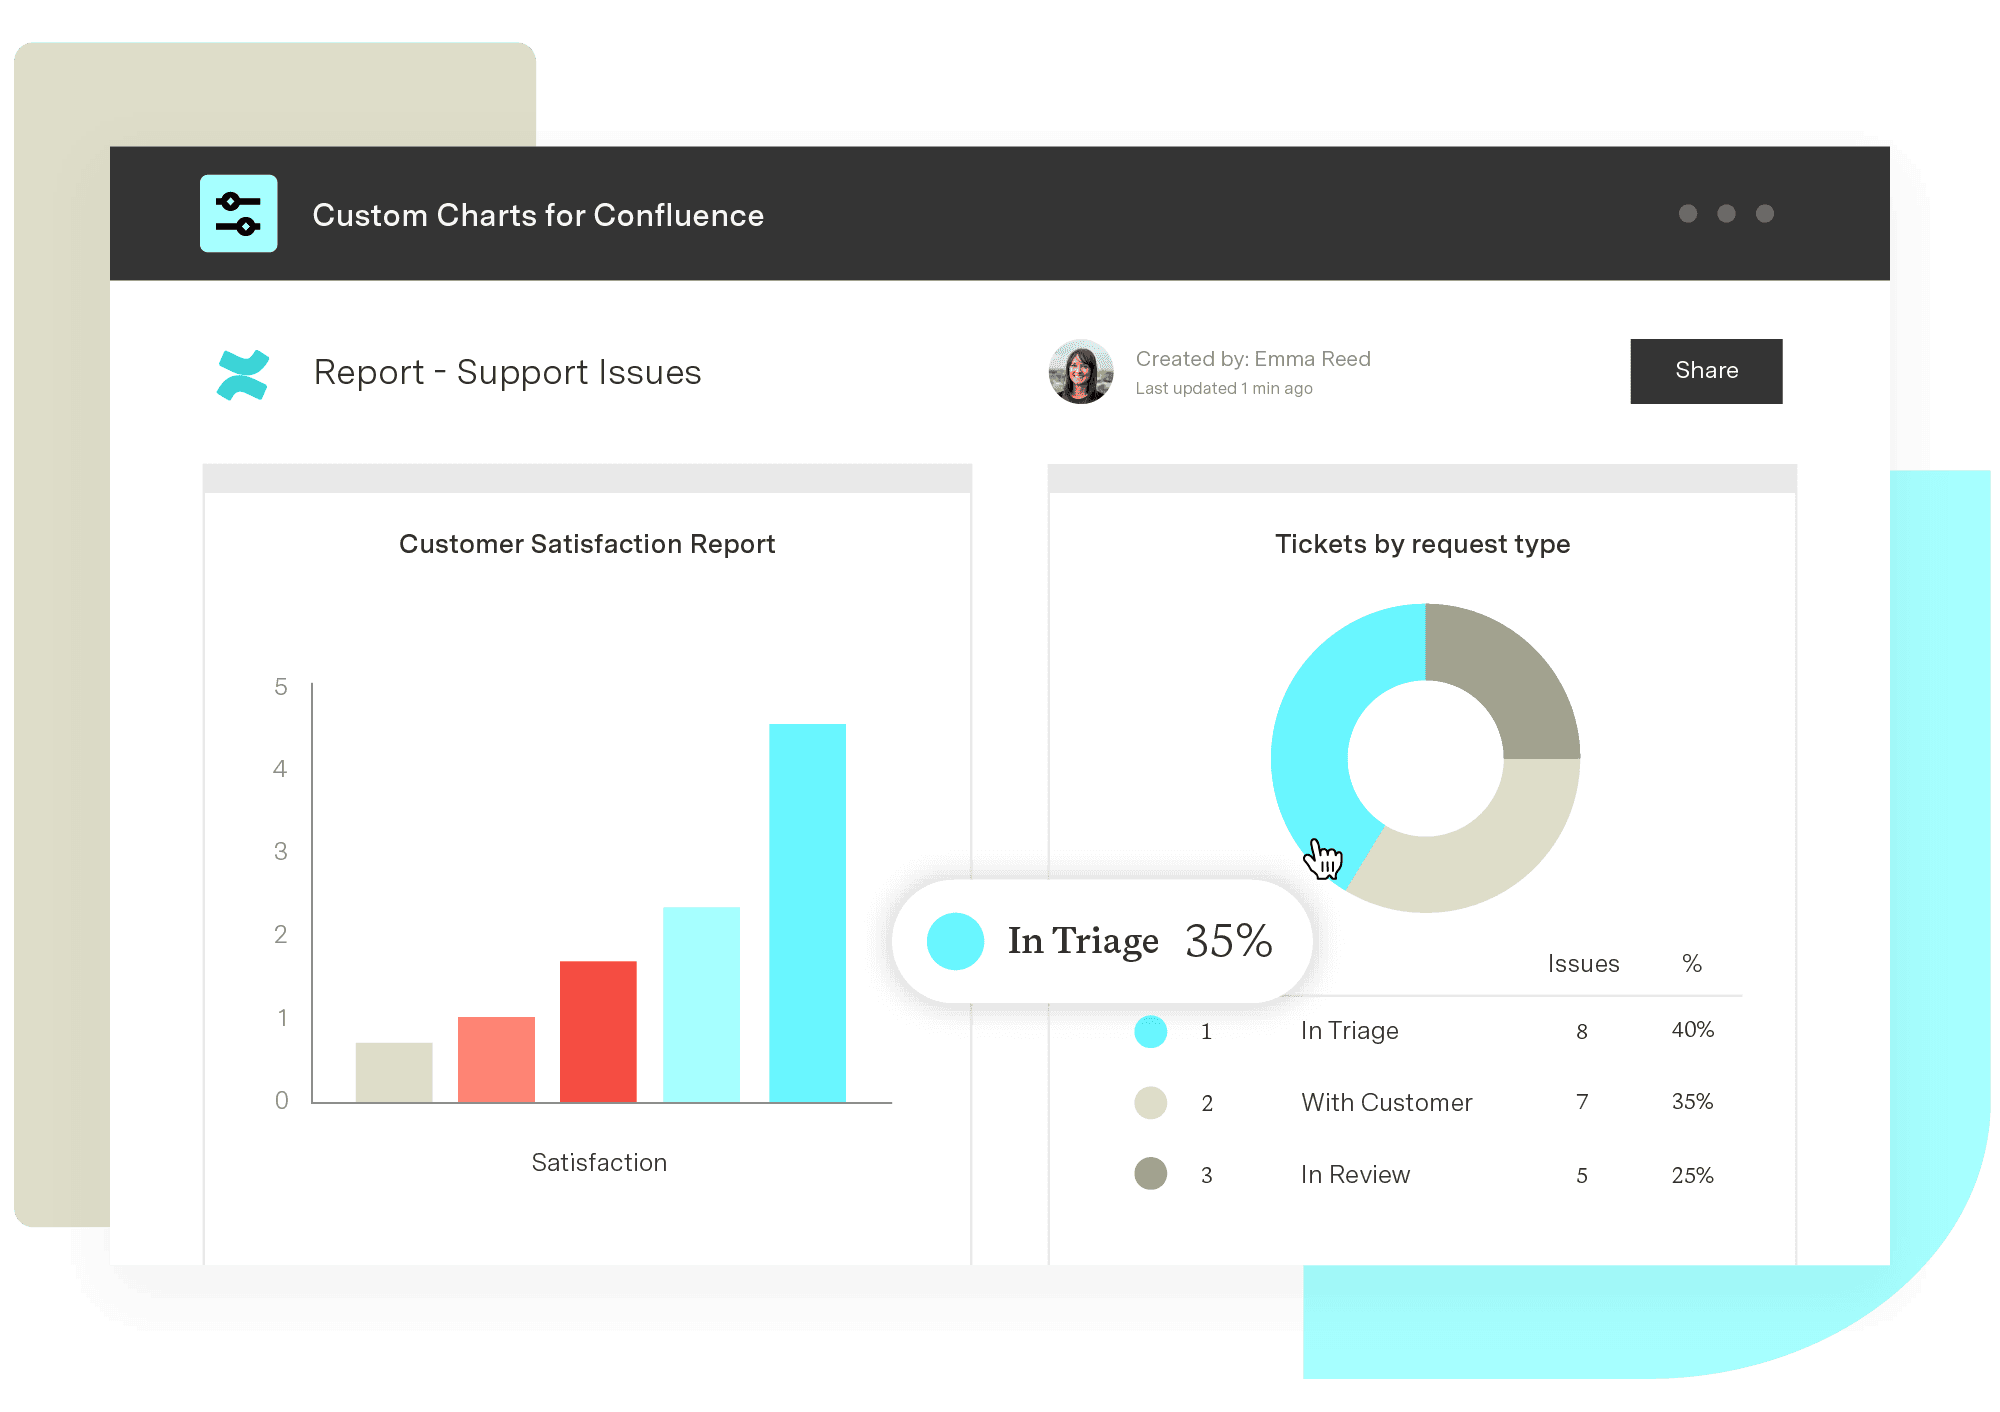
Custom Charts for Confluence
Get visualizations for dozens of different custom fields to understand your team’s work and communicate bottlenecks and successes without saying a single word.
Start a Free TrialCouldn't find what you need?Go to our documentation
Confluence can showcase a range of data, including: Individual issue information: Display details of an issue, such as summary, assignee, status, due date, and custom fields. Issue lists from filters: Confluence can present a filtered view of relevant tasks using specific filters. Issue counts: Show the total number of issues according to established filter criteria. Jira charts and reports: Illustrate Jira data using pie charts, bar graphs, burndown charts, and other custom reports delivered directly to Confluence page dashboards. Issue links: Provide context by identifying linked tasks between different Jira issues. Project information: Outline project detail fields like name, description, and overall status.
The integration between Jira and Confluence is dynamic, so reports will update in real time whenever data changes.
You can customize the appearance of Jira reports by integrating a third-party application like Tempo’s Custom Charts for Confluence.
Do some of your teams use Confluence but not Jira? Find options for getting Jira reports into Confluence & keeping these teams in the loop.

The integration between Jira and Confluence is strong. Here's how teams should be taking advantage of it.

Learn how various Jira custom reports can improve team efficiency and manage workloads while providing the necessary data for informed decision-making

A Jira and Confluence integration yields a powerful business solution that helps you manage content, projects, and issues in one effective toolbox.

Confluence isn’t just for words. It’s for pictures too. Here’s a useful guide to the best apps for making and sharing Confluence diagrams and charts.

Progress reports encourage organizational transparency and keep stakeholders informed. Learn how to compose intuitive and valuable reports.

Visualize your project with Confluence Gantt charts. Learn how to create, manage, and optimize them for better collaboration & project tracking

Now you can make detailed reports on the status and progress of your custom structures on a Jira dashboard.
You'll be glad to hear startups and small businesses with 10 or less users get a free Jira license for everyone!


















