

Learn how to generate Jira reports in Confluence to help build transparency, informed decision-making, and facilitate organizational collaboration.
Learn how various Jira custom reports can improve team efficiency and manage workloads while providing the necessary data for informed decision-making

Jira custom reports pull targeted project data out of Jira and present it as configurable charts, tables, and dashboards. Project managers use them to track progress, spot bottlenecks, balance workloads, and back decisions with evidence instead of gut feel.
Out-of-the-box Jira reporting is already dense with information. The advantage of custom reports is that you can shape them to the way your team works — status updates, sprint reviews, workload monitoring, or executive rollups. Here's how to build Jira custom reports that fit your team's requirements.
Jira custom reports are configurable views of Jira project data used to surface metrics for decision-making. Both Jira Service Management and Jira Cloud generate large volumes of data, and custom reports give managers a way to filter and present that data for a specific audience.
Users can build reports with custom JQL queries to gather data specific to a project, team, or issue type. Jira analyzes the results and delivers an in-depth view of project or team performance — as a standalone report or as a widget on a dashboard. Customized insights uncover areas of concern and help managers adjust strategy to keep projects on track.
Jira custom reports cover six primary areas of project work:
Productivity
Scope
Quality
Schedule
Product flow
Predictability
A Jira report can show how many tasks a Scrum team completes in a sprint. That data supports workload management, prevents overloading any one team member, and flags bottlenecks when tasks stall. A rising debugging count across sprints hints at quality issues that need attention.
Jira delivers analytics in two formats. Jira reports offer a detailed analysis of a project's issues and sprints, focused on trends and insights. Jira dashboards give a high-level overview of multiple projects, displaying data as intuitive charts and graphs on the user's home screen. Dashboards are personalizable, so information stays within reach and decisions can move quickly.
Jira reports fall into several categories.
Kanban teams have access to two Jira reports:
Cumulative Flow Diagram: Provides a visual analysis of an issue's progress through the workflow to identify bottlenecks and evaluate progress.
Control Chart: Monitors or tracks cycle time and throughput.
Scrum teams can use the cumulative flow diagram plus the following:
Sprint report: Summarizes the team's progress during the sprint.
Epic report: Tracks remaining tasks based on the initial work estimate within an epic.
Epic burndown: Visualizes the team's progress against the total number of user stories in an epic.
Burndown chart: Illustrates the number of remaining tasks in a sprint versus the initial total.
Burnup chart: Tracks the number of completed tasks compared to the sprint's initial workload.
Version report: Illustrates the team's progress toward completing a version.
Velocity report: Visualizes the amount of work completed during a sprint.
Together these reports let agile teams evaluate progress, identify bottlenecks, and spot trends affecting sprint performance. The data also helps Scrum Masters and project leaders forecast workload and prevent burnout.
Jira forecasting and management reports give project managers visibility into workflows and pipelines so they can distribute assignments more effectively. A few examples:
User workload report: Tracks the number of tasks assigned to a user across multiple projects.
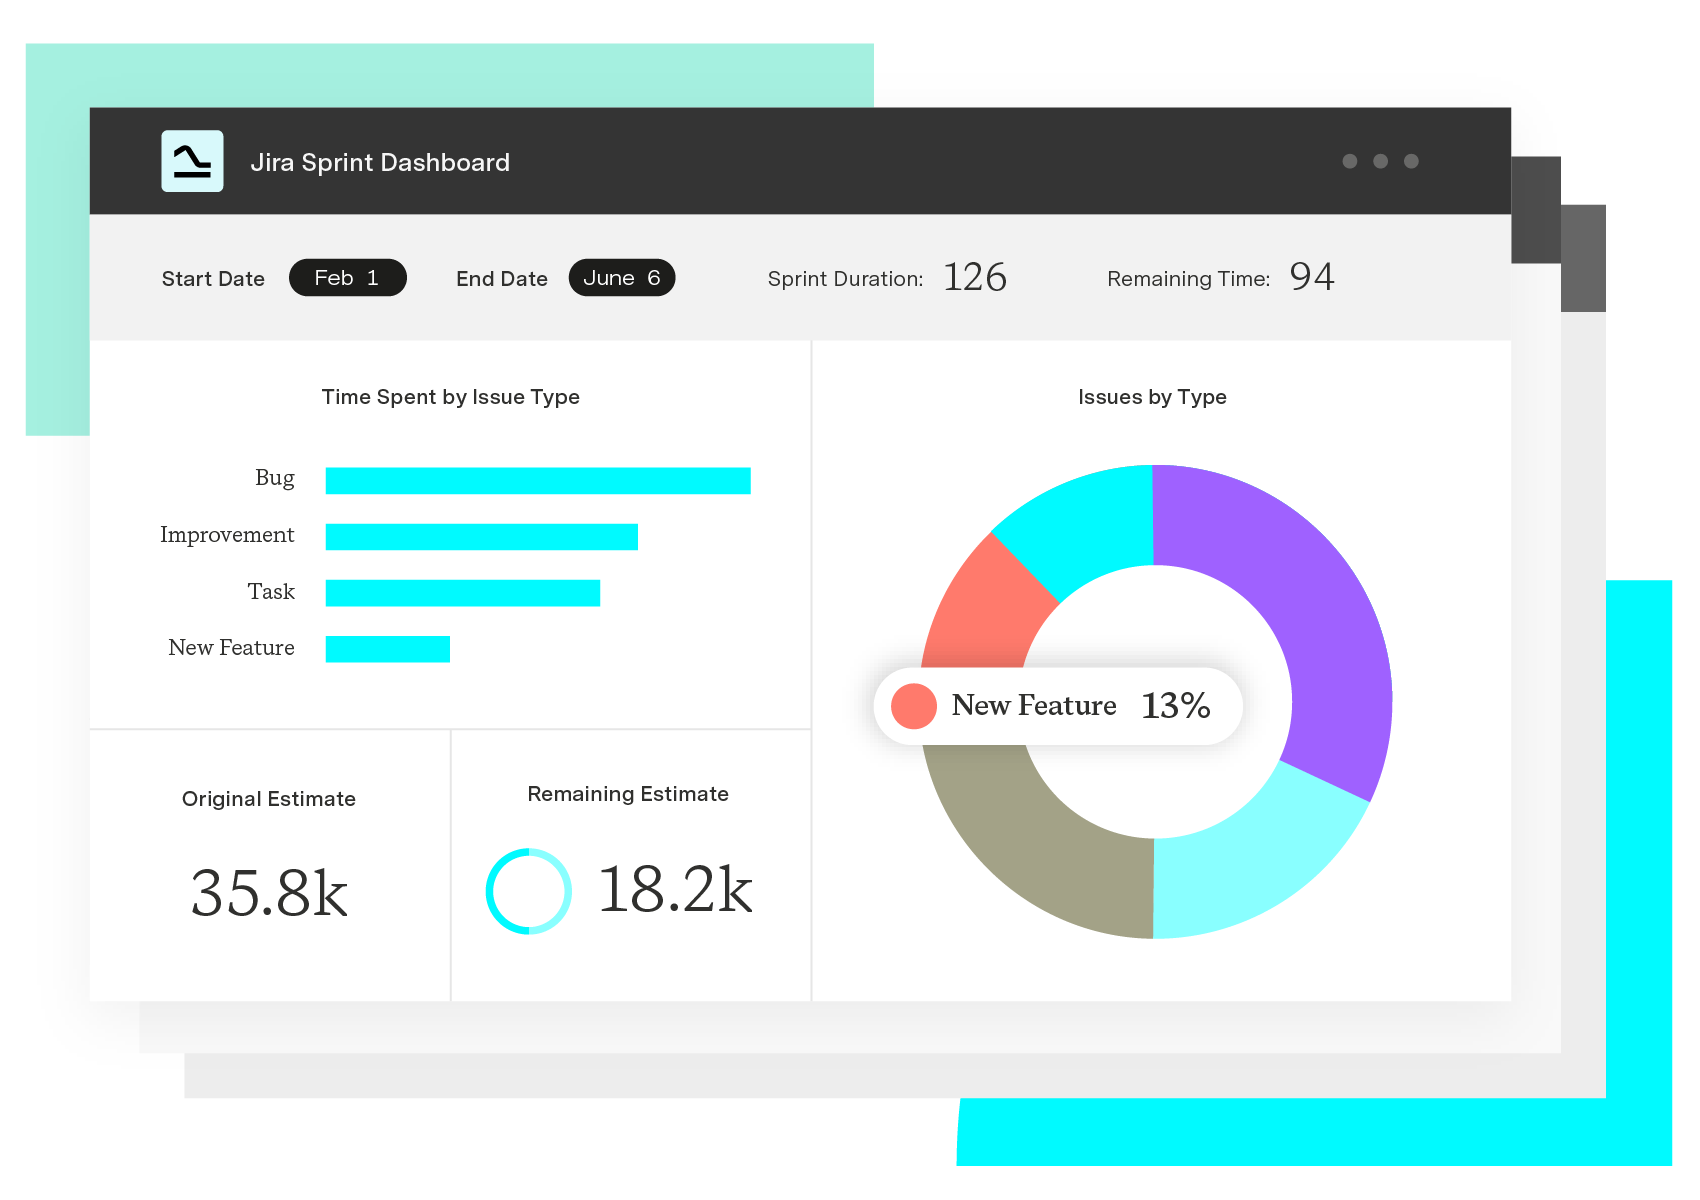
Time tracking report: Presents detailed information regarding time spent on different issues within a project, including original time estimates, logged time, and remaining time per issue type or team member.
Version workload report: Illustrates the total work amount associated with a specific project measured in estimated time.
Workload pie chart report: Uses a pie chart to illustrate the relative workload distribution among team members within a project or filter based on time estimates or issues logged.
These reports help managers assess workloads and monitor time usage so team members aren't overburdened.
Jira issue analysis reports show backlog health and team capacity, helping project managers see whether the group is on pace to hit its goals. General-purpose reports like the pie chart and the "time since issues" report send data visualizations straight to the dashboard.
Pie chart: Offers a visual representation of team utilization.
Average age report: Outlines the number of days an issue has gone unresolved within a project or filter.
Created vs. resolved issues chart: Illustrates the number of new issues created compared to the number resolved within an established timeframe.
Resolution time report: Depicts the average time it takes to resolve an issue from its inception.
Recently created issues report: Tracks the number of new issues created within a specified timeframe.
Time since issues report: Calculates the time elapsed between logging an issue with a specific date field (e.g., Created, Updated, or Resolved) and the current date.
Single-level group by report: Filters issues according to a particular field, such as assignee, issue type, project, or status.
These reports are only available in company-managed projects. Team-managed Jira software projects are limited to four reports:
Burnup report
Cumulative flow diagram
Velocity report
Sprint burndown chart
New to custom reports in Jira? Here's the setup:
1. Log into Jira. 1. Click "Projects" from the dashboard's top navigation bar, then select the desired project name to open the Project Board. 1. After navigating to the Project Board, access the Reports Menu using the left-hand navigation. 1. Click on the report you wish to generate from the navigation menu, then select the desired parameters.
The fresh report renders on screen.
Jira Query Language (JQL) lets you build a custom report that filters and analyzes data against precise specifications. To access the JQL reporting function:
1. Log into Jira. 1. Access your project by clicking "Projects" in the top navigation bar and selecting the project title from the drop-down menu. 1. Click "Create new report." 1. Identify the report using a unique but relevant name. 1. Under report configuration, select "Switch to JQL." 1. Draft your query in the JQL field using the appropriate JQL syntax. 1. Define visualization options by choosing a suitable chart or graph type. 1. Label axes and field mappings. 1. Click "Save." 1. Access the generated report within the Report tab of your project page.
Jira dashboards visualize key project metrics using native functionality or third-party integrations from the Atlassian Marketplace.
To set up a custom Jira dashboard:
1. Navigate to the Dashboards tab on the top navigation menu. 1. Select "Create Dashboard." 1. Fill out the fields in the Create Dashboard dialogue box, including the dashboard's name, description, and viewer access levels. 1. Drag and drop the desired gadgets from the right-side panel onto the board. 1. Save the dashboard.
Dashboards can also be saved as templates and reused across multiple projects.
Whether you're working in Jira Work Management, Jira Service Management, or Jira Cloud, Tempo's solutions expand reporting with financial insights, time-tracking data, and capacity planning.
Tempo Timesheets gives project managers custom dashboards and visualization tools for detailed resource usage and capacity reports. Custom Charts for Jira delivers flexible reporting for teams across marketing, ITSM, HR, and beyond — evaluating delivery throughput and team velocity in whatever cut the audience needs.
With Jira and Tempo working together, project managers get visibility into every layer of team performance.
Custom Charts for Jira
Build charts and dashboards to evaluate delivery, capacity, and speed for all teams with Jira's most flexible custom reporting app
Start a Free TrialCouldn't find what you need?Go to our documentation
Jira’s custom reports allow users to create personalized reports by selecting metrics and other data from their projects, extracting precise data, and conducting analyses that aren’t available with Atlassian’s standard reports.
Users can automate custom reports using the built-in Jira Automation functionality. This feature establishes rules to automatically generate and send reports based on the following criteria:
-A schedule
-Specific triggers
-JQL queries
Many third-party plugins and gadgets can expand Jira’s reporting capacity. For example, the Atlassian Marketplace offers these solutions:
-Tempo Timesheets
-easyBI
-BigPicture
-Zephyr
Learn how to generate Jira reports in Confluence to help build transparency, informed decision-making, and facilitate organizational collaboration.

Learn to create, share, and manage Jira filters to improve workflow, generate insights, and provide transparency to project teams and stakeholders.

Do some of your teams use Confluence but not Jira? Find options for getting Jira reports into Confluence & keeping these teams in the loop.

Improve Jira search efficiency and accuracy by using JQL to create custom queries. Then, save and distribute them for repeated use.

Discover how to export data from Jira into various file formats for analysis and reporting. Learn to automate updates to your favorite spreadsheets.

Learn to configure Jira “Resolution” field values to provide insight into an issue’s progress and accurately gauge performance.

Jira resource allocation helps teams assign tasks and manage workloads. Learn to use Jira’s tools and enhance your planning with Tempo.

Discover blockers, assess workloads, and find out how long projects are taking, in a range of eye-catching charts on time in status in Jira.

With a deep understanding of your team’s activity, you’ll be better equipped to make the decisions that matter.
















