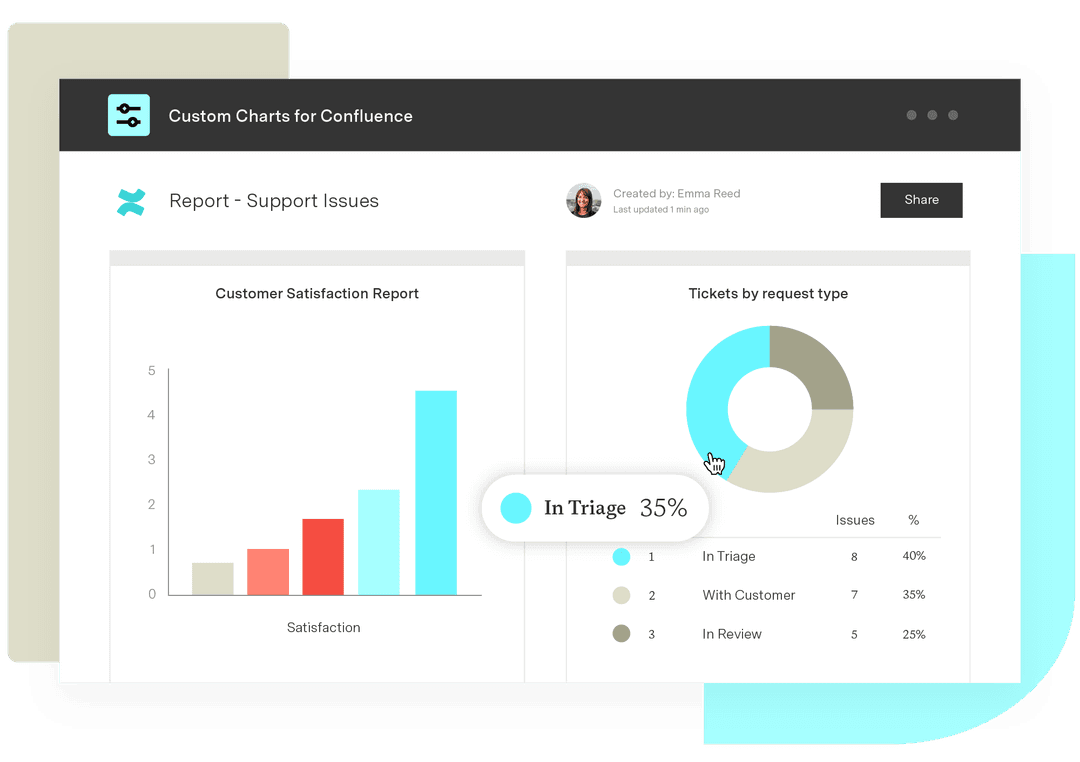
What’s the best way to visualize Jira projects in Confluence?
Tempo Team
When we talk about reporting on Jira data, unsurprisingly we tend to talk about apps for Jira. However, many teams using Jira also find themselves working in Confluence, and sometimes primarily in Confluence. Because the integration between these two tools is so strong, teams should be taking advantage of it. That’s why this article looks at options for visualizing your Jira issue data in Confluence.
Powerful native macros
Confluence ships with a number of macros that are a good starting point for pulling your issue data into Confluence.
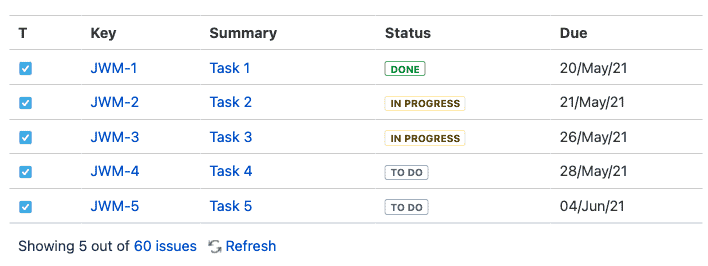
The most popular and multipurpose option is the Jira issues macro. This macro allows you to embed a single Jira issue into a Confluence page (as in the image above), create new issues from within Confluence, or display a list of issues as filter results. The filter results view is a crowd favorite and particularly useful for meetings or agile ceremonies like retrospectives, or when you’re looking to pull together a project status report. You’re able to customize which columns are displayed and which issues are pulled in, just like the Jira issue search. Because this macro pulls issue data directly from Jira, no manual updating is required.
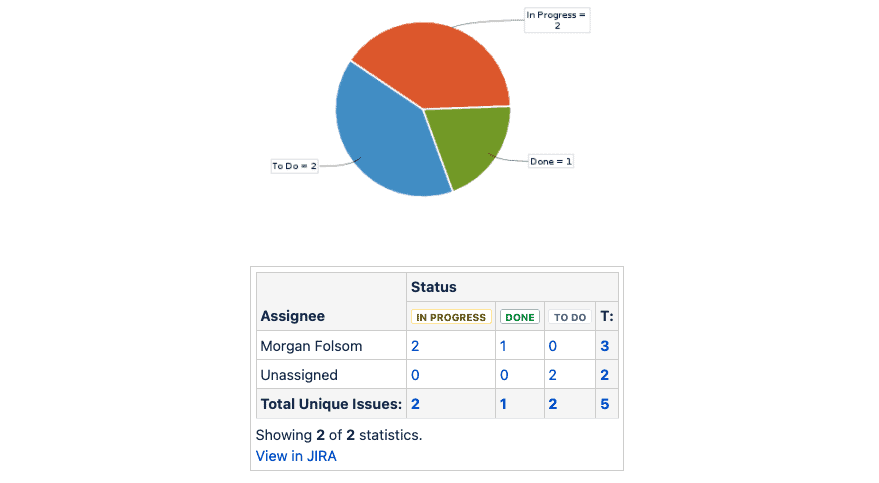
There’s also the Jira charts macro, which provides a few limited reporting options. These charts generally operate in the same way as their Jira dashboard counterparts, enabling you to see basic pie charts, two-dimensional filter statistics, and created vs. resolved issues on a Confluence page. What’s nice about this macro is that it pulls in live data capable of being dynamically interacted with and updated in real-time, keeping your Confluence pages relevant for much longer.
They’re very utilitarian, though. You have a few options available to select what information you want to pull into the charts, otherwise, just like Jira dashboard gadgets, you can’t customize how they appear, e.g. ordering, hiding specific data points, adjusting colors, etc.
Marketplace apps
For more dynamic or customizable reports in Confluence, many teams look to the Atlassian Marketplace. If your team uses a marketplace app to add functionality to Jira for things like project management or software testing, you’ll want to check out the individual app documentation to see if they can accommodate displaying app-specific information in Confluence. Some will provide options like embedding information in an iFrame on the page. Others, like Advanced Roadmaps, will allow you to install a separate free app for Confluence Cloud that pulls in some read-only information onto your pages.
However, if you’re looking for flexible and fully customizable Jira reporting in Confluence, an app made specifically for reporting can reduce the headache of digging into different vendor solutions.
Custom Jira Charts for Confluence
Custom Charts for Confluence is a reporting app that is focused on enabling all Confluence users to build beautiful reports, even if they’re not Jira experts. These charts are based on your Jira data but can be built and managed entirely from Confluence, making them perfect for teams who love the tool but also need to report on Jira issues. Custom Charts is also able to pull in information from many other marketplace apps (see this documentation for a full list).
Unlike other apps, this is much more than taking screenshots or embedding read-only versions of your charts onto your Confluence pages. In fact, Custom Charts for Confluence works just like the Jira version of the app, and just like the native macros, displays live data that you can interact with.
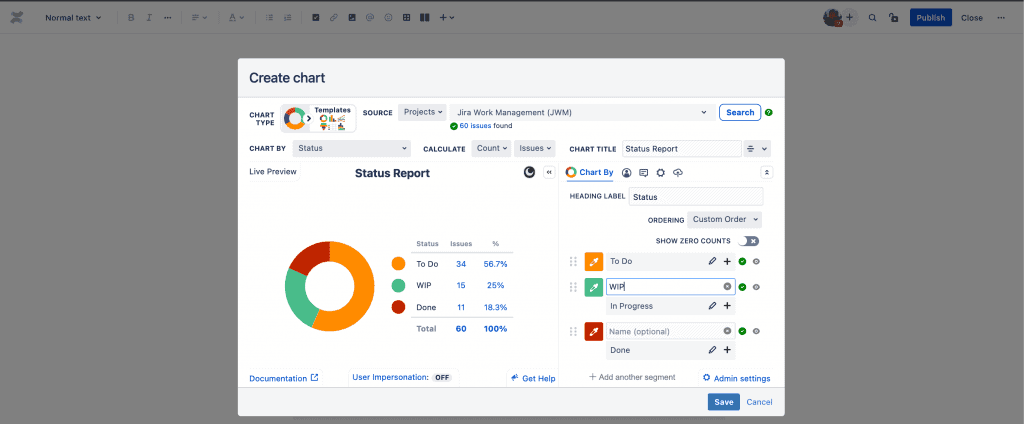
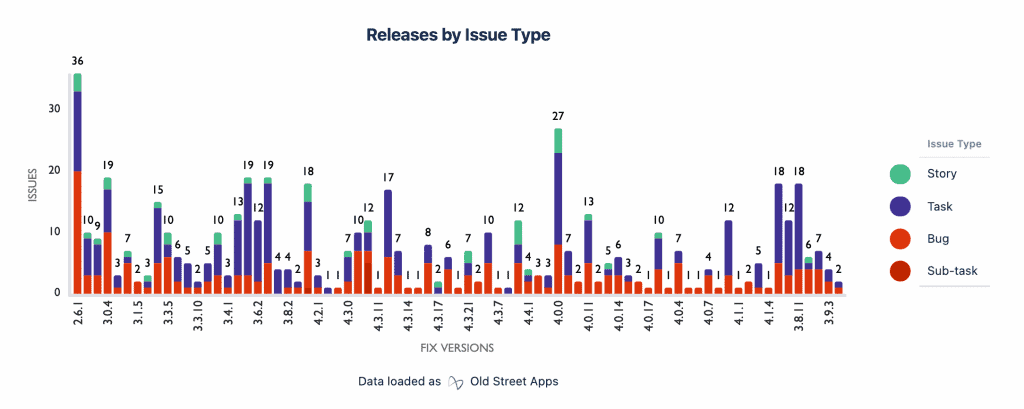
Using a single macro in Confluence, you can create a wide variety of charts, and select the specific Jira data that you’d like to report on. From this macro, you can create pie charts, bar charts, tables, and much more while also customizing colors, hiding/showing data as you need, and renaming to make the information more user-friendly.
On top of the easy-to-use editor and nice-looking charts, Custom Charts has a few specific features that will enhance your Confluence reporting even further.
The first is Simple Search – this is an additional macro that comes with Custom Charts and allows users to dynamically filter multiple charts at once on the page. Just add the Simple Search macro to your Confluence page, then link it to your charts and you’ll be able to filter multiple charts with a single click.
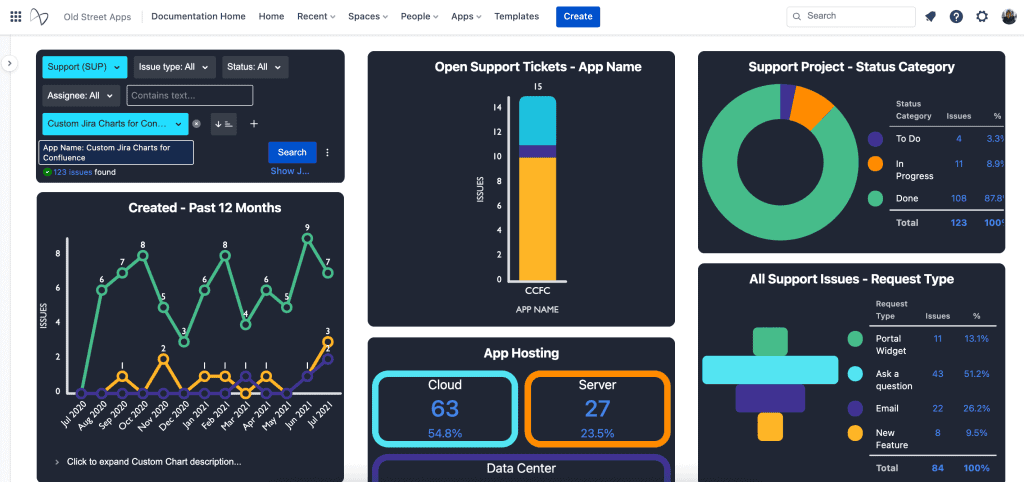
Placed in the top left corner of the Confluence page above, selections in Simple Search will filter charts down as you make selections. This allows individual users to drill down into the data however they like, providing additional flexibility on the page.
Another key benefit of Custom Jira Charts for Confluence is User Impersonation. This feature, which must be turned on by your Confluence administrator, enables you to have your charts loaded as a specific user. This means that if you have execs or customers who will be viewing Confluence pages but don’t have access to your Jira, you’ll be able to load charts so that they can see the data.
Okay, so how should I report on my Jira data in Confluence?
We’ve walked through a few different options, and the real answer is: a combo! Most data visualization solutions in Confluence will have a mix of native gadgets, including ones from marketplace apps, as well as things like screenshots or attached spreadsheets. Utilizing several of these options at once gives your team the most scope for visualizing Jira projects in Confluence effectively. Custom Charts in particular is a great solution if you’re creating reports based on issue data, for internal or external users. Specific apps and native macros will also have their place – the benefit of Confluence is that you’ve got a ton of flexibility in terms of how you display data.
Ultimately, the goal is to ensure that whatever reporting you have is accurate, up to date, and easy to use, and this combination of options is likely to achieve exactly that. Give the Customizable charts, tailored for Jira and Confluence a try.
Sign up for a demo
Register

