Want a deeper level of detail about your tickets on Jira dashboards? Appfire's Jira Misc Custom Fields and Tempo's Custom Charts are the answer.

Lots of users have asked to be able to create charts showing things like original estimate versus remaining estimate. As always, we listened, and are excited to announce that it’s here. Custom Charts for Jira and Custom Jira Charts for Confluence now have the ability to display multiple calculations in a single chart.
Multiple calculations are available to display in the legend on pie charts, funnel charts, and one-dimensional tables. On pie and funnel charts, the chart itself will continue to display the field selected from the Calculate dropdown, i.e. the primary calculation, which is designated in the table with the chart icons next to the primary calculation headings.
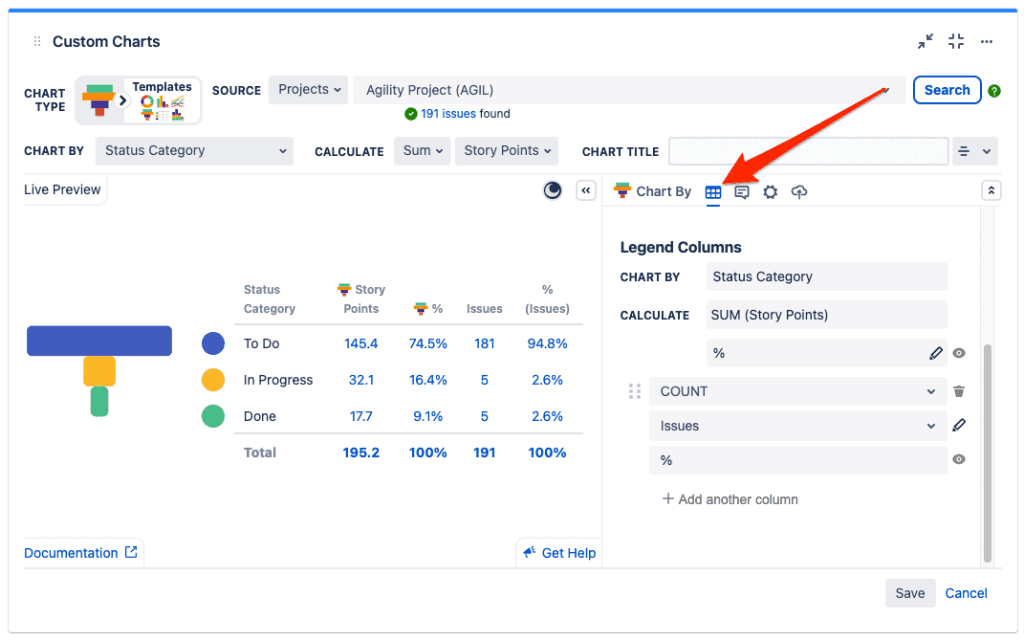
Once you’ve selected your primary calculation, like you would normally, just open the Legend tab and select Add column to include even more information in the legend of your chart. Each calculation can be renamed using the pencil, and you can optionally choose to show/hide the associated % column with a click on the eyeball.
Here are some of our favorite use cases for this feature to get your creative juices flowing:
Original Estimate & Remaining Estimate & Time Spent to see some basic time tracking reporting using Jira’s out-of-the-box time tracking fields.
Time Spent & Story Points for teams using story points to track estimates and logging time for actual effort.
Time to Resolution & Story Points to see how your estimates compare to the amount of time that it took to complete the work.
Time Until Due Date & Remaining Estimate to see if there may be any problems completing work on time based on how much estimated work is remaining.
This feature is now available to customers on Cloud, Server, and Data Center using either Custom Charts for Jira or Custom Jira Charts for Confluence.
Let us know what you think about this feature and any others that you’d like to see through our support portal.
Sign up for a demo
Request demo
Custom Charts for Confluence
Get visualizations for dozens of different custom fields to understand your team’s work and communicate bottlenecks and successes without saying a single word.
Start a Free TrialWant a deeper level of detail about your tickets on Jira dashboards? Appfire's Jira Misc Custom Fields and Tempo's Custom Charts are the answer.
See how Custom Charts for Jira lets you build cross-project dashboards, story-point breakdowns, and control charts that native Jira reports can't.

Custom Charts dashboards are now more shareable to anyone – in JSM portal or internally like a wallboard.

Jira uses three top add-ons for calculations and scripting are: ScriptRunner for Jira Jira Misc Custom Fields (JMCF) and Power Scripts for Jira.
We look at EazyBI's strengths and weaknesses and explain why Custom Charts for Jira is the superior reporting app for Jira dashboards.

Cross-Jira reporting improves your execution for multiple projects by helping you monitor resources and identify dependencies to optimize execution.
Remote workers can get just as much benefit from a Jira wallboard as their office counterparts. And Custom Charts Shared Dashboards can help.
Now you can make detailed reports on the status and progress of your custom structures on a Jira dashboard.

Group issues by version fields (including custom fields) and keep items with the same version name together, even across different projects.