

A new gadget now comes with Custom Charts for Jira. Called Issue List, it’s similar to native Jira’s Filter Results, but better. Check it out.

Have you ever wanted to share your Jira dashboards with people who aren’t licensed Jira users?
Custom Charts’ new Shared Dashboards feature allows you to share entire dashboards of your favorite charts with internal and external users on Jira Cloud. With this new feature for Custom Charts for Jira, you can display Custom Charts in the Jira Service Management (JSM) portal or internally like a wallboard.
Gain early access to Public Shared Dashboards and shape the future of external reporting in Custom Charts.
Request to Join the EAPTo create a Shared Dashboard, simply create your dashboard as you normally would with Custom Charts gadgets. Once you’ve configured your charts, you can add a Custom Charts – Shared Dashboard gadget to the dashboard.
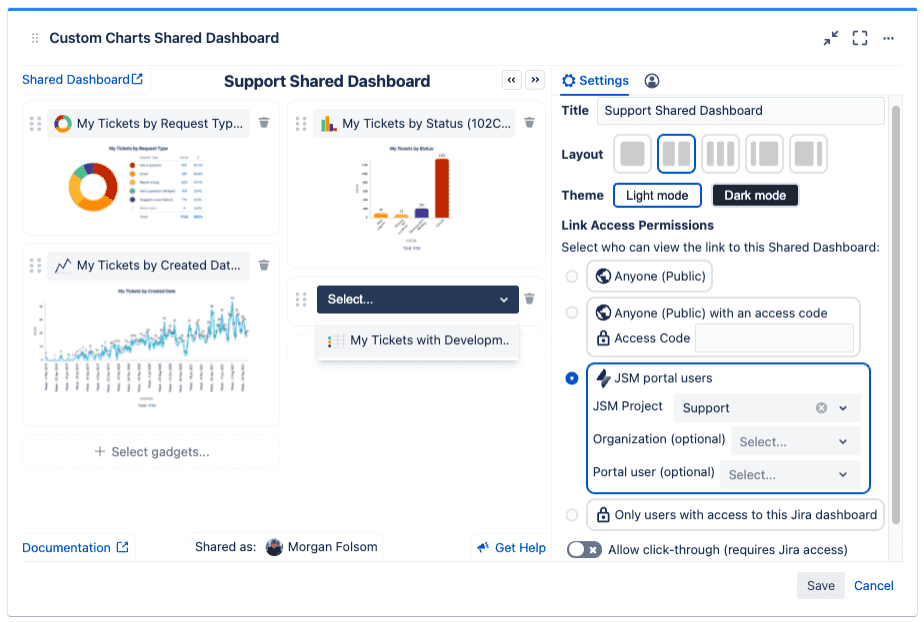
Once you’ve added the gadget, you can customize the column layout and rearrange the charts, select light or dark mode, and customize where the Shared Dashboard is visible (in the JSM portal or internally in your Jira instance).
To create a dashboard that is only visible to licensed Jira users who have permission to see the Jira dashboard, you can select Only users with access to this Jira dashboard. Using this option, you can create a wallboard-like view for your team, so that the dashboard appears full-screen. It also means you can show the entire dashboard in dark mode finally.
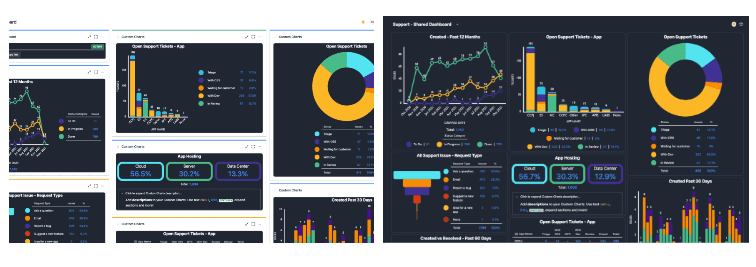
Below is a comparison of the normal dashboard in dark mode and the new shared dashboard in full dark mode.
We’ve had many requests for the ability to display dashboards in the Jira Service Management portal, and Shared Dashboards is the ‘ticket’! The portal can provide a list of tickets that customers are able to see, but no real insights into those tickets. Now, you can display Custom Charts to your portal customers.
Shared Dashboards in the portal are available from the Account dropdown, under My Dashboards. Customers will be able to see any dashboards that have been made available to them, based on project or organization.
To display a Shared Dashboard in the portal, simply select ‘JSM Portal Users’ and the project where the dashboard should be shown, and it will display for customers of that project.
If you want to restrict further, you can configure the Shared Dashboard to only show for a certain organization, or even for just specific customers.
The best part is that you’re not exposing any data that customers can’t already see – when a Shared Dashboard is available to a user, they will see only:
Issues that they are assigned to
Issues that they are a request participant on
Issues with the organization that they are a part of (if selected in the gadget)
In this video, the is a detailed example of how to use the Shared Dashboard gadget to share an entire reporting dashboard to your Jira Service Management Portal.
Shared Dashboards is a fast evolving feature. So here’s a preview of what else is coming. Soon you’ll be able to:
Display dashboards to external users with public links (optionally restricted with an access code)
Create exports of full dashboards (not just a single chart at a time!)
Send Shared Dashboards via email, Slack, or Teams
And more!
For more information on how to use Shared Dashboards, check out our documentation or reach out to our support team.
Custom Charts for Jira
Build charts and dashboards to evaluate delivery, capacity, and speed for all teams with Jira's most flexible custom reporting app
Start a Free TrialA new gadget now comes with Custom Charts for Jira. Called Issue List, it’s similar to native Jira’s Filter Results, but better. Check it out.

Our Custom Charts/Assets for Jira integration lets you report on asset data on JSM dashboards, boosting the effectiveness of your ITSM team.
Want a deeper level of detail about your tickets on Jira dashboards? Appfire's Jira Misc Custom Fields and Tempo's Custom Charts are the answer.
Remote workers can get just as much benefit from a Jira wallboard as their office counterparts. And Custom Charts Shared Dashboards can help.

Custom Charts for Jira and Custom Jira Charts for Confluence now have the ability to display multiple calculations in a single chart.

A list of the best Jira Service Management charts to include in your ITSM dashboards for powerful and game-changing reporting.
Even the Empire needed better project visibility. Discover why custom Jira reporting beats standard dashboards for complex projects.

Custom Charts templates make it easier to onboard new teams to Jira and get them up and running with ready-made charts and dashboards.
Build a customizable interactive Jira Dashboard with Simple Search, directly in your Jira Dashboards.
















