How to do cross-project reporting in Jira
Tempo Team
In an ideal world, project managers could focus on one project at a time, devoting all their attention to running a single initiative perfectly. Unfortunately, that rarely happens. Project managers habitually oversee between three and 20 projects at a time. You can’t organize all that information using only your head.
Thankfully, you don’t have to rely on memory. Project reporting comes standard in Atlassian’s Jira project management system. The functionality organizes all incoming project data, analyzes it, and then deploys the information with real-time updates to your dashboard. The utility is excellent for individual projects, but what happens when you oversee more than one and need to see the bigger picture?
Jira software has you covered. Enable cross-Jira reporting to view and compare data on multiple projects simultaneously. The functionality is essential for agile teams working on numerous projects within a single portfolio. Looking at the whole story gives you vital information for monitoring resources, balancing priorities, and visualizing performance across your project group’s entire workload.
Sign up for a demo
Request DemoThe importance of cross-project reporting
A successful project relies on thousands of choices throughout its life cycle. These decisions don’t happen in a bubble. Every conclusion influences the ones that follow, affecting your team as well as other project groups. Given the wide-ranging implications, each decision must be informed and evidence-based.
Here are three areas where visibility through cross-project reporting within Jira software can best support teams and their organizations:
Strategic planning and prioritization
You must identify and communicate strategic priorities to take advantage of opportunities when they arise. Cross-reporting using Jira software provides the transparency your team needs to identify trends and patterns, ensuring you’re addressing competing priorities effectively and have the flexibility to adapt when concerns shift.
Resource optimization
Managing a portfolio of projects with limited resources is challenging. Jira’s dashboard allows you to monitor and compare resource usage across all your projects. If an issue arises, you can quickly identify slack and redeploy staff or assets to compensate. You can also ensure you’ve distributed responsibilities evenly among team members to avoid overwork and burnout.
Performance tracking and accountability
The various reporting types allow you to monitor your team’s productivity. See who’s responsible for what task and track their productivity and progress. Milestones are visible, so if anyone is at risk of missing a target, project management can step in to find the cause and offer support to get them back on track.
Improved team collaboration
Providing stakeholder access to Jira reports clarifies expectations and ensures everyone understands their responsibilities. Visibility and accountability help team members work together more effectively, enhance their problem-solving capabilities, and encourage innovation. Groups external to the project can assess workloads and see interdependencies, reducing friction caused by competing priorities.
Gain early access to Public Shared Dashboards and shape the future of external reporting in Custom Charts.
Request to Join the EAPTypes of cross-project reports
Jira supports the agile project management methodology. You can set up your reporting dashboard according to your preferred framework, Kanban or Scrum.
Kanban board: Kanban is used by teams who prefer a visual representation of their backlog. These teams don’t work iteratively. Instead, they track tasks by logging them as “To Do,” “In Progress,” and “Done” as work progresses.
Scrum board: Jira divides work into time frames for sprint teams and accommodates various roles, such as Scrum Master and Product Owner. The board allows teams to focus on backlogs and sprint planning. It also includes burndown chart functionality to highlight progress.
To set up a dashboard using your preferred framework, open an existing or new Jira dashboard, then download and install the Custom Charts gadget from the Atlassian Marketplace. For Confluence users, simply add the Custom Charts macro to your page. Next, select the chart type you want to use and enter its title. Next, select the “Source” dropdown, click “Projects,” and select which projects you wish to report on.
You’re now ready to generate some reports.
Cross-project status
Use the cross-project status report functionality when you’re managing:
A group of projects sharing the same organizational goals, known as a program
A portfolio of related or unrelated programs and projects
Projects with task dependencies completed as part of another initiative logged in or using an external tool like Azure DevOps, integrated with Jira
Choose the pie chart option from the “Chart Type” dropdown. It’s the best visualization choice, illustrating the percentages of each status category within the whole. Next, define the range of data in the “Source” field. To see a complete project, use the project selector. To view a specific data set, you can use a pre-existing refinement or create a custom Jira Query Language (JQL) filter directly in the “Source.”
If your team estimates its work, click the “Chart By” option and choose “Status Category.” This option lets you focus on high-level progress by dividing work into three standard classifications:
To Do
In progress
Done
These categories apply regardless of variances in status names between project groups.
If your team doesn’t use work estimates, you can use an issue count to track progress. If there’s diversity in the effort required to complete an issue, you can choose another statistic, such as time estimates or story points, to accurately view progress.
The final step is to title your chart so team members understand what it represents.
If you’re unsure which fields to track, adjust the legend to incorporate additional data. Add columns to the table (e.g., “Original Estimate,” “Remaining Estimate,” or “Time Spent”) to give you a fuller picture. You can illustrate the additional data using pie charts, funnel charts, and one-dimensional tables.
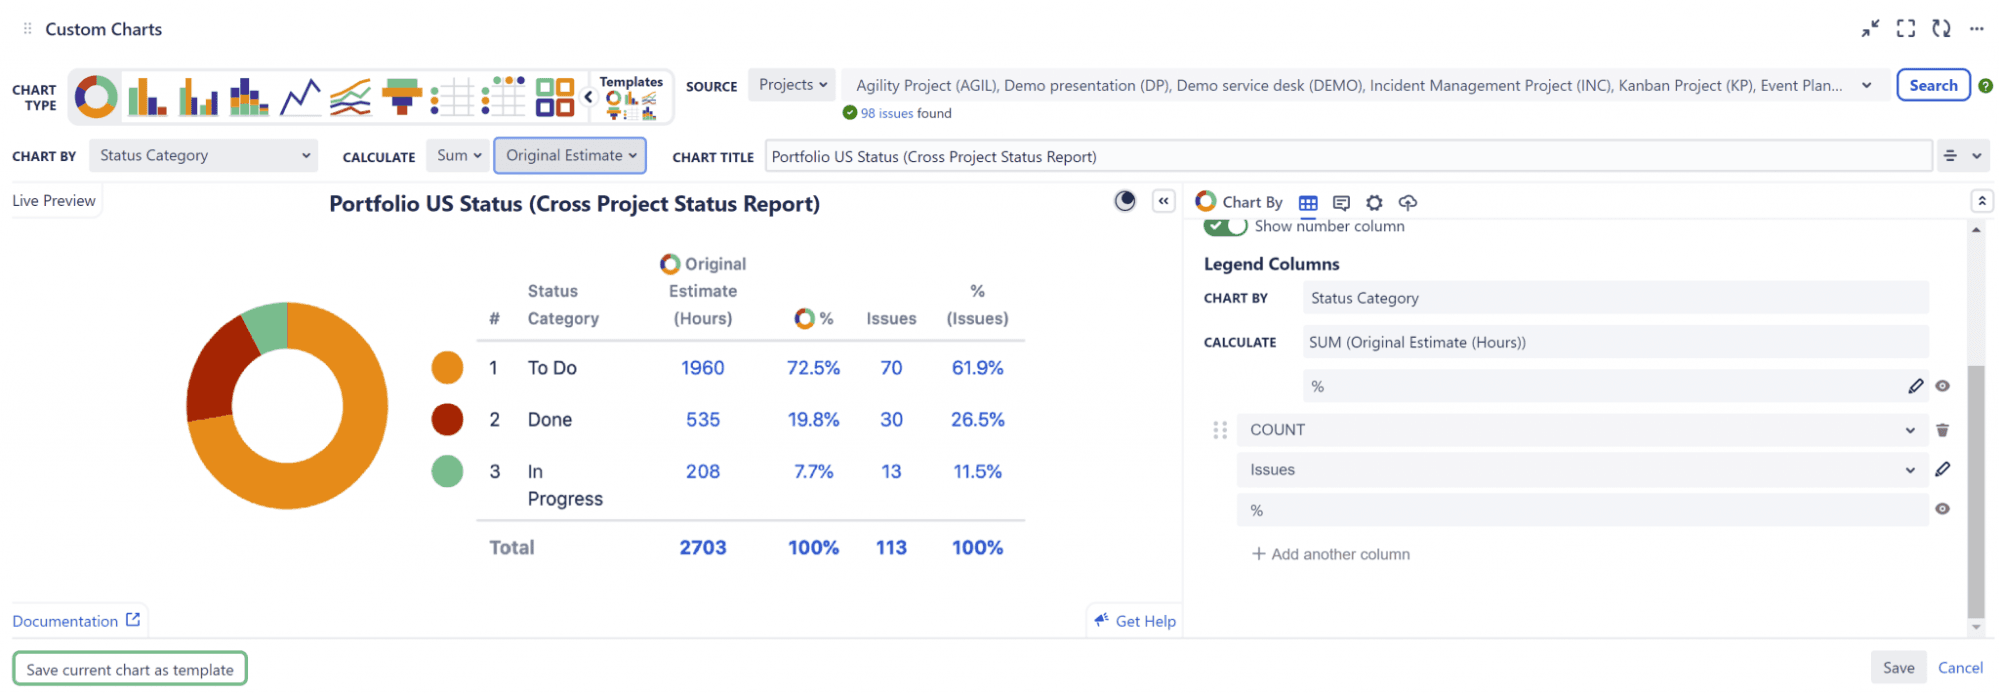
(Source: Old Street Solutions)
Once you’ve finished formatting the report, click “Save” to publish it to your desktop. You can see the detail by hovering over the pie chart segment or reviewing the data in the legend.
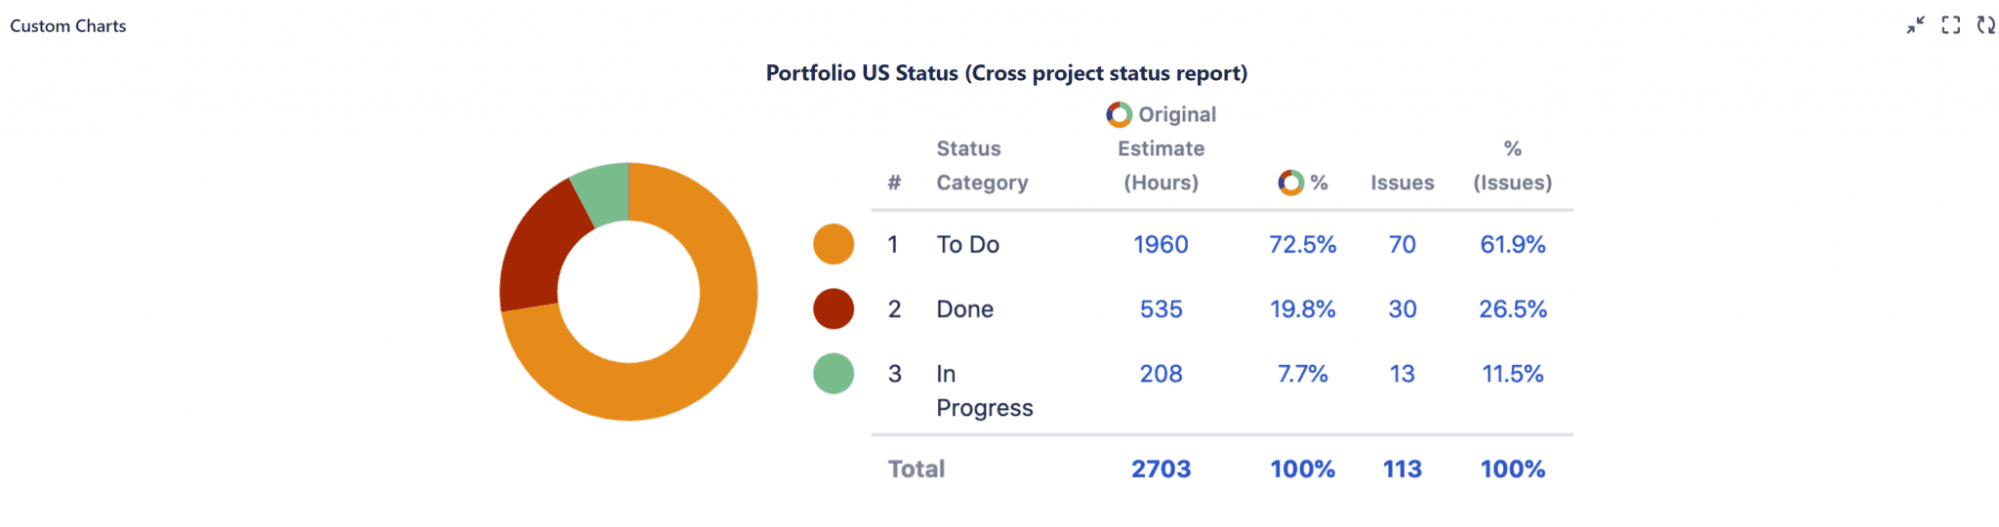
(Source: Old Street Solutions)
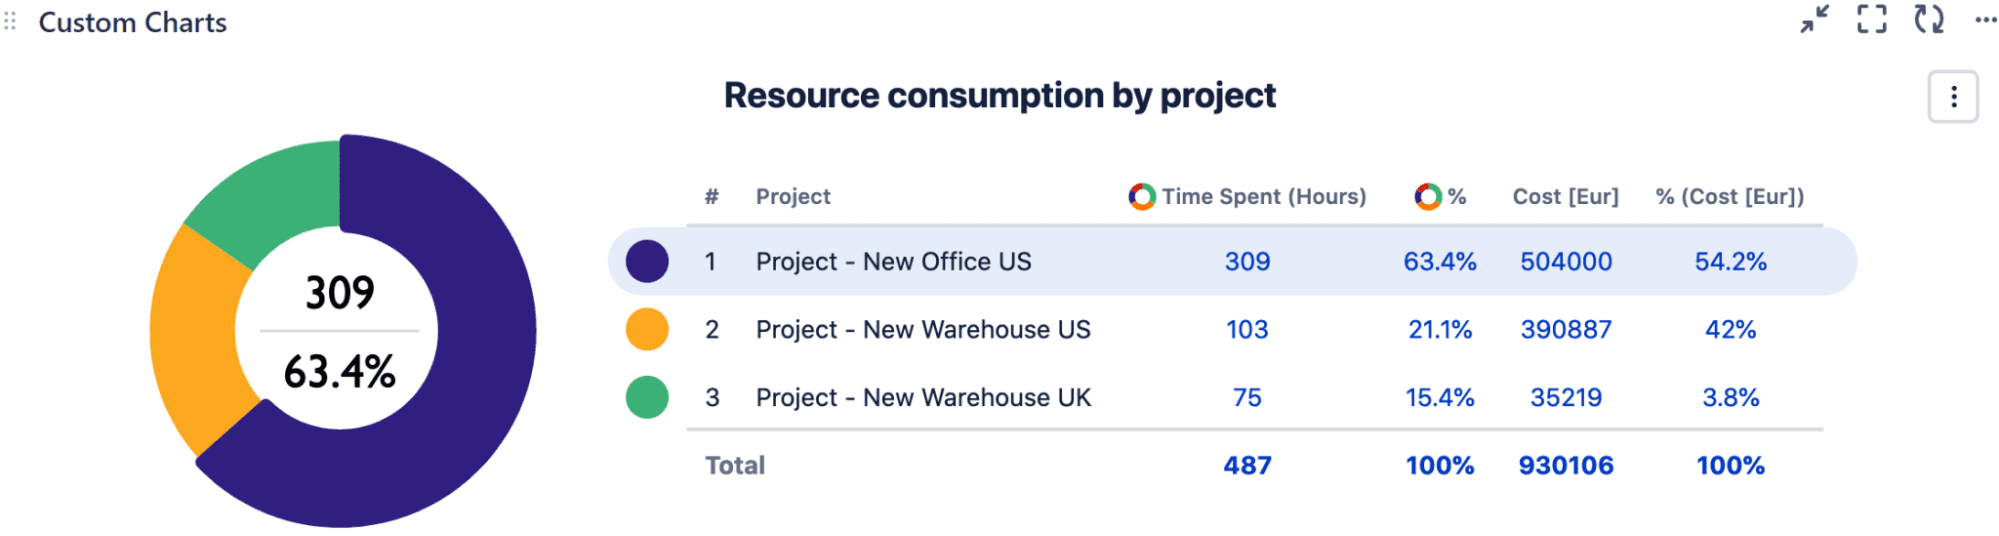
Resource consumption by project
Once you’ve dealt with your status reports, you’ll want to set up staffing, budget, and resource tracking. Select “Time Spent” in the “Chart by” dropdown to view the time and money your team has spent. Once again, the pie chart is your best visualization option.
In the project selector, select the projects you’ve completed, or select ongoing projects if you want real-time resource monitoring. Next, customize the legend to include the data relevant to the report by clicking the “Sum” and “Time Spent” options.
In our example, each work item has a cost estimate, so add that to the legend and include the “Cost” field before choosing your legend configuration (the grid icon). Finally, click “Save” to publish.
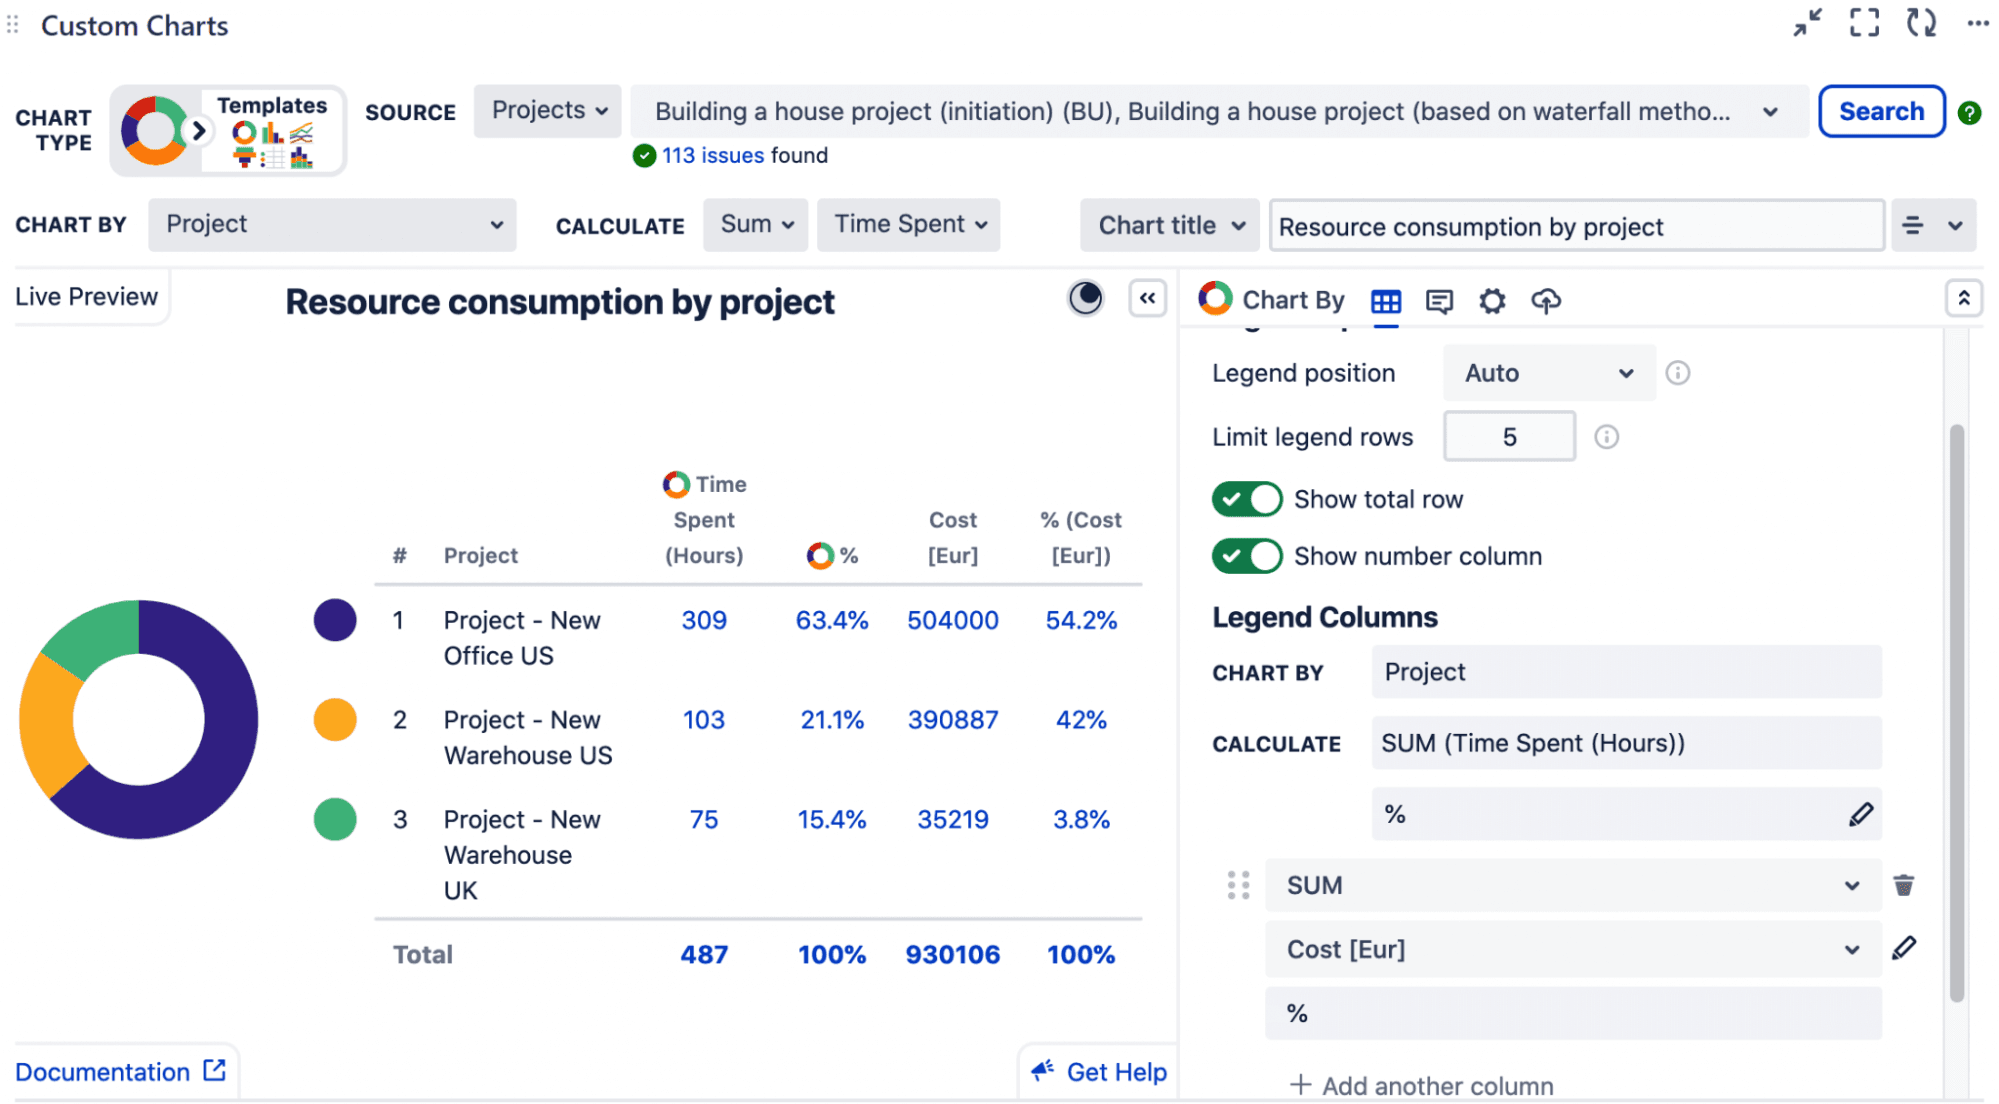
(Source: Old Street Solutions)
(Source: Old Street Solutions)
Cross-project risk
A risk is defined as anything that can negatively affect the outcome of a project. Risks fall into one of several categories:
Stakeholder
Regulatory
Technological
External
Execution
It’s your job as a project manager to identify risks, understand them, and prepare a response. Many risk management options are available: risk registers, assessment matrices, and SWOT analysis, for example. Once you complete the evaluation, it’s time to add it to your Jira report dashboard.
First, if risk is missing from Jira reports, seek admin permission to create a dedicated field. Once the admin grants permission, create the field based on your evaluation technique. If using an assessment matrix, you can categorize risks into low, medium, and high impact.
In the Jira settings dropdown, select “Issues” and click “Custom Fields.” Create the new field, then pick “Select List” and label it “Risk Level.” Add the risk levels from your matrix and consider including an “Extreme” label for risks that require immediate attention. Associate the field with the appropriate screens.
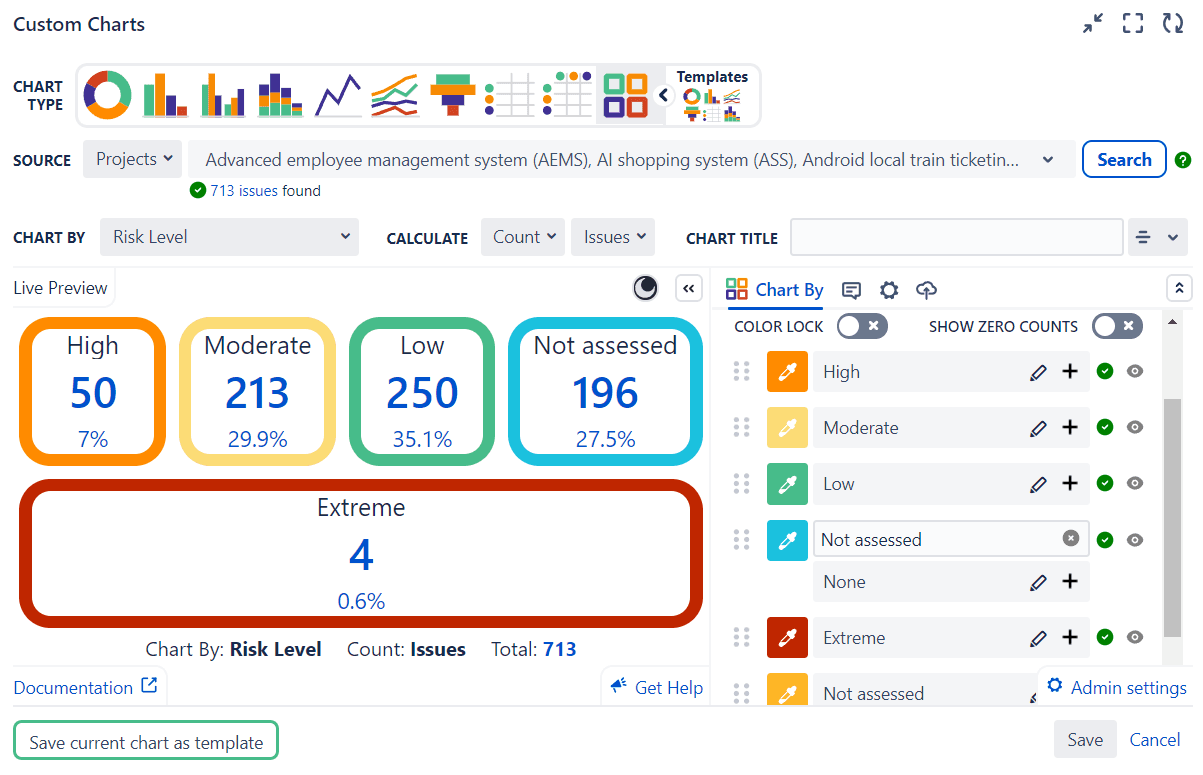
Next, enter “Custom Charts” and select your preferred chart type. The tile chart is a good option because it clearly displays which risks require attention. Choose the relevant projects, then select the newly created “Risk Level” field.
Ensure the “Calculate” dropdowns include the number of issues and adjust the color values to highlight “Extreme” in red and “Low” in light green.
(Source: Old Street Solutions)
To view the Jira issues contained in each risk level, click on the category for a full accounting.
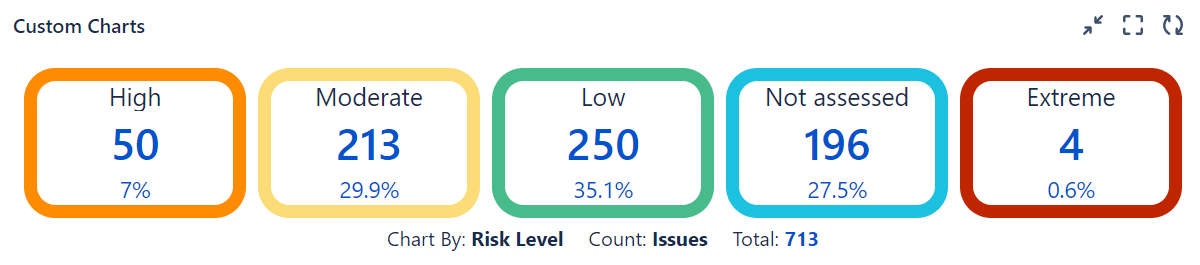
(Source: Old Street Solutions)
Common cross-project Jira reporting issues
Cross-reporting using Jira isn’t without its challenges. Here are a few issues to watch out for and ways to solve them:
Overcomplicating the board
It’s tempting when you first start to cram your cross-reporting dashboard full of information. However, too much data can make it overwhelming and difficult for users to navigate. Instead, keep your board as simple as possible.
Losing project identity
When you include multiple projects on the same board, the details can bleed together, making it hard to differentiate between them. Help individual projects stand out using consistent labeling, color-coding, or swimlanes to maintain integrity and identification.
Inconsistent data across projects
Different project managers have individual workflows and reporting requirements they use to track their projects. Once you merge their work into one cross-project board, it can lead to confusion.
At the start of cross-project reporting, sit down with other project managers to standardize reporting data and deliver a consistent view of work status and progress.
Overwhelming with detail
You don’t need to add every sub-task to your project dashboard. Weeding through all that information to generate status reports will become time-consuming and counterproductive.
Instead, take time regularly to groom and prioritize the backlog. If that doesn’t produce the desired results, implement Work in Progress (WIP) limits to keep things under control.
Notification overload
If the Jira service management constantly bombards team members with irrelevant notifications, they will quickly become annoyed and ignore them, resulting in groups missing out on vital information. Take advantage of customizable notifications to ensure team members receive only those updates relevant to their roles and project responsibilities.
How Tempo can help in cross-project Jira reporting
Successful cross-project reporting depends on the accuracy of your data. Ensure you’ve included all essential tasks by roadmapping your project using Tempo Strategic Roadmaps. Roadmaps is an idea management platform that allows working groups to visualize the project plan, helping to assess priorities and identify dependencies for effortless execution.
Combine Strategic Roadmaps with Tempo Timesheets to monitor asset usage and staff hours, letting you stay on top of resource management. Together, Timesheets and Roadmaps create an unbeatable project management team to ensure the success of projects on your strategic plan.