

Custom Charts dashboards are now more shareable to anyone – in JSM portal or internally like a wallboard.

Traditionally, wallboards are an office thing. Aka big visual charts (BVCs) and information radiators, they display key team and project status information on the office wall. Team members get updates on what’s happening as they pass or wait for the kettle to boil, or better yet, when they look up from their desks.
In the old days, these wallboards were printed displays or even hand-drawn ones. Nowadays they’re one of the many screens that dominate our lives (sorry, went a bit Black Mirror on you then). Big wall-mounted TVs or monitors show continuously and automatically updated graphs and charts to everybody in the office. In Jira you can turn many dashboards into a wallboard simply by choosing your dashboard from the sidebar and clicking ••• > View as wallboard.
Course, it’s 2021. And, well, the office is not what it used to be. Has the past couple of years done to the wallboard what that asteroid did to the dinosaurs? Actually, no. Because remote workers are using them at home too.
Remote working has a ton of benefits over working in an office. As a remote worker in a globally distributed team, I treasure the extra time I get to spend in my bed, not to mention being able to avoid the biggest and most unnecessary waste of time in modern civilization: the traffic jam.
But remote and distributed teams face a key challenge: shared understanding of status and progress. Sure, there are tools for video conferencing, instant messaging, and document collaboration enabling remote teams to work together more easily. These tools have improved massively in the post-2020 landscape, so much so that many companies are keeping their staff remote. But these tools don’t help with keeping everyone continuously updated on how projects and sprints are progressing, and which team members are doing what. In the office, this is done with wallboards. But what’s the equivalent for the home worker who probably doesn’t have the luxury of a TV on the wall?
Well, you may not have a screen on the wall but most people these days have more than one screen on their desks, particularly if you work in IT or software development. Our Custom Charts evangelist Tom Harris has four! There is nothing a tech person loves more than extra monitors, so what if one of those was dedicated to displaying your wallboard? I guess we’d have to start calling them deskboards…
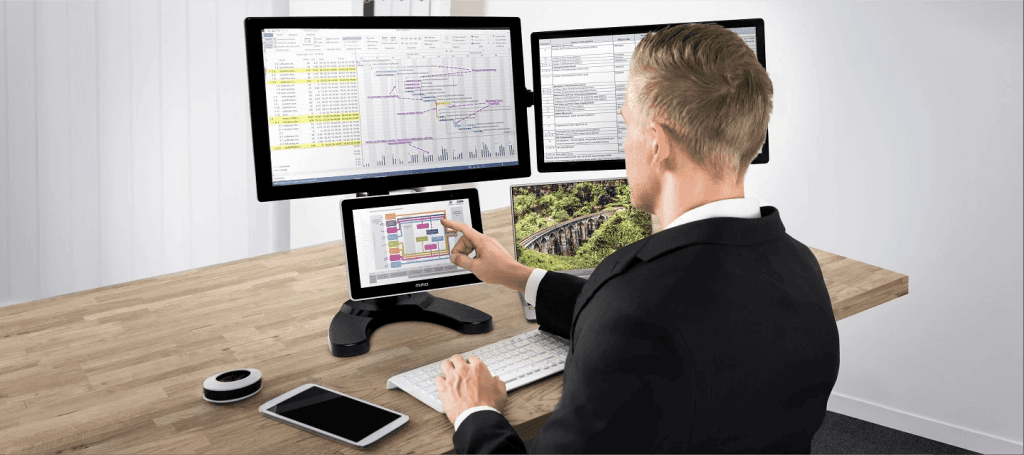
If you have lots of screens, why not make one a wallboard?
Dashboards give an at-a-glance view of what’s going on across projects, teams, and releases. Jira dashboards are composed of gadgets which display live statistics related to projects, users, and versions, expressed graphically as line graphs, pie charts, bar charts, and tables.
With an app like Custom Charts for Jira, you can replace many of your native gadgets with more customizable versions and have loads more options for colors, calculations, chart types, searching, labels, adding descriptions etc. With Custom Charts you can also have native gadgets side by side with Custom Charts gadgets on the same dashboard.
So, dashboards in Jira are the thing you need to keep your team in the loop as to what’s going on in the rest of the organization. This is why, if you’re working in the office, a specific Jira dashboard will likely be created for display as a wallboard. If you’re working from home, you could dedicate one of your monitors to a Jira dashboard and turn it into a full-screen wallboard so that it displays as it would on the big TV in the office.
You can do the same thing with our Shared Dashboards feature, i.e. create a wallboard-like view of your Custom Charts dashboard that is full-screen and entirely in dark mode if you wish. This is what Tom has done. One of his many monitors shows only his Custom Charts dashboard, so that beautiful charts and graphs “radiate” their data while he works.
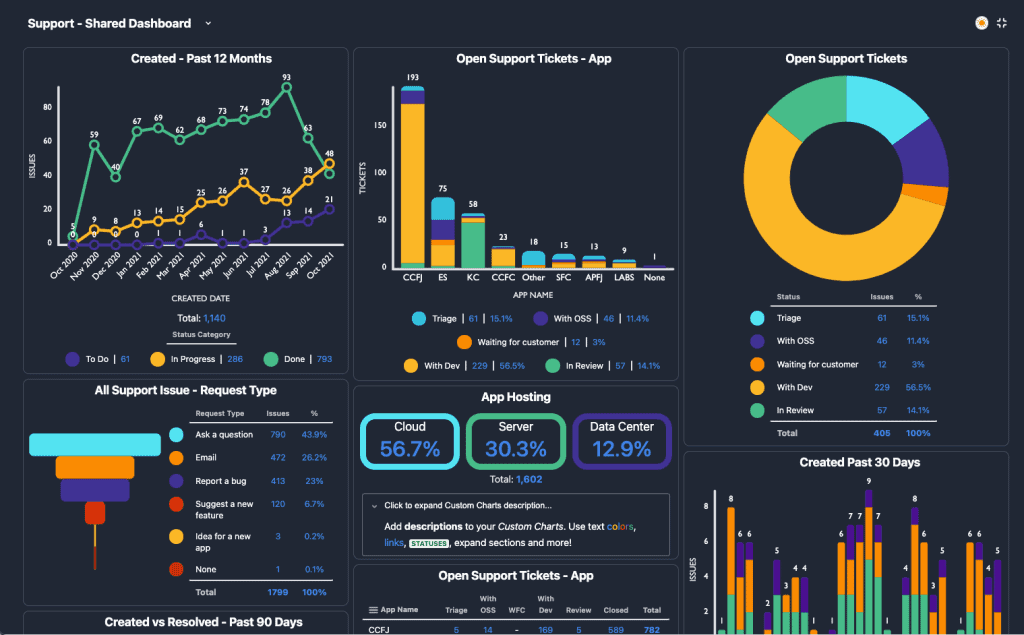
Custom Charts Shared Dashboard – stick this on one of your monitors and it’ll function just like a wallboard
With Shared Dashboards, whether you’re at home or in the office, you can project your Custom Charts dashboard onto a screen of your choice, on the wall or on your desk. It brings another perk of traditional co-located arrangements to the home worker, making the benefits of one or the other ever more blurry.
Sign up for a demo
Request Demo
Custom Charts for Jira
Build charts and dashboards to evaluate delivery, capacity, and speed for all teams with Jira's most flexible custom reporting app
Start a Free TrialCustom Charts dashboards are now more shareable to anyone – in JSM portal or internally like a wallboard.

Custom Charts for Jira and Custom Jira Charts for Confluence now have the ability to display multiple calculations in a single chart.

We look at EazyBI's strengths and weaknesses and explain why Custom Charts for Jira is the superior reporting app for Jira dashboards.

So you know what an information radiator is, how it boosts Scrum team transparency and productivity, and how to create one in Jira.
We reveal why you just don't want or need a dedicated Jira time in status app to find bottlenecks. You want something like Custom Charts.
Want a deeper level of detail about your tickets on Jira dashboards? Appfire's Jira Misc Custom Fields and Tempo's Custom Charts are the answer.
Even the Empire needed better project visibility. Discover why custom Jira reporting beats standard dashboards for complex projects.

Synergy Learning approached New Verve for a solution that could display information from BambooHR in Jira, and needed the app to integrate with Tempo.
Jira uses three top add-ons for calculations and scripting are: ScriptRunner for Jira Jira Misc Custom Fields (JMCF) and Power Scripts for Jira.



















