

Learn how to create compelling visual project timeline roadmaps that outline milestones, track dependencies, and keep your team aligned.
Visualize your project timeline with Confluence Gantt charts. Learn how to create, manage, and optimize them for better collaboration and project tracking.

A Confluence Gantt chart is a horizontal timeline embedded in a Confluence page that shows every task in a project, when it starts, when it ends, and how it depends on the work around it. Because the chart lives inside the same wiki where teams already document scope, decisions, and status, everyone reads the same plan without hopping between tools.
This guide walks through what a Gantt chart is, how to build one in Confluence, and how to extend it with Jira when you need live task data behind the bars.
A Gantt chart is a bar chart that maps tasks against time. Henry Gantt developed it in the early 1900s to make project schedules visual instead of tabular.
The timeline runs horizontally across the top. Tasks stack vertically down the left, and each bar’s length reflects the duration of that task. Sequential bars show dependencies, and vertical markers flag milestones like a completed design phase or a finalized prototype.
Project managers use Gantt charts to break work into phases, assign start and finish dates, and update progress as tasks complete. The chart doubles as a status report: A glance shows what is on track and what is slipping.
The format also exposes the sequence of activities so teams can track dependencies. That visibility prevents bottlenecks and gives leadership a clear place to revise the schedule when delays hit.
Gantt charts improve timeline visibility and resource allocation. Managers use the layout to spot periods of intense activity and reassign workload before overload hits.
The chart also drives accountability. Every team member’s contribution sits on one timeline, so delays and their downstream impact are visible to the whole team. That shared view pushes teams to solve problems together instead of routing them through management.
Ready to map out the timeline for your next project? These steps will show you how to build your own Gantt chart.
Outline the scope first. Identify every activity required to meet the project’s goals, then split each activity into smaller, manageable tasks. This clarifies what has to get done and gives the timeline a foundation.
Estimate the time each task will take using historical data or team input. Then identify the relationships between tasks: Which activities have to finish before others can start.
Confluence offers macros like Team Calendars and Roadmap that render timeline views. Enter your tasks into a table or calendar with start and end dates. The macro arranges the tasks along a horizontal timeline so the whole project becomes visible at once.
Mark significant points on the chart, such as the completion of a design draft or the start of testing. Once tasks, durations, dependencies, and milestones are in place, review the chart with your team and adjust.
With help from Tempo, you can create dynamic Gantt charts in Jira that stay in sync with your issue data.
Jira has no built-in Gantt view, so you need an add-on. Install an extension such as Tempo’s Gantt Charts for Structure PPM from the Atlassian Marketplace. The tool converts your Jira issue data into a visual timeline.
Once installed, define the project structure by setting start and end dates on each task. Establish dependencies using Jira’s issue-linking or the dependency system in your Gantt tool.
The chart reflects changes as team members update task statuses in Jira. No manual redraw, no stale timeline.
The visual layout sharpens team communication. Team members see exactly how their tasks fit into the timeline and who they hand off to next.
Hosting the chart in Confluence gives every team member the same source of truth. A few payoffs stand out.
Confluence keeps the timeline in one up-to-date place. Real-time access to a central Gantt chart eliminates the “which version is current” problem.
A shared reference makes cross-team discussions precise and cuts the need for status meetings between departments.
A Gantt chart hosted in Confluence reflects schedule changes without extra work. Team members check progress in seconds instead of digging through docs.
A visible timeline creates ownership. When assignments and expected completion dates sit in a public document, team members treat their commitments as commitments.
Organizations across many industries use Gantt charts in Confluence to run projects. Use these examples as a starting point.
Software teams map each phase of a release along a visual timeline, then use the chart to spot critical dependencies and monitor milestone completion.
Marketing teams plan campaign phases end to end, from strategy and content creation through launch and post-campaign analysis. A single timeline with clear deadlines coordinates overlapping activities.
Cross-functional projects need a shared view. A Confluence-hosted Gantt chart lets each department update their tasks directly, so contributions from different teams line up in one plan.
A few practices make Gantt charts in Confluence dramatically more useful.
Set realistic task timelines: Estimate durations against past performance and available capacity. Overly ambitious deadlines burn morale and blow up the plan.
Regularly update task progress: Refresh task statuses often. Ongoing updates cut surprises and support timely course correction.
Use color-coding for task categories: Apply distinct colors for different task types or project phases so team members can distinguish activities at a glance.
Break down large tasks into smaller, manageable items: Divide complex tasks into subtasks to assign responsibility and surface issues earlier.
Define dependencies between tasks: Specify which tasks rely on the completion of others. Explicit links let teams manage sequencing and adjust when delays occur.
Schedule regular team reviews: Review progress on a set cadence and reassign priorities when needed.
Tempo’s Gantt chart tools make chart creation and management in Confluence straightforward, so your team can visualize tasks and deadlines without wrestling with the format. Real-time task tracking surfaces delays fast, and clear reporting keeps stakeholders informed. The result is tighter team alignment, smoother resource management, and better project outcomes.
Ready to take control of your projects? Check out Tempo’s Strategic Roadmaps, Custom Charts for Jira, Timesheets, and Structure PPM to strengthen your Jira and Confluence project management.
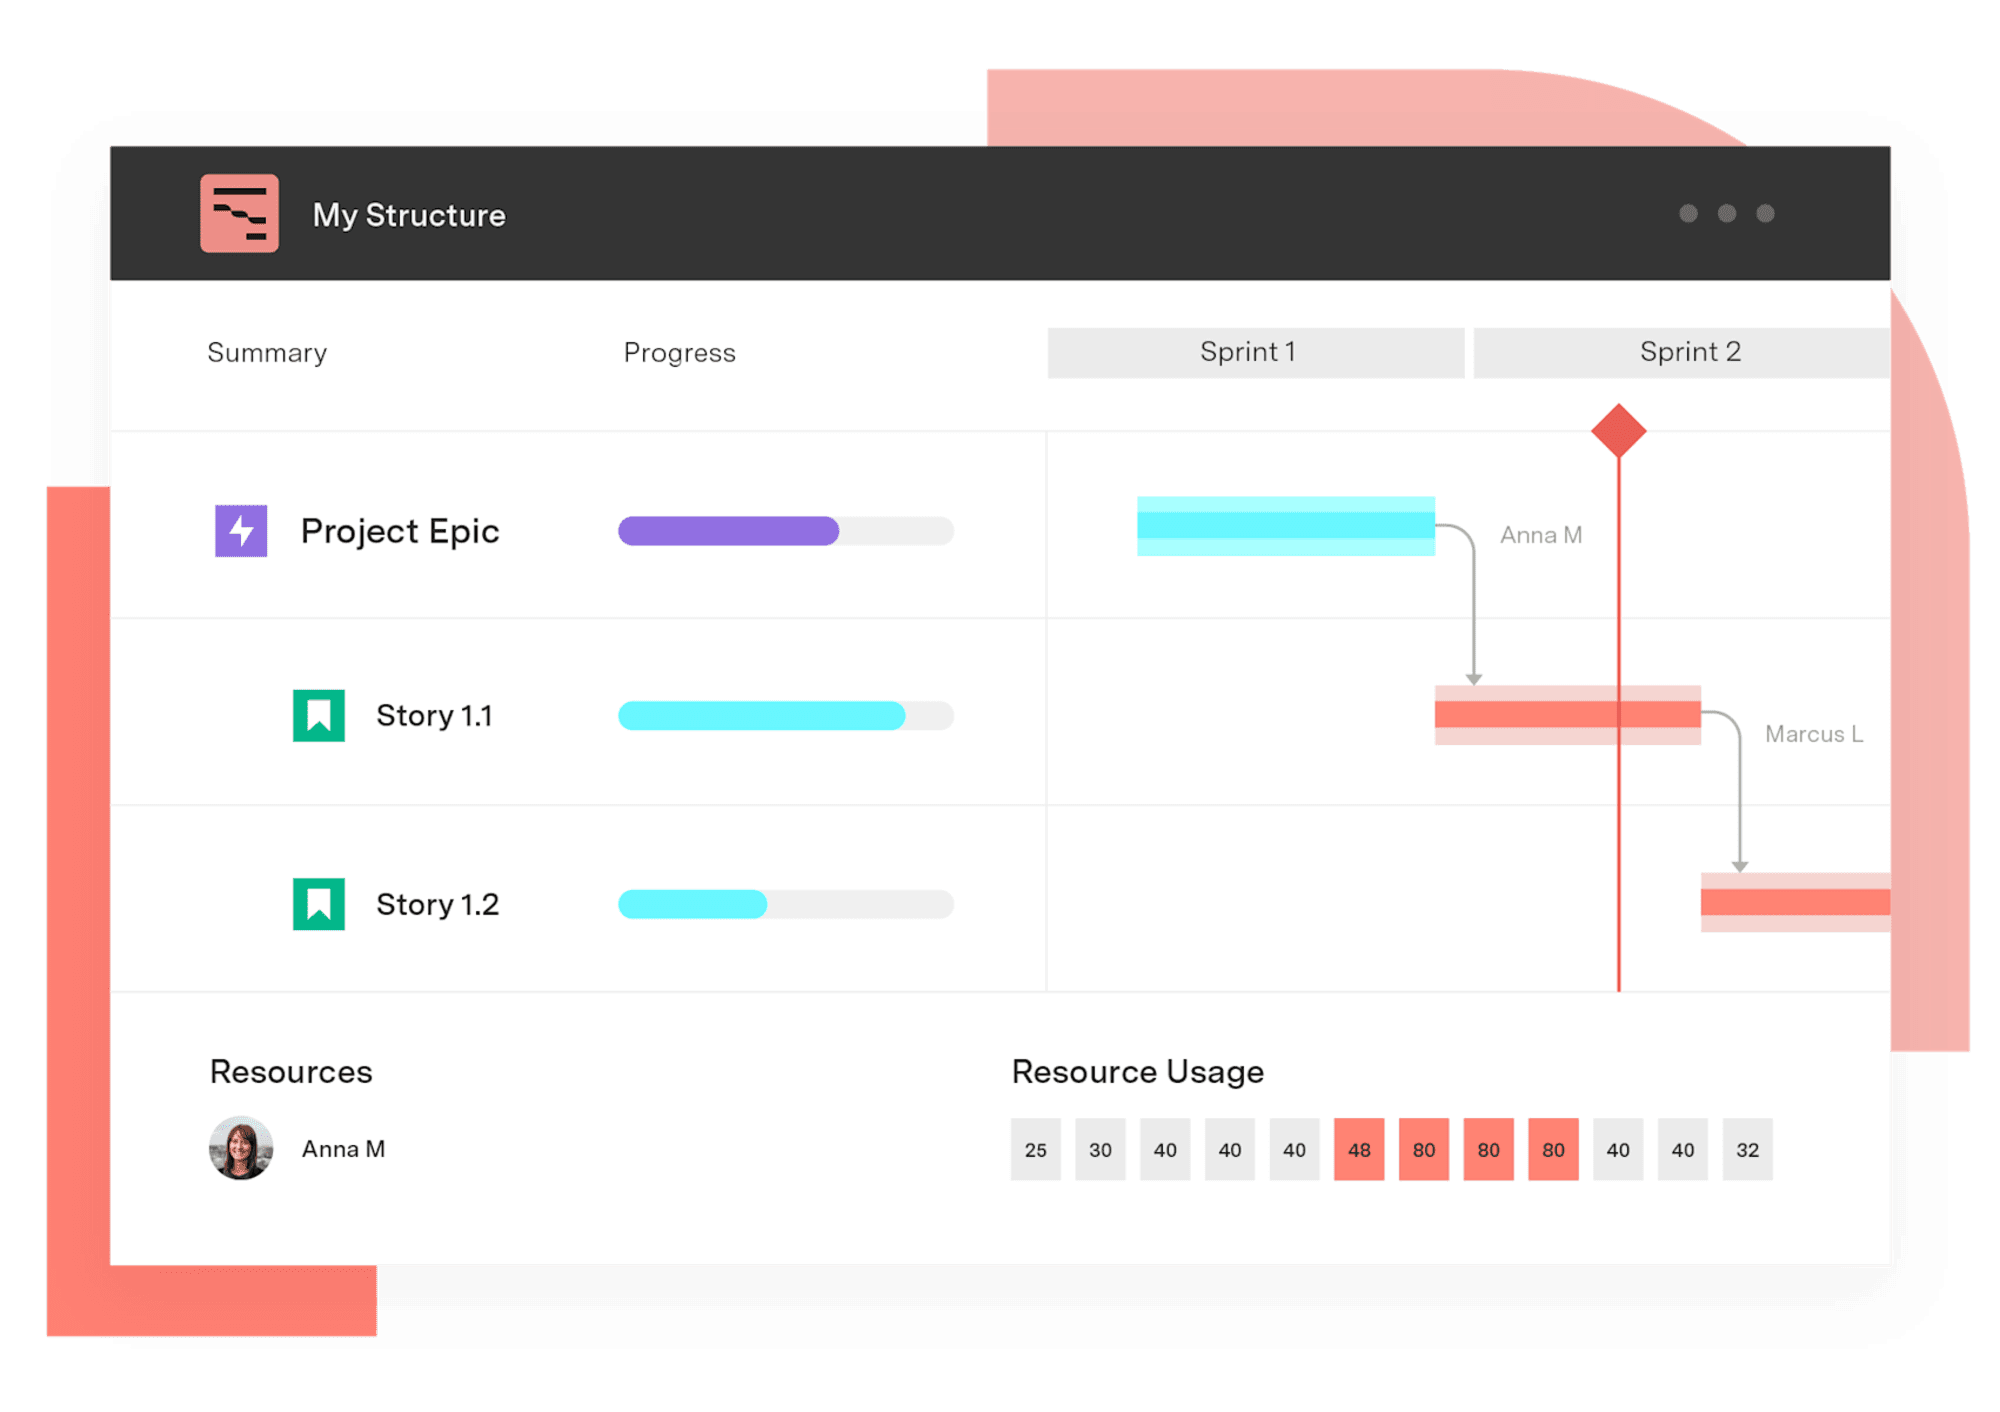
Gantt Charts for Structure PPM
Get visualization options for portfolio scheduling, quarterly planning work, capacity visualization, project retros, complex waterfall infrastructure projects, and more.
Start a Free TrialCouldn't find what you need?Go to our documentation
You can integrate Gantt charts using add-ons and plugins available for Confluence. Once the proper add-on is installed, its built-in macros will allow you to insert Gantt charts directly into your Confluence pages. From there, you can input tasks and manage dependencies.
Adjust task dependencies using Gantt chart add-ons for Confluence. Most tools let you drag and drop tasks to update links, ensuring the chart stays accurate as project timelines shift.
Gantt charts are usually used for sequential planning, but many teams make them work for agile projects by updating them often and tracking progress in smaller increments.
A Gantt chart provides detailed information about task durations and dependencies, whereas a timeline highlights key events without detailing task relationships.
Learn how to create compelling visual project timeline roadmaps that outline milestones, track dependencies, and keep your team aligned.

Learn the basics of project scheduling and help your team manage time, establish priorities, and visualize workflows without becoming overwhelmed.

Learn how project tracking in your management process can help effectively monitor timelines and deliverables, improve collaboration, and reduce risk.
Unlock the potential of burndown charts and learn how this powerful tool can help you visualize your project’s path from kick-off to delivery.

Gantt Charts for Structure PPM slice-based configurations allow you to create custom rules for specific sets of issues.

Learn what project milestones are, why they matter, and how to create them to improve planning, visibility, and delivery.
Without a project timeline, you risk missed items, delays, and misunderstandings. Learn how to keep your project on track to achieve team goals.

Learn to create a project baseline to track progress, manage scope, and control costs for successful project management.
Stay on track and hit every deadline with milestone tracking. Learn how to monitor and optimize project milestones for seamless execution with Tempo.





















