

Not every delayed dependency is a program risk. Learn the 4 conditions that trigger escalation, and spot exposure before it reaches leadership.
Pull dependencies out of individual issues and onto a chart where program risk is visible at a glance.

Dependencies are the connective tissue of every program, and when they hide inside Jira issues no one is looking at, they break delivery quietly. Missed deadlines rarely come from a lack of effort — they come from waiting on another team, a vendor, a decision, or a piece of code that wasn't ready. Tracking dependencies in Jira surfaces those connections so program managers can see what's at risk before a sprint review tells them.
Jira dependency tracking is the practice of identifying, visualizing, and managing the relationships between Jira issues that block, gate, or unblock each other. In native Jira, dependencies live as issue links — a "blocks" or "is blocked by" relationship buried inside an issue. That's enough for one team but breaks down at the portfolio level, where a single delayed dependency can ripple through dozens of downstream issues across multiple teams.
Effective tracking lifts those relationships out of individual issues and onto a visual chart, so a project manager can see the chain at a glance, spot circular or risky links, and run "what if this slips" conversations before the slip happens.
See risk before it becomes a delay. Visualizing dependencies surfaces the chains where one slip cascades into many.
Resolve cross-team blockers faster. When dependencies between teams are visible, the team that needs unblocking knows exactly who to talk to.
Plan with sequencing in mind. Project plans built on visible dependencies are realistic; plans built on invisible ones are wishful.
Reduce status-meeting churn. A dependency view answers "what's blocked and why" without asking every team lead in turn.
Start by capturing dependencies as Jira issue links — the same "blocks" and "is blocked by" relationships teams already use. The work is making sure they're maintained: Every cross-team handoff, vendor deliverable, or sequential gate should show up as an explicit link, not as a verbal agreement in a stand-up.
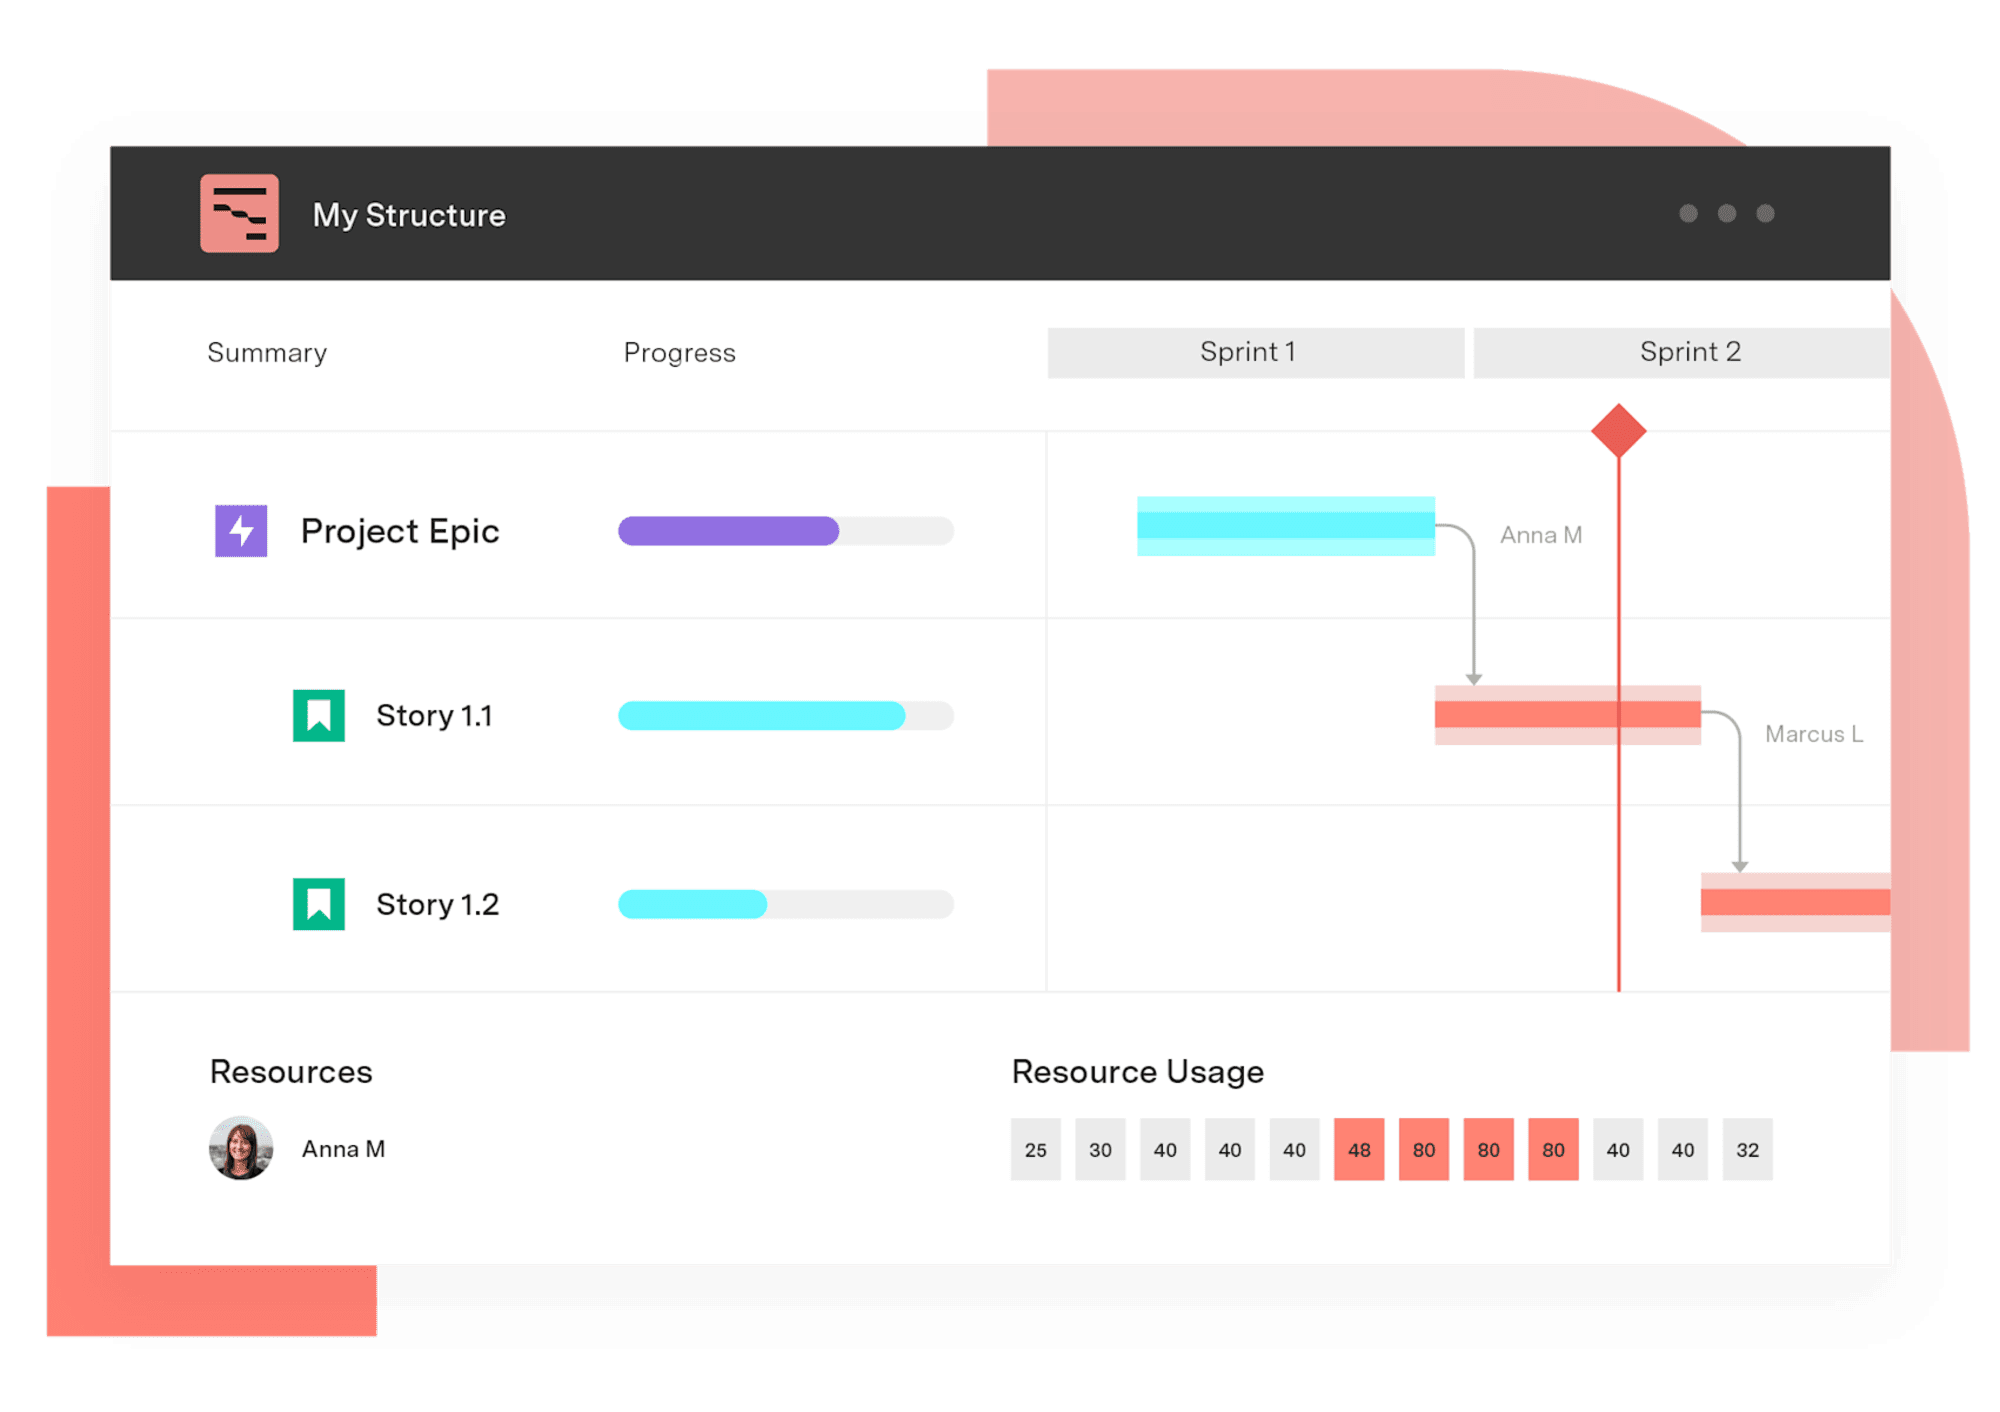
From there, layer a visual dependency view over the issue links. A Gantt-style view shows the chain in time, so a program manager can see not just that A blocks B, but that A is scheduled to land two weeks after B's start date — the kind of mismatch that's invisible in a list but obvious on a chart. Use that view in planning, weekly reviews, and risk conversations, and update it as work moves through Jira.
Gantt Charts for Structure PPM is the most flexible Gantt chart solution for Jira and a strong fit for organizations where dependencies sprawl across teams, projects, and methodologies. Because Gantt Charts builds on Structure hierarchies, teams can group dependent work however it actually moves — by portfolio, program, release, or cross-team initiative — and visualize the chain at any level of that hierarchy.
Dependencies in Gantt Charts are interactive. Teams use drag-and-drop to create or modify links between issues directly on the chart, instead of editing one issue at a time. The chart also surfaces dependencies between stories on agile boards, which is one of the harder problems for Jira-only teams — issues that aren't visibly connected on a sprint board can still block each other across teams.
For Data Center customers, Resource Leveling adds another layer: When dependencies and resource constraints conflict, the system can suggest schedule adjustments that respect both. Sandbox Mode (Data Center only) lets teams model changes — moving a milestone, breaking a chain, re-sequencing a release — before applying them to the live plan. Baselines (available on Cloud and Data Center) capture the original dependency map, so teams can review what changed and why.
Cross-team API handoff. A frontend team's epic depends on a backend team's API. Without a dependency view, the frontend team discovers the API isn't ready in their sprint planning. With Gantt Charts, the link is visible weeks earlier, and the frontend lead can negotiate scope or sequencing before either team commits.
Compliance gate before release. A regulated product release depends on a security review, which depends on a feature-complete build. The Gantt view shows the gating chain in time, so engineering knows exactly when the build needs to be ready for security to start, and security knows when their work feeds the release.
Vendor-blocked initiative. A platform initiative depends on an external vendor delivery. The dependency lives as a Jira issue with a target date. On a Gantt view, the vendor delivery is visible alongside the internal work that follows it, so when the vendor slips, the program manager can move downstream work proactively rather than scrambling.
Gantt Charts for Structure PPM
Get visualization options for portfolio scheduling, quarterly planning work, capacity visualization, project retros, complex waterfall infrastructure projects, and more.
Start a Free TrialCouldn't find what you need?Go to our documentation
Native Jira issue links capture the relationship but hide it inside individual issues. Gantt Charts for Structure PPM visualizes those links across the timeline, so dependency chains and the schedule risk inside them are visible at a glance instead of one issue at a time.
Yes. Gantt Charts supports drag-and-drop dependencies, so users can add, remove, or reroute links between issues without opening each one individually.
Because the chart works across the full Structure hierarchy, a dependency between a story in next sprint and a milestone three months out is visible in the same view – useful for hybrid programs where sprint work feeds longer plans.
The dependency view makes the downstream impact visible immediately. On Data Center, Sandbox Mode lets teams model the consequences of a slip before changing the live plan, and Resource Leveling helps reconcile dependency conflicts with resource constraints.
Not every delayed dependency is a program risk. Learn the 4 conditions that trigger escalation, and spot exposure before it reaches leadership.

Surface schedules, dependencies, and project status on a Jira dashboard with the Gantt Charts for Structure PPM gadget.

See how Structure PPM brings overdue task tracking into Jira with real-time reporting, dashboards, and portfolio rollups built for delivery teams.
Plan sprints inside a longer schedule. Connect agile execution to portfolio delivery dates with Gantt Charts for Structure PPM.

Yes, Jira works for waterfall. Learn how to configure native workflows, Advanced Roadmaps, and Gantt Charts to run sequential or hybrid projects.
Visualize your project with Confluence Gantt charts. Learn how to create, manage, and optimize them for better collaboration & project tracking

Tempo's Structure PPM, Gantt Charts, and Timesheets close the gap between strategy and shipped outcomes at portfolio scale.

Gantt Charts for Structure PPM slice-based configurations allow you to create custom rules for specific sets of issues.

Create and present boardroom-ready roadmaps – Align your whole organization with crystal-clear product roadmaps.



















