Gantt chart vs. roadmap chart: Key differences explained
Project managers and product managers can access numerous time- and labor-saving applications. Some of these implements serve similar purposes; selecting the right project management tool requires understanding the outcomes each delivers.
Gantt charts and roadmap charts are two applications that seem similar on the surface but yield very different results. Both allow teams to visualize project timelines and dependencies, supporting project management, resource allocation, and communication, but that’s where the similarities end.
We’ll explain the differences between Gantt charts and project roadmaps to help you recognize when and how to use each tool effectively.
Are Gantt charts and roadmaps the same?
Although they fulfill similar project management roles – illustrating information related to the completion of a long-term project – Gantt charts and roadmaps differ in scope and focus.
Gantt charts are more practical. They support project planning by detailing the steps to deliver an initiative’s outcomes. Project or product roadmaps take a strategic view, illustrating the reasoning behind an undertaking and linking it back to the company’s big-picture goals and objectives.
What is a Gantt chart?
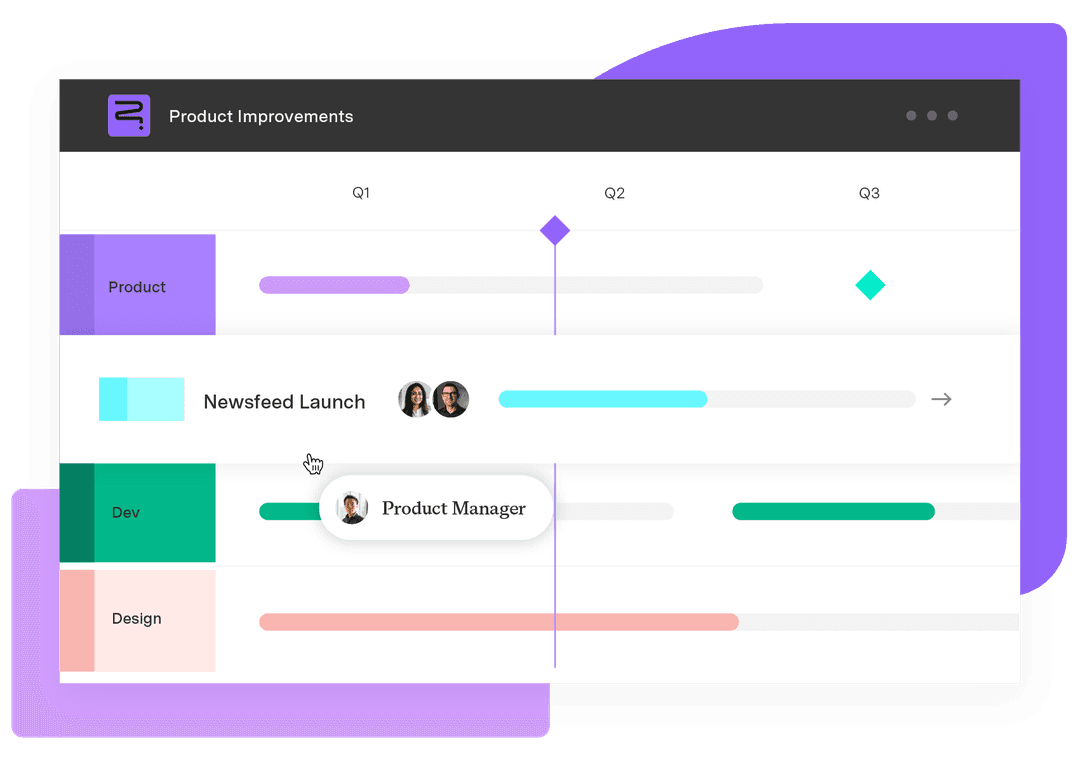
A Gantt chart represents project tasks as stacked bars positioned along a horizontal time axis. The length of each bar illustrates the expected duration of the associated activity. The diagram helps cross-functional teams visualize the linear progression of a project’s tasks and dependencies. It also establishes the order of completion before the working group proceeds to the next development phase.
Gantt charts are used in various industries, including the following:
IT project management
Web design
Marketing
Construction
Education
Healthcare
Business planning
Event planning
Retail
Consulting
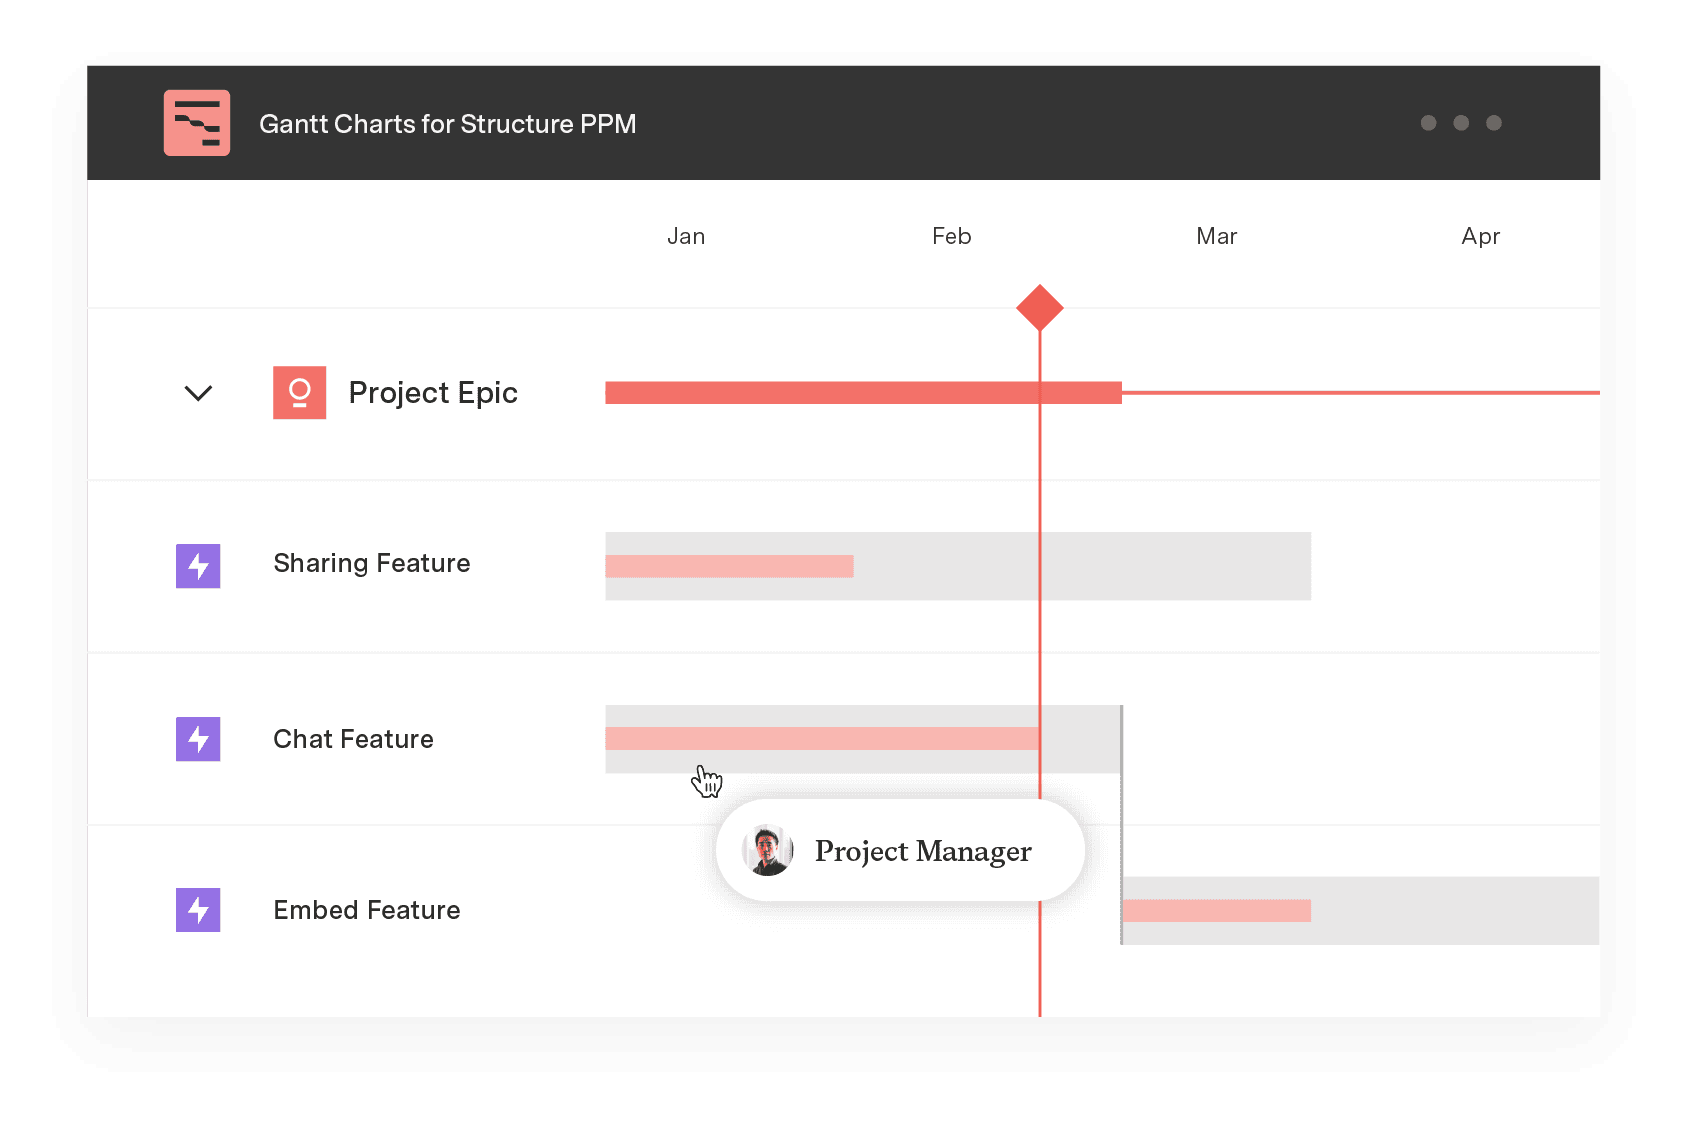
A Gantt chart comprises two perpendicular axes. The horizontal x-axis represents time units or dates, and the vertical y-axis contains a list of task categories, such as planning, design, or implementation.
The team subdivides each category into individual tasks or subtasks, represented by rectangles. Each rectangle is positioned above its start date and stretched horizontally according to the required time units for completion. The endpoint of each bar represents the task deadline or project milestone.
Gantt charts typically track four components:
Task list: Activities or user stories the team must complete to deliver the project successfully.
Timelines: Includes task duration, completion deadlines, and project milestones.
Dependencies: Visualize relationships between project tasks to help monitor project status and identify potential roadblocks.
Progress: Team members can update Gantt charts to illustrate how close they are to finishing the task using completed story points or percentages.
What is a roadmap?
A roadmap is a planning tool for communicating strategies to stakeholders. It outlines all the steps to achieve organizational goals and desired outcomes. It also acts as a reference document, keeping stakeholders aligned and updated on project progress.
Drafting a Gantt chart organizes all the details, whereas project roadmapping connects the dots between completing the work and supporting the company’s vision. Roadmaps are more focused on high-level plans and their objectives.
Project or product roadmaps aren’t a one-and-done document. They’re developed and refined over time, responding to changes in company vision or market conditions.
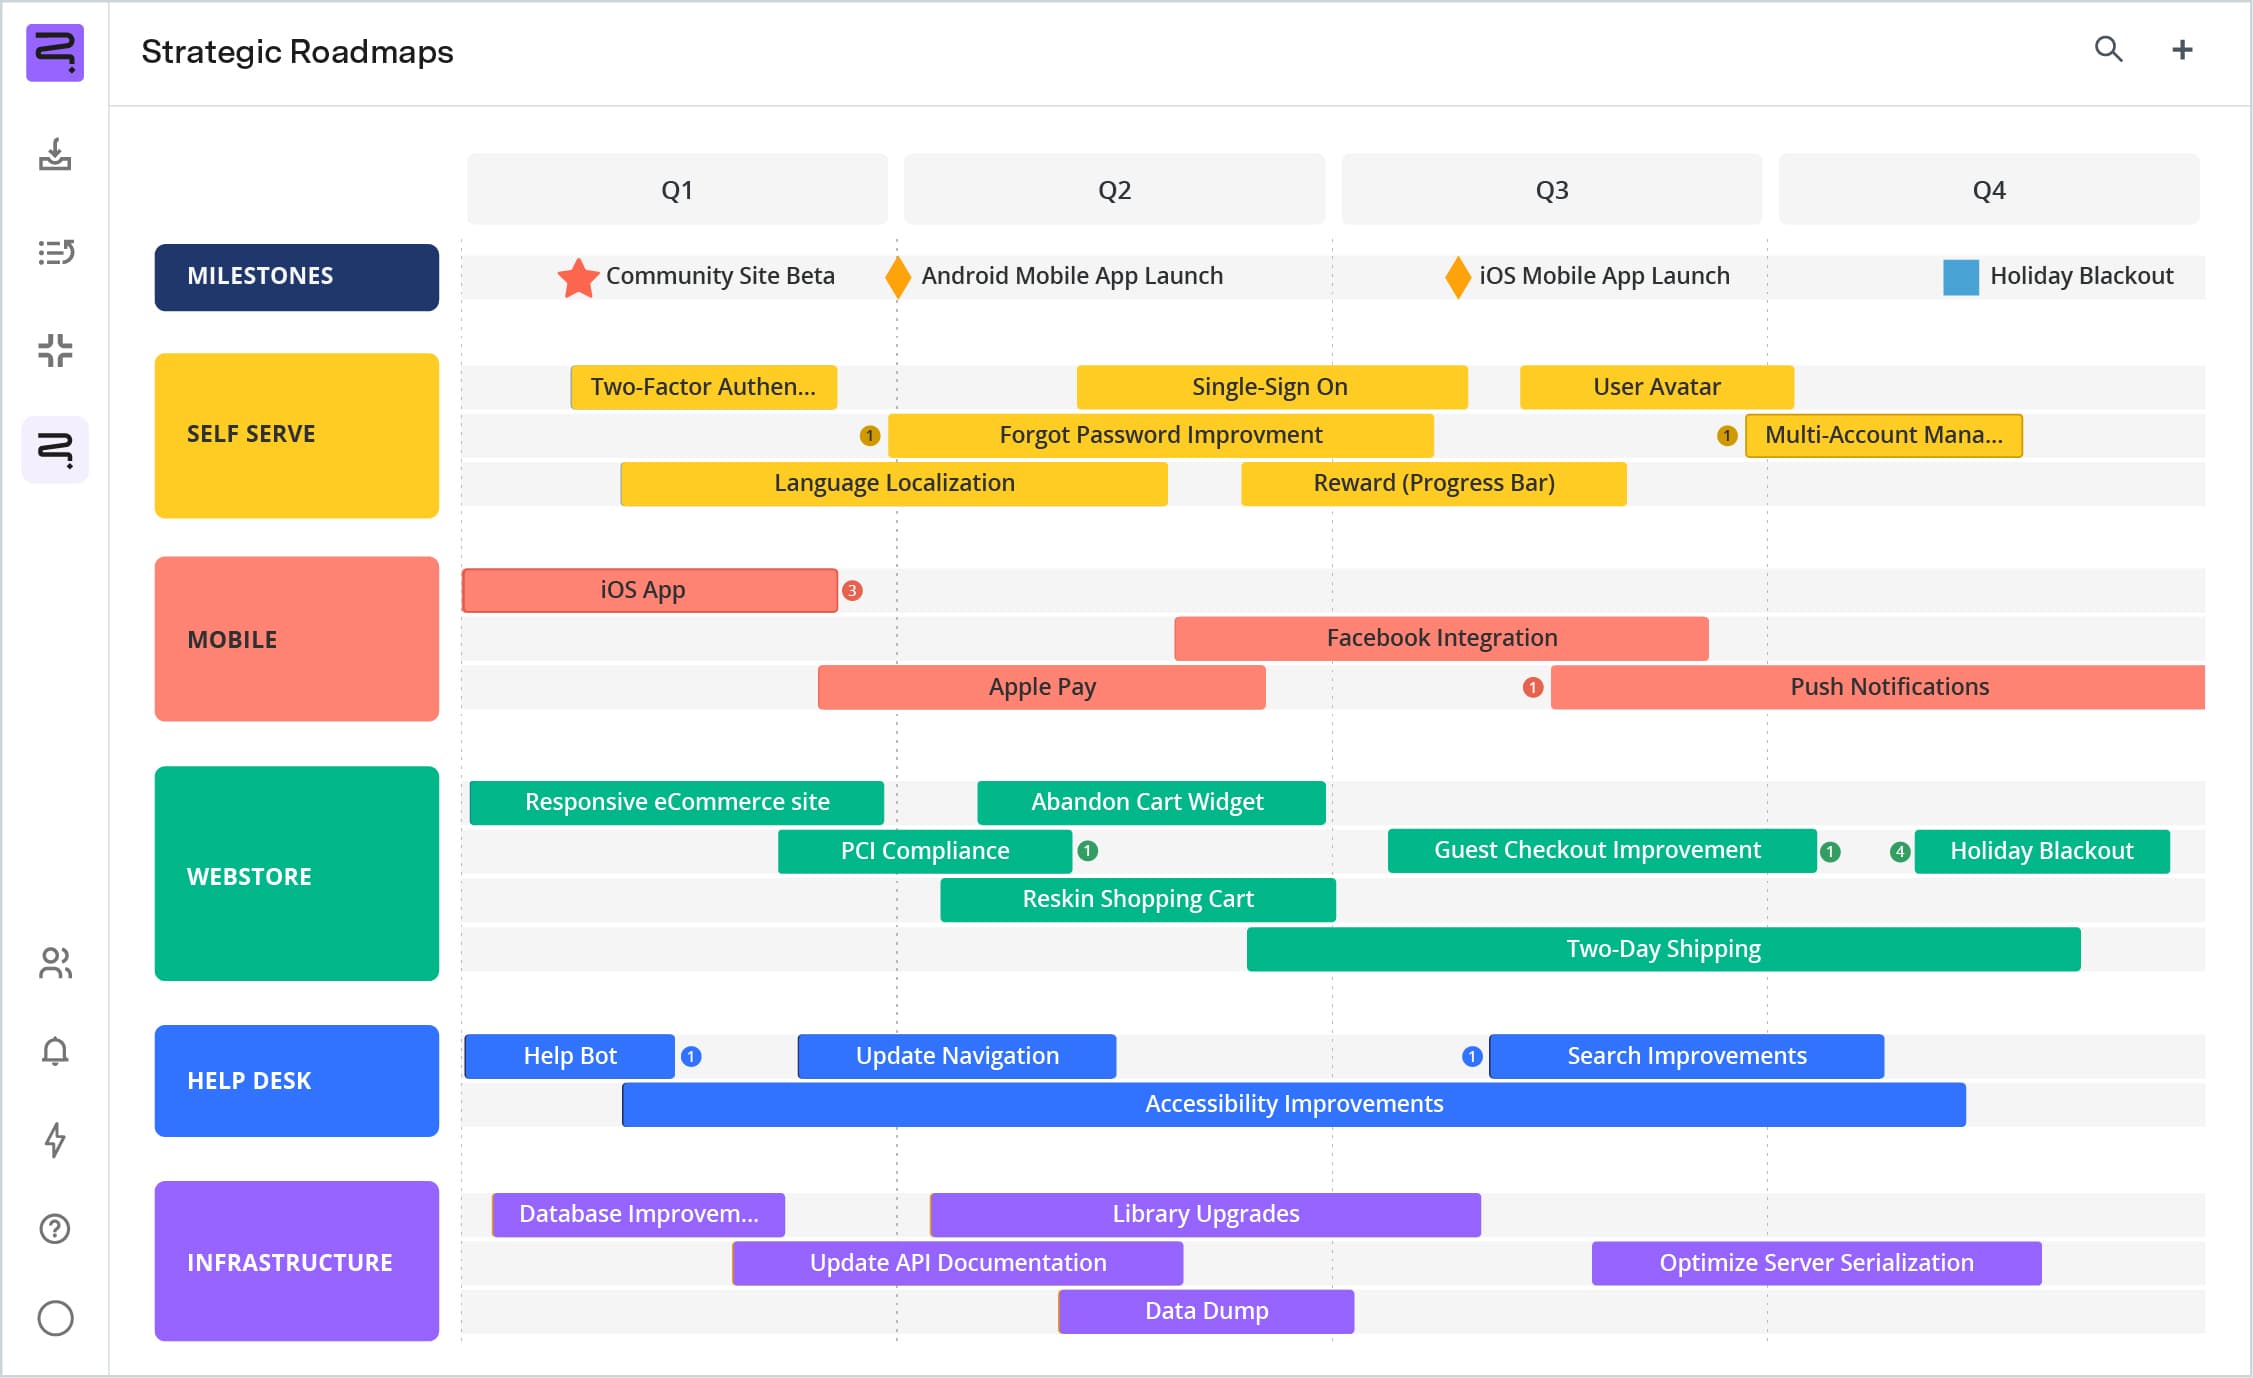
Project roadmaps look similar to Gantt charts, with dates represented on the x-axis and boxes illustrating duration via length. However, instead of tasks, the bar chart represents entire projects. In addition, project roadmaps also include crucial information regarding the following big-picture items:
Objectives: Specific, measurable, and time-bound goals that define what stakeholders want the project to achieve in the long and short term.
Milestones: Critical events or deadlines the project manager wishes to highlight.
Deliverables: The results of the project.
Resources: Materials, funds, or time the project team requires to produce the deliverables.
Planned timeline: A visual representation of the project schedule, including milestones, start dates, and deadlines.
There are many versions of a roadmap, depending on what stakeholders wish to focus on:
Features timeline roadmap
Product roadmap
Objectives timeline roadmap
Startup roadmap
Business development roadmap
Data strategy roadmap
E-commerce roadmap
Gantt chart vs. roadmap: Which to choose
Project managers can use Gantt charts and project roadmaps in concert. In fact, they often use Gantt charts to build the roadmap. However, it helps to identify the scenarios that require one over the other.
Here’s what you need to know to make an informed choice:
GANTT CHART | ROADMAP CHART | |
Purpose | Generates a linear diagram of a project’s timeline, including task deadlines, to keep team members’ work on schedule | Visualizes a strategic plan’s goals, objectives, and projects, delivering big-picture guidance and timing for daily activities |
Timeline | Depending on the project, teams divide a chart’s timeline into days, weeks, or months | If the project roadmap outlines short-term objectives, the timeline may be measured in quarters. When roadmapping long-term goals, you may choose to use years |
Application | Project managers can apply Gantt charts to outline the tasks and schedule of any initiative, but they are especially valuable for Manufacturing Software development Design Content marketing | Roadmapping contributes to strategic project and product planning activities by Clearly outlining project objectives Securing stakeholder buy-in. Managing stakeholder expectations |
Advantages | Establishes realistic project schedules and deadlines Simplifies complex tasks Identifies dependencies during the project planning phase so teams can develop workarounds Boosts productivity by centering task completion | Aligns team members regarding scope, objectives, and timelines Outlines required skills and resources Encourages discipline and ownership Quickly conveys project status |
Disadvantages | Time consuming setup Excessive details make the chart difficult to understand Reworking the diagram may be challenging without a software solution | Infrequent updating could fail to highlight dependencies, derailing the project Becomes unproductive if not updated to reflect changes in the organization or market |
Status | Gantt charts should be updated as project work progresses and the team identifies new dependencies and roadblocks | Organizational leadership should review and update project and product roadmaps at least every few weeks or once per quarter. They can also break with the schedule to address rapid economic changes. |
Agile compatibility | Agile and Lean methodologies use Gantt charts to manage workflows, breaking epics into user stories and tasks | Roadmaps provide agile teams with context related to daily tasks and long-term organizational vision |
Start roadmapping with Strategic Roadmaps by Tempo
Whether you’re leveraging waterfall or agile management frameworks, Tempo’s Strategic Roadmaps software provides project and product managers with the tools they need to prioritize ideas, manage tasks, and track progress in real time.
Do you have multiple cross-functional teams? No problem. Jira-enabled Strategic Roadmaps includes IT, project, and product management roadmapping templates so you can quickly create stunning, boardroom-ready diagrams that align stakeholders and promote team collaboration.