Learn what an action plan is and how to use it for individual and team goals. Create your action plan with the help of Roadmunk by Tempo.

For every modern organization, the tools that power your daily operations generate a lot of valuable data. Freeing up these siloed data and analyzing them can help you come up with a lot of valuable insights that guide decision-making for your organization. This also applies to you if you’re one of the 100,000 businesses that rely on Zendesk to improve their customer experiences.
As a cloud ticketing and customer support platform, Zendesk generates a lot of data that gives you insight into your customers and how satisfied they’re with your service. The best way to make use of this data is by connecting Zendesk to Tableau or any other popular BI tool.
This business intelligence platform helps you carry out robust analytics and visualize your data intuitively so you can make faster and better data-backed decisions. While there are different ways to connect Zendesk to Tableau, this post explains the simplest way to integrate these two platforms using an easy-to-use Zendesk Tableau Connector that requires no advanced coding experience.


Zendesk is a cloud-based customer support platform that helps businesses of all sizes manage interactions with their customers across multiple channels. As an omnichannel customer support tool, Zendesk helps users to centralize customer interactions via phone calls, chats, social media, emails, and any other channels to a unified platform where they can be managed seamlessly. This makes it easy to track all customer support tickets, reply to questions and monitor the activities of your customer service agents quite effectively.
Zendesk features a ticketing system that helps you integrate all your customer support requests from different sources into one location. You can also use this platform to create a knowledge base or guides for your customers or as a tool to build and manage online community forums for your business.

Tableau is a business intelligence platform used to explore, manage and analyze data. This analytics platform is an intuitive and visual-based tool that allows business users to make strategic decisions, and come up with intelligent forecasts by leveraging the power of data analytics.
Tableau has several easily accessible features for creating highly simplified data visualizations in the form of graphs and charts. This helps to convert complex data into easy-to-understand insights and trends that are visually available to everyone. Tableau can be run on desktop, cloud, or internal servers and can load data from multiple sources to visualize, observe, understand them, and make decisions that are best for your business.

Zendesk is a valuable source of truth that generates important information about your interactions with your customers. Analyzing Zendesk data is no doubt an efficient way to learn about the various ways to improve your customer interaction and other vital business decisions related to this.
As a visual-based business intelligence platform, Tableau simplifies the process of analyzing Zendesk data. With Tableau, you can generate graphs, comprehensive reports, and other forms of advanced visualizations based on data related to your support tickets, agent activities, customer satisfaction ratings, comments, and other essential metrics. You’ll find Tableau visualization a more efficient way to assess this data.
One of the most important benefits of using Tableau Software for Zendesk reporting is that there are no limits on the amount of exported data. You can include any amount of tables and fields in your Data Source. With Tableau, you are in complete control of the data and can transform it into any type of visualization, giving you endless possibilities for analyzing your Zendesk data.
Additionally, a Tableau Zendesk integration allows you to merge Zendesk data with data from other sources such as your PMS, LMS, ERP, or any other professional tool you use. This way, you can generate insightful Zendesk reports that combine data across different business functions.
Despite the numerous benefits of integrating Zendesk and Tableau, Zendesk does not have a direct integration to do a Zendesk data export to Tableau. Although there are a few workarounds, they’re usually quite complicated. Arguably the easiest way to connect Zendesk to Tableau is by installing Alpha Serve’s Tableau Connector for Zende sk.
Let’s go through the steps you need to follow to set up Tableau Zendesk integration.
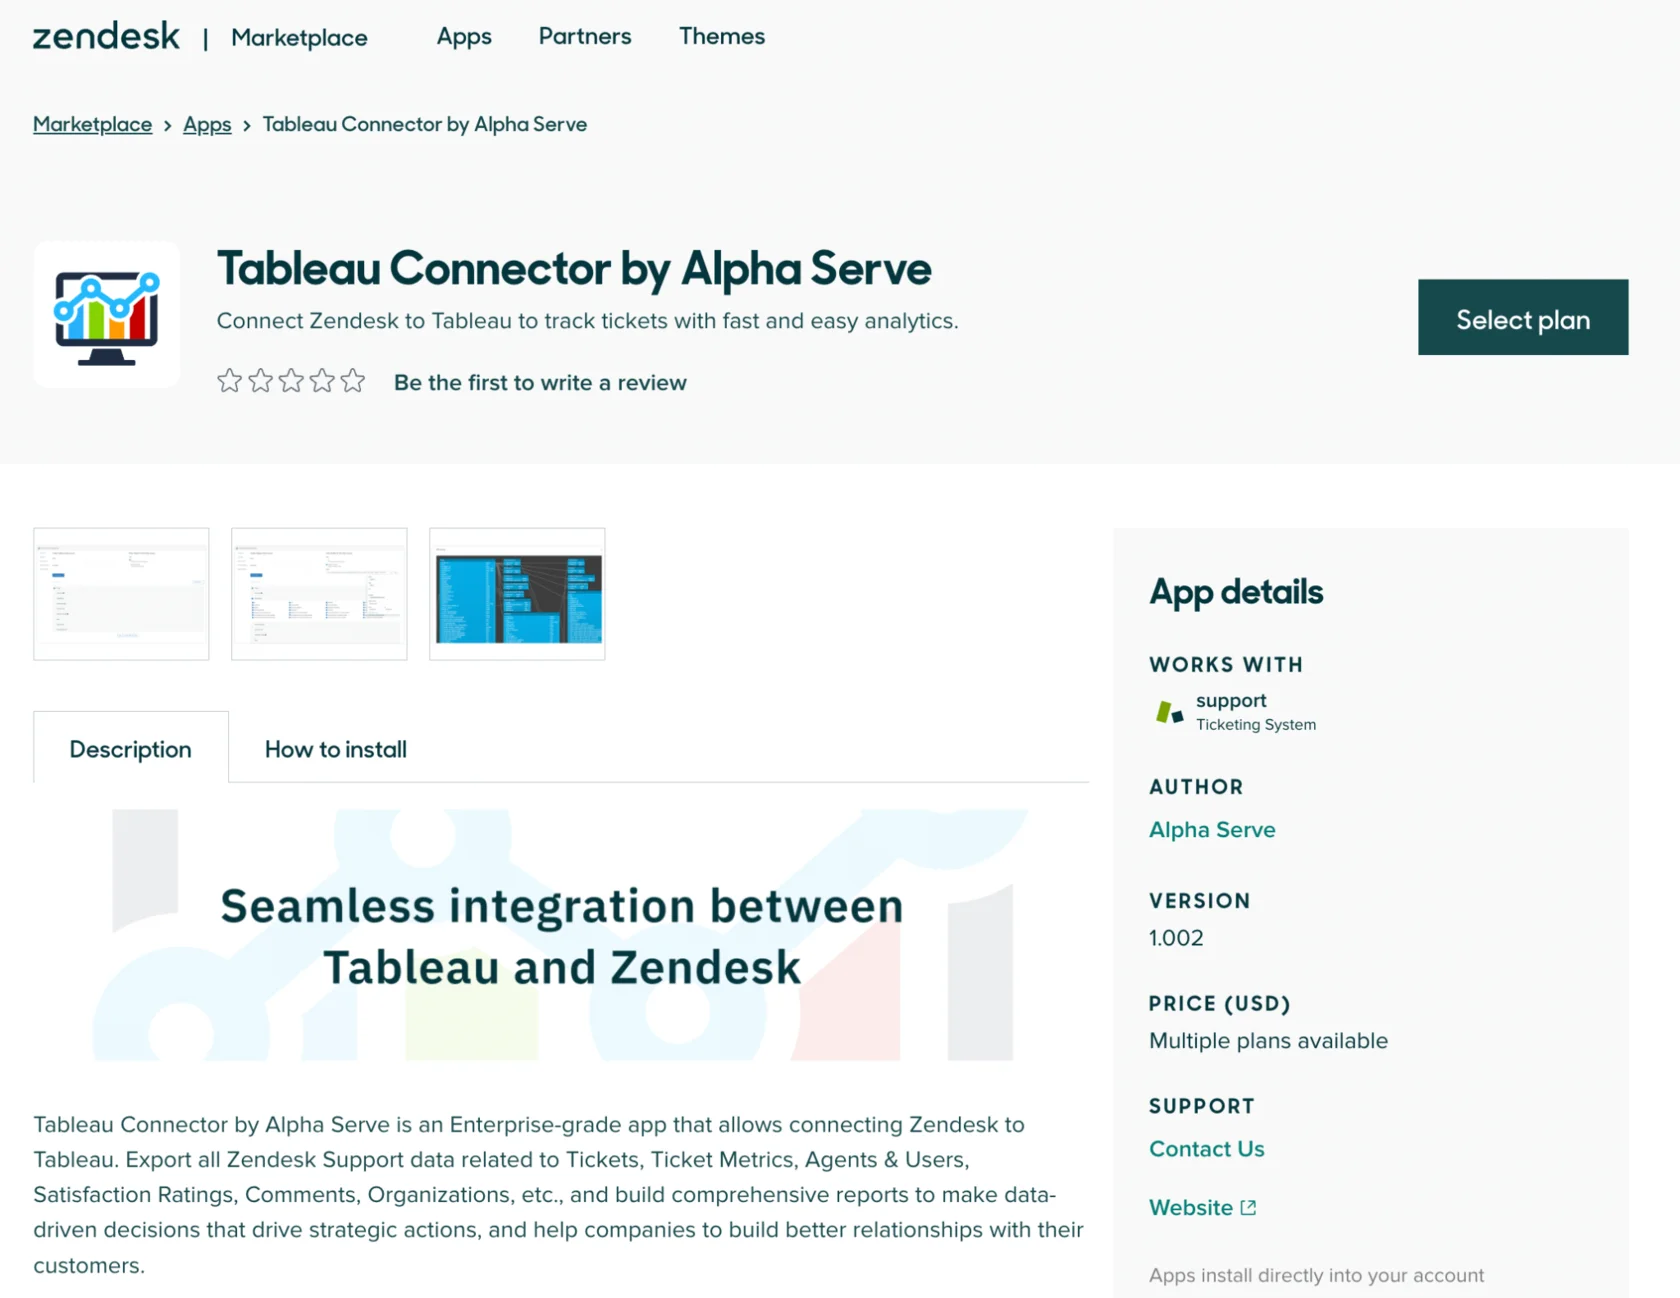
Only a user with a Zendesk Administrator role can install the Tableau Connector for Zendesk. The plugin is available for download on the Zendesk Marketplace. To get started with the installation go to the Tableau Connector for Zendesk marketplace page, click on “Free trial” and select your Zendesk account from the list if you’re prompted to do so. Click the Install button.
On the next page, you will be prompted to select your preferred pricing plan and input your billing details to proceed. For the free trial period, you won’t have to pay anything upfront for the first 14 days of using the app. Once the payment information has been saved, the app installation will proceed and you will be redirected to the Zendesk Admin Center once the installation has been completed. You can find full information about Tableau Connector Pricing plans and Billing here.
With the application installed, the final step of your installation is to connect it to your Zendesk account via OAuth. Check Tableau Connector for Zendesk documentation to find the instruction.
Your Zendesk Tableau Connector can be configured from the Zendesk Admin Center page. On the Admin Center page, click on Apps and Integrations then select Zendesk Support Apps from the list. Look for the Tableau Connector for Zendesk on the list of apps and select it. This should take you to the settings page for the connector.
From this page, you can configure different functions of the app including your plans and billing details, the application title, and who has access to the app with the specific roles of each of the users.
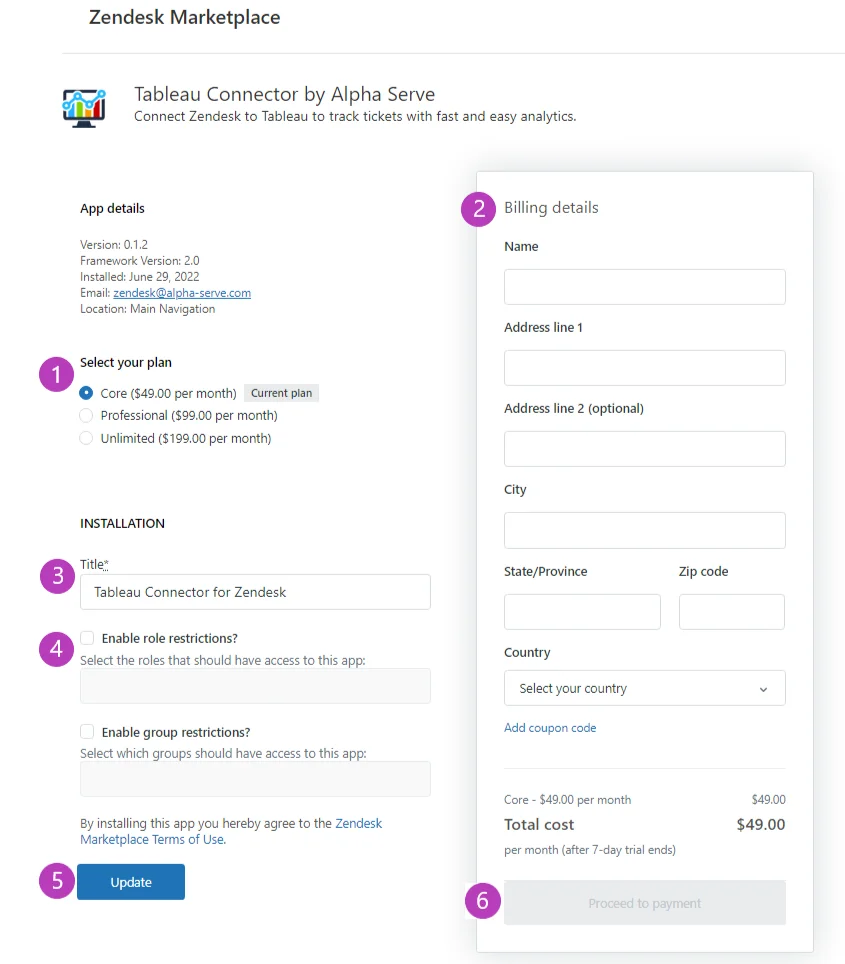
Tableau Connector allows you to set or enable role restrictions for a specific user or group of users. The “Enable role restrictions” checkbox allows you to restrict access to specific users in the input field. Similarly, the Enable group restriction checkbox allows you to restrict access to users in a specific group. Once you have tweaked the settings to configure the connector, you can proceed to click the Update button. This should save all the changes you have made to the app configuration.
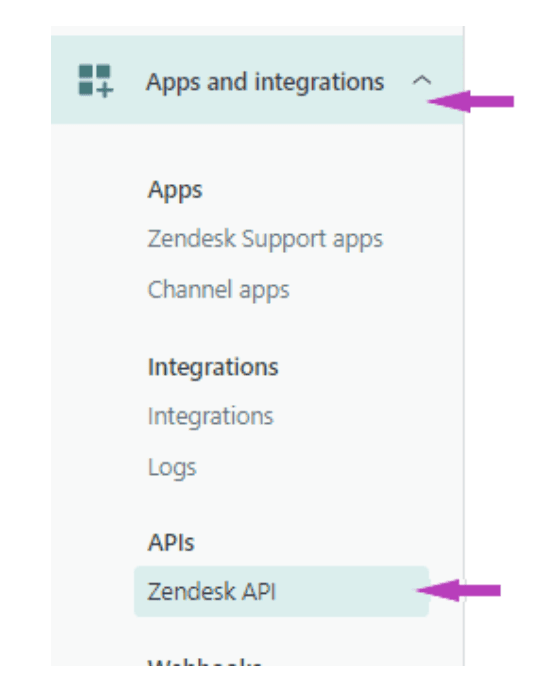
To export Zendesk data to Tableau, you need to be a Zendesk Administrator or have the administrator’s permission to access the app. You can contact your Zendesk Administrator to get permission to export Zendesk Data to Tableau as a user. The first step is to generate a Zendesk API access token. To do this, navigate to the Zendesk Admin Center from the navigation bar, find Apps and integrations and click on Zendesk API.
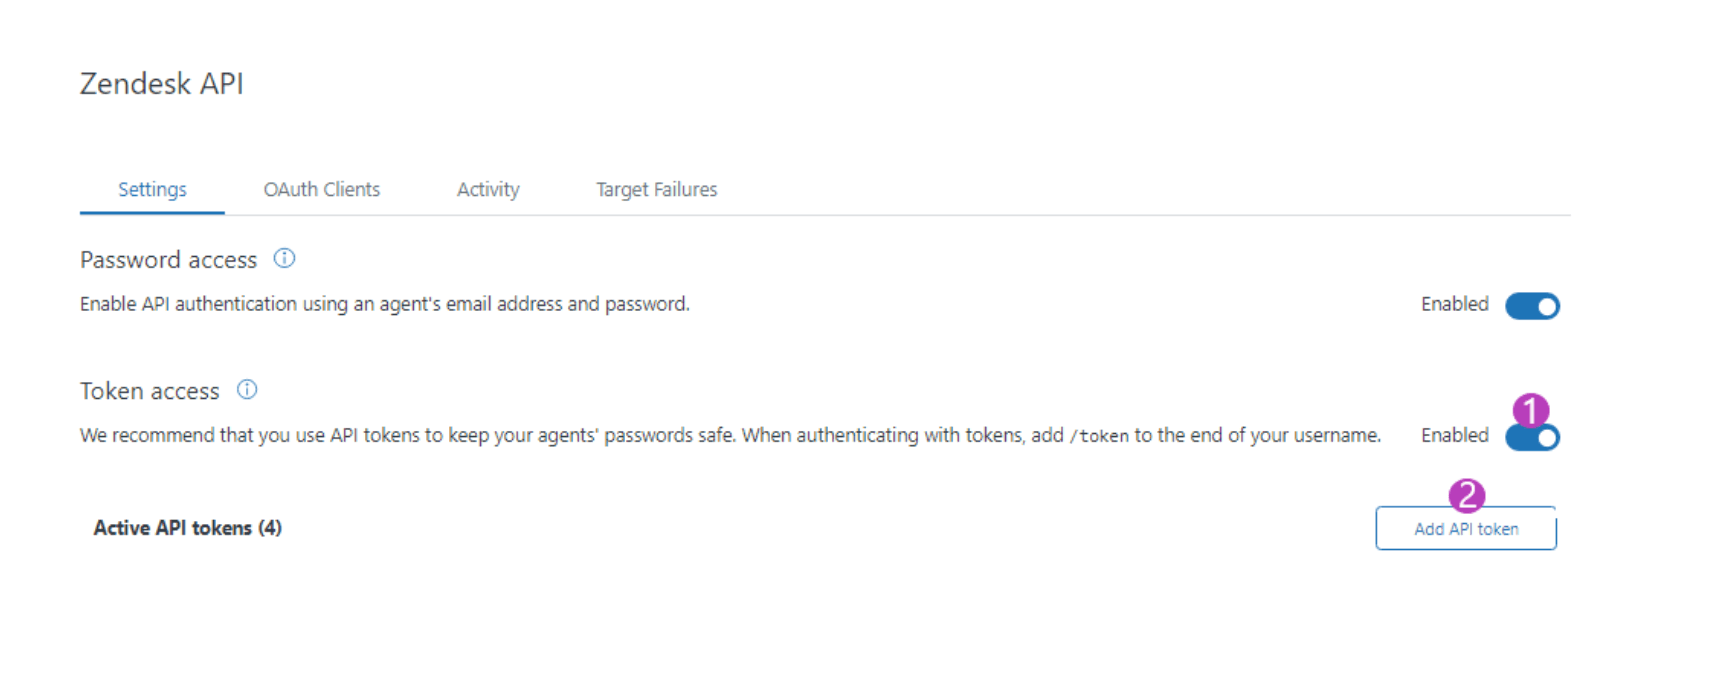
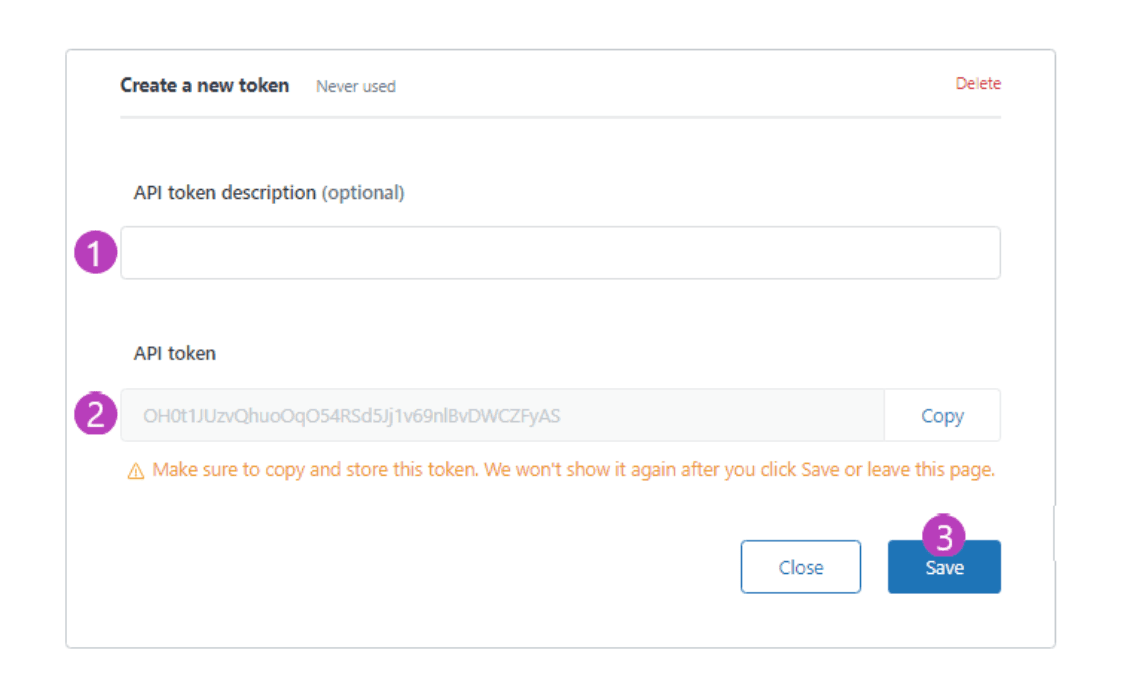
Be sure to enable token access, then press Add API to add a new API token.
You will be prompted to add a specific description for the token you intend to generate. This description will help distinguish it from other tokens. Copy the API token somewhere since you will still need it later.
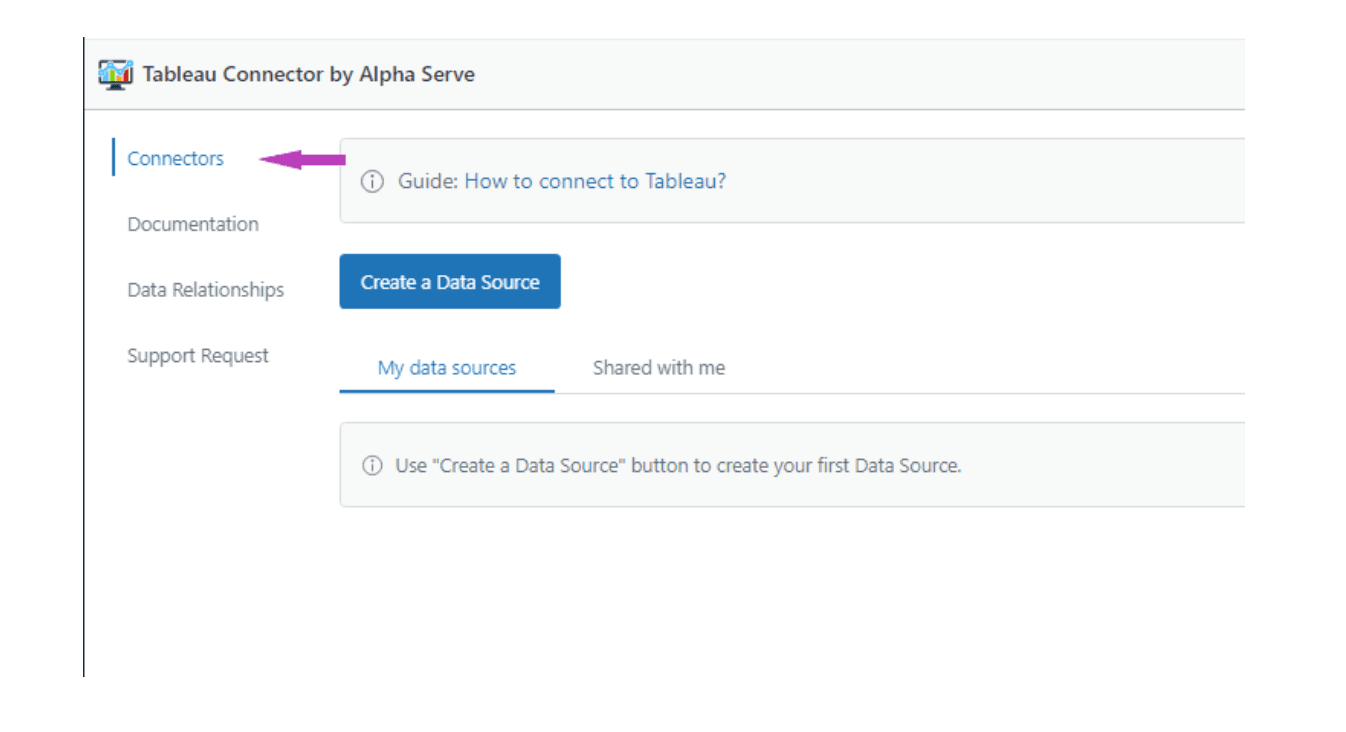
The next step is to create a data source in Zendesk. First, launch your connector by selecting the Tableau Connector for Zendesk Icon on the navigation menu. Choose Connectors.
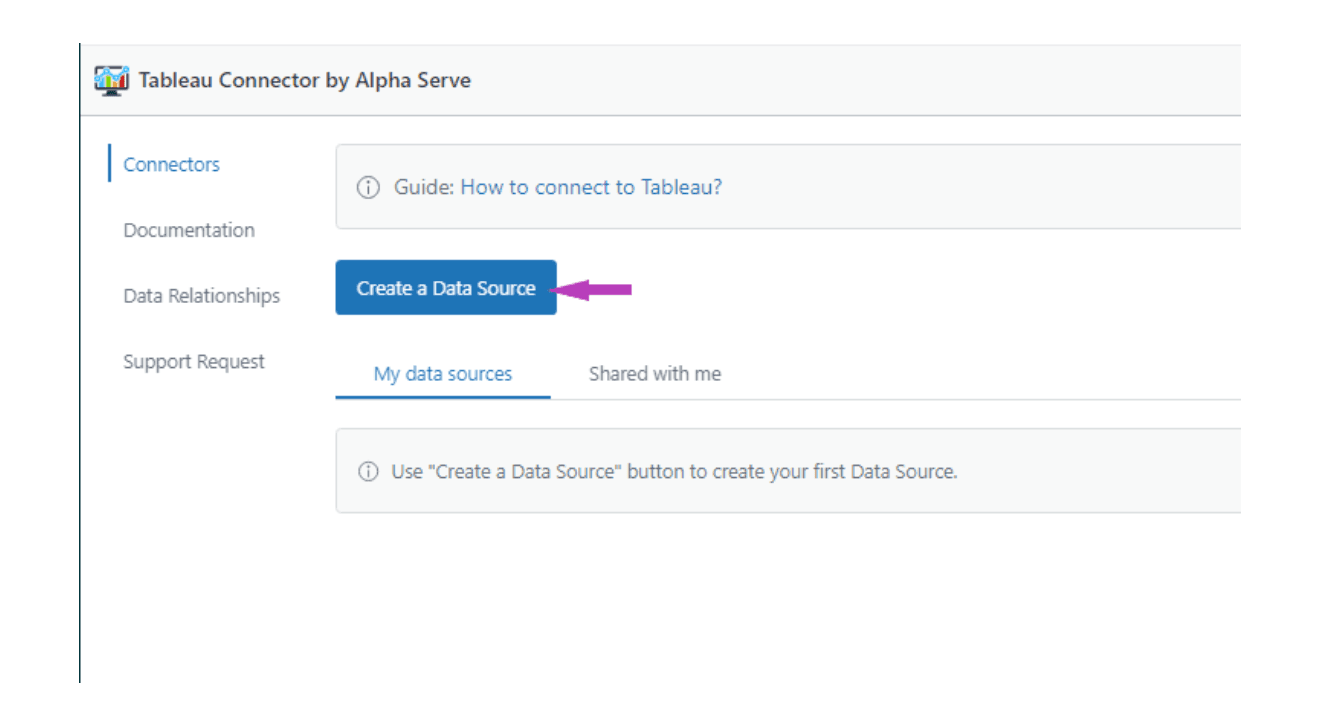
Select the “Create a Data Source” option. On the page that opens next, you will be able to change some things about the data source you intend to create such as the name, description, and whether or not you want to share it with other users or groups.
Although you can export all your data at once, the connector also has a filter option that allows you to modify the Zendesk data to export.
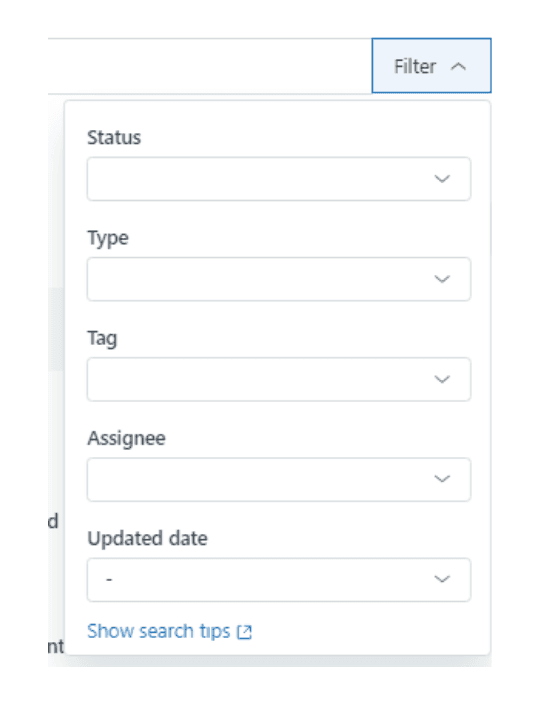
You can set this connector to modify exports based on a specific search query or a set of predefined filters. The connector also allows you to set specific fields to be displayed in the export data reports. Only the fields you select at this point will show up in your final report when you eventually export it.
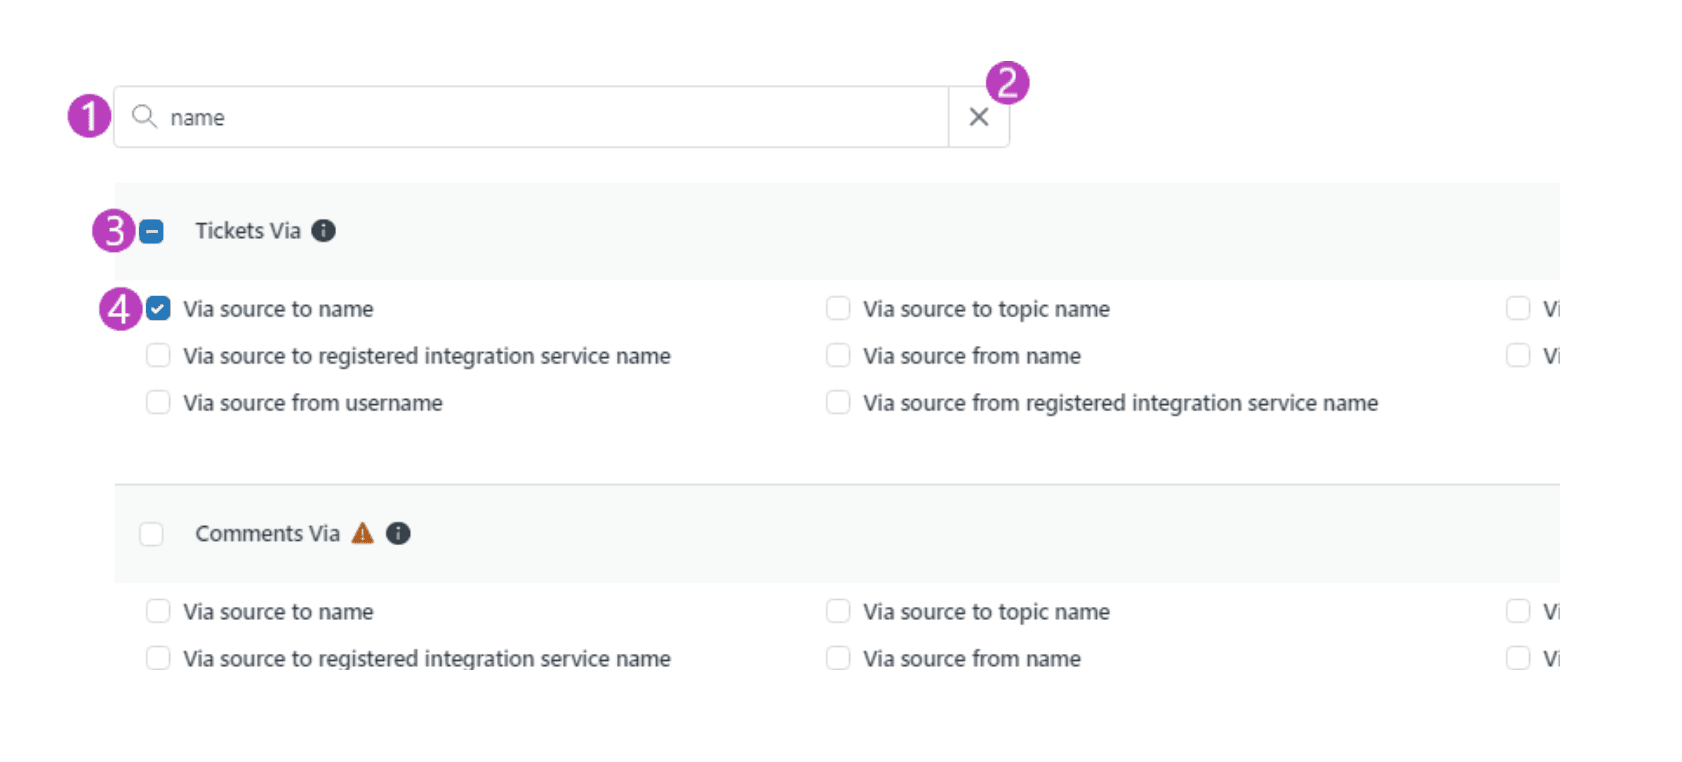
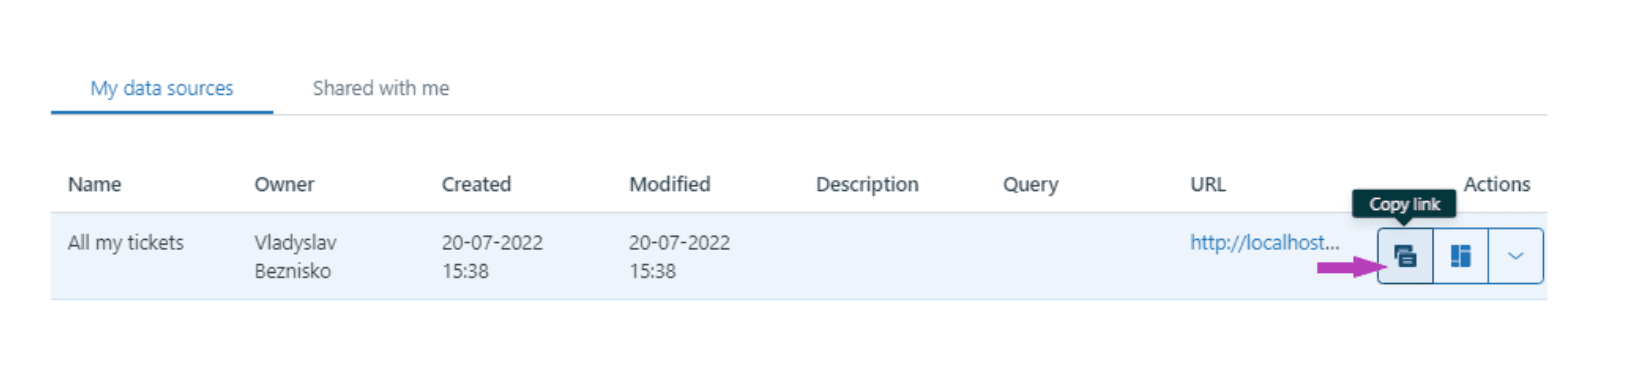
After modifying all of these settings, you can click Save to record all the modifications you have made. After saving your settings from the previous steps, the connector generates the OData Feed URL. Copy the URL generated by the app and Launch Tableau.
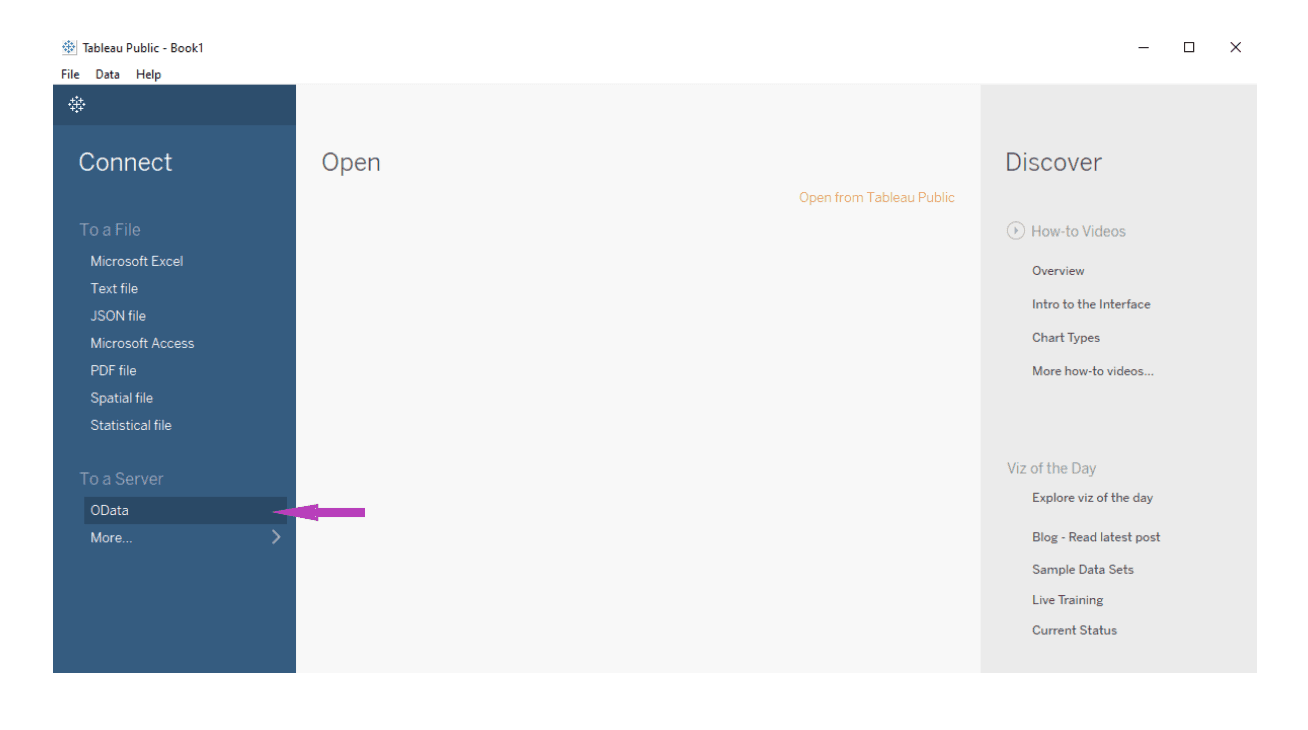
In the Tableau app, click on Connect > Get Data you will be prompted to paste the OData URL.
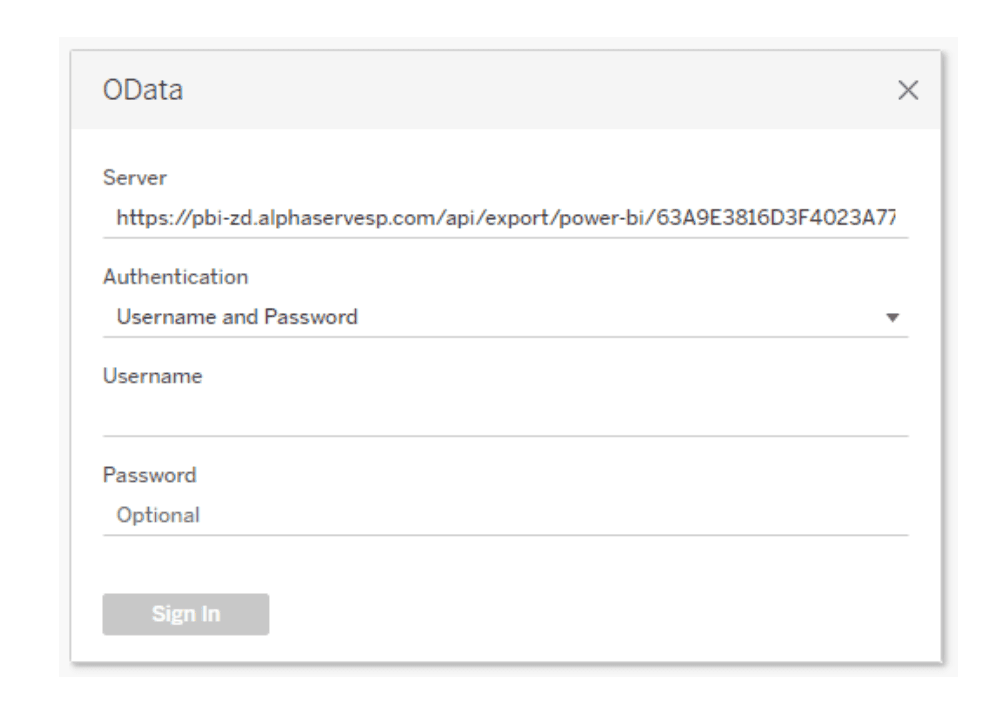
Sign in on the next page using your email address as your username and the API token you copied earlier as the password.
Once the authorization process has been completed, your data will start loading into Tableau. How long it’ll take to export all your data depends on the amount of data you’re working with.
The Alpha Serve’s Tableau Connector for Zendesk makes it possible for anyone to start building graphs and other forms of data visualization based on imported Zendesk data. As highlighted above, the process is straightforward and allows you to export large volumes of data within a short time without relying on complex workarounds or advanced coding experience.
Learn what an action plan is and how to use it for individual and team goals. Create your action plan with the help of Roadmunk by Tempo.

CEOs are asking their CTO and CFO: What did we get for the AI money we spent? Workforce Intelligence has the answer.

Learn about DevOps project management and how this agile framework improves from team performance to product quality and customer satisfaction.

Dive into agile project management with free Kanban board templates. These tools help you design a standardized workflow process to suit your team.

Intelligent capacity planning shortens how long a team stays overbooked before the PMO finds out. Learn how Jira estimates make it work.
Businesses increasingly use workflow automation to reduce manual tasks, improve accuracy, and streamline processes. Try it yourself in 6 simple steps.

All you need to know about SAFe reporting in Jira, the three main areas you need to be tracking, and what an agile release train (ART) is.

Spotify’s agile model propelled the company to become the world’s most popular music streaming service. But should other companies follow its example?

The Planner team has been bridging the gap between individual and team planning, and helping leaders manage their resources, people, and projects.