Conflict is a constant presence in life. The pressure to deliver unique results on a short timeline adds to the pressure in the world.

monday.com and Power BI are the two most popular business platforms. Organizations can use them together to create comprehensive reports to improve process workflow and team cross-team collaboration.
monday.com is a cloud-based work management platform that gives businesses the tools and applications to manage and improve workflow for individuals, teams, and enterprises. On the other hand, Power BI by Microsoft is a data analysis and business intelligence (BI) tool. It is a cloud-based platform where data analysts and managers can create, visualize, connect and share data among stakeholders.
Power BI monday.com integration can immensely benefit businesses, and that's why in this article, we'll learn how you can connect them. By the end of this step-to-step integration guide on automating the connectivity for the best possible results. Let's get started.


monday.com is a cloud-based intuitive work management platform. It offers businesses the necessary tools and services to manage their resources, projects, and tasks. With it, your teams can collaborate seamlessly, manage complex projects, and streamline workflows. However, the main reason why monday.com excels is its flexibility. As a team or an individual, you can use it to manage different workflow types, including Marketing, Software Development, HR, Operations, and even Customer Relationship Management(CRM).
Furthermore, the monday.com all-in-one Work OS is great for small and mid-level businesses. However, enterprise project managers can also use monday.com to manage projects, vendors, and teams.
At monday.com's core, you need to create a board to manage a project. These boards are completely customizable with key elements such as groups, items, columns, apps, and more. You also get dashboards for insights and easy decision-making. You can also connect apps such as Dropbox, Slack, and Power BI to streamline tools and improve team productivity, inviting business impact.
If you want to read more about monday.com in detail, check out: What is monday.com and How to Use it, where we talk about its features, benefits, and pricing.

Power BI is a powerful data-visualization business intelligence platform. It is an end-to-end platform that gives companies the tool to create a single source of truth and then create powerful, customizable reports full of insights. It also supports a wide variety of data sources and integrations. So, you can pull monday.com data to Power BI to create visual reports that are easy to share among stakeholders.
Out of the box, you can use Power BI to create different types of reports, including customer profitability, digital marketing, HR analytics, and more. These reports contain elements that make them visually appealing and meaningful. For example, you can use area charts, combo charts, funnel charts, and more to give your data meaning.
Overall, Power BI is an all-in-one data analytics tool with features such as big data support, real-time analytics, a customizable user interface, and excel integration. On the other hand, monday.com reporting is basic.
That's why using Power BI with monday.com opens up multiple benefits, including:
centralized data sources
flexible data visualization
custom reporting to fit business needs
share reports and dashboards with non-monday.com users
automate data transfer with the right plugin(more on it later).

The best way to integrate monday.com and Power BI is to use Power BI monday.com Connector by Alpha Serve. The connector provides an automated way to connect both platforms, and you don’t need any coding skills to do so. In addition, this enterprise-grade app enables you to export all monday.com data, including Boards, Items, Workspaces, Updates, and more. With easily accessible data, you can create comprehensive reports to make better data-driven decisions.
We want to emphasize that Power BI Connector for mobday.com does not collect, store, or process any personal or confidential information; we also refrain from collecting, storing, or processing analytical or tracking data. Additionally, we do not use cookies or tracking beacons in any of our Applications. Your privacy and data security are our utmost priorities.
The Power BI monday.com connector includes the following features:
No-code Integration: No need to write a single line of code to make the integration work.
Direct connection: The integration doesn’t route the connectivity and directly connects monday.com and Power BI.
Data Refresh Schedule: Automatically schedule refresh data export upon publishing a report or dashboard, ensuring they are always current.
Advanced Filtering: Select proper data and export relevant information.
Unlimited Data Export: Our export functionality empowers you to export unlimited amounts of data. Select from various fields and tables, including custom fields, to tailor your export according to your needs.
Automated Data Relationship: The connector is smart enough to automate data relationships between fields and columns.
Intuitive User Interface: The interface is catered to even the first users, giving them a quick start to easy data export and report creation.
Ensured Data Security: We strictly adhere to a comprehensive policy dedicated to ensuring the security and privacy of your information.

In this section, we’ll take a closer look at the connecting monday.com and Power BI so that you can export data from monday.com easily using automation and a no-code approach. Let’s get started.
[VIDEO]
The Power BI Connector for monday.com functions as a dashboard widget, requiring at least one dashboard to add the app. For ease, creating a dedicated Power BI Connector dashboard before installation is suggested, although any existing dashboard can be chosen.
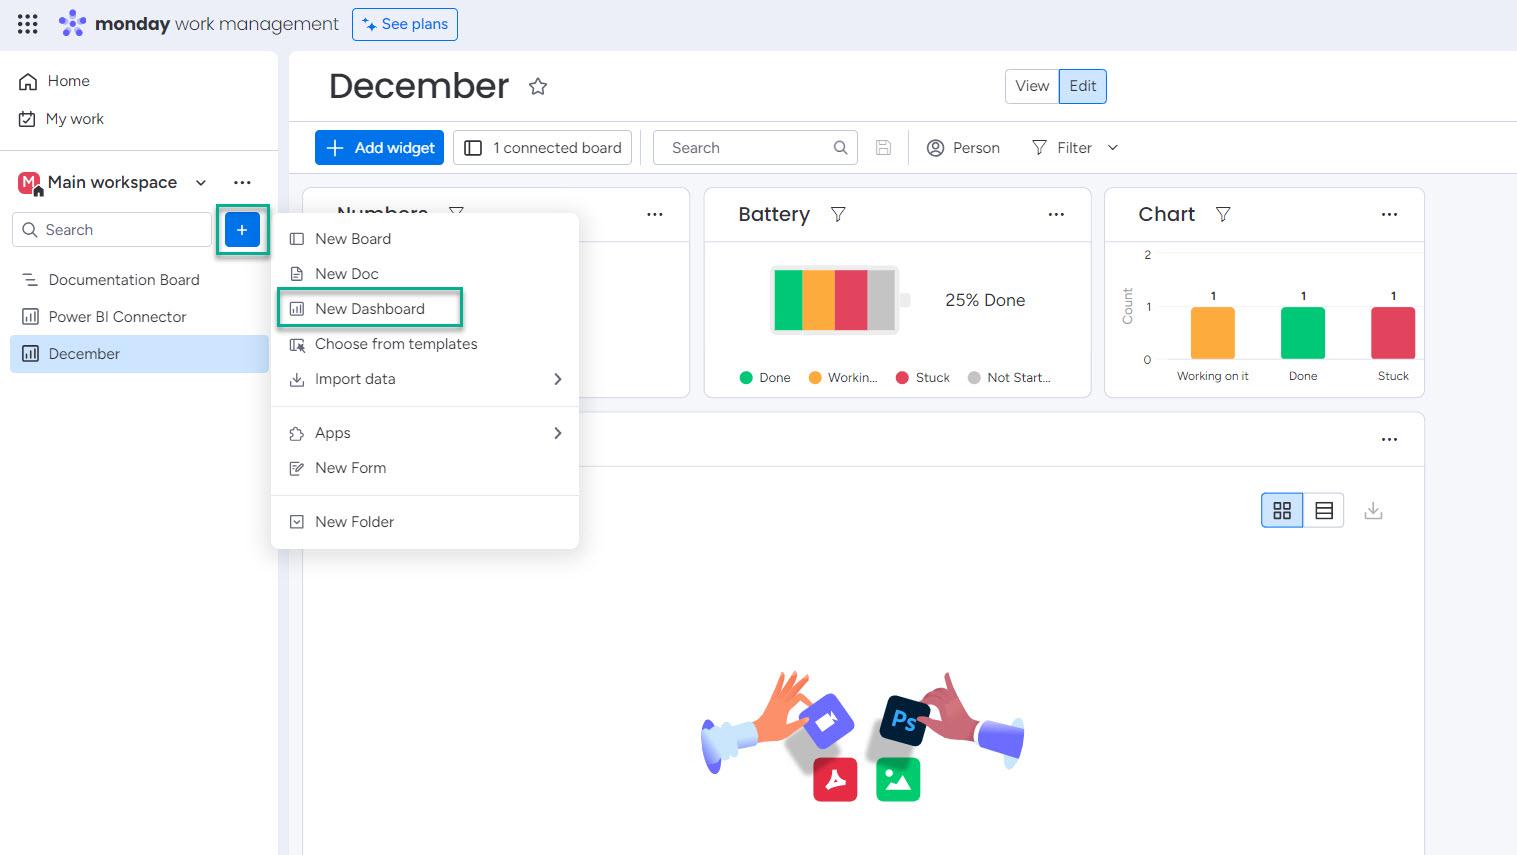
While logged into your monday account, choose the relevant workspace, click on the "+" button, and then opt for "New Dashboard."
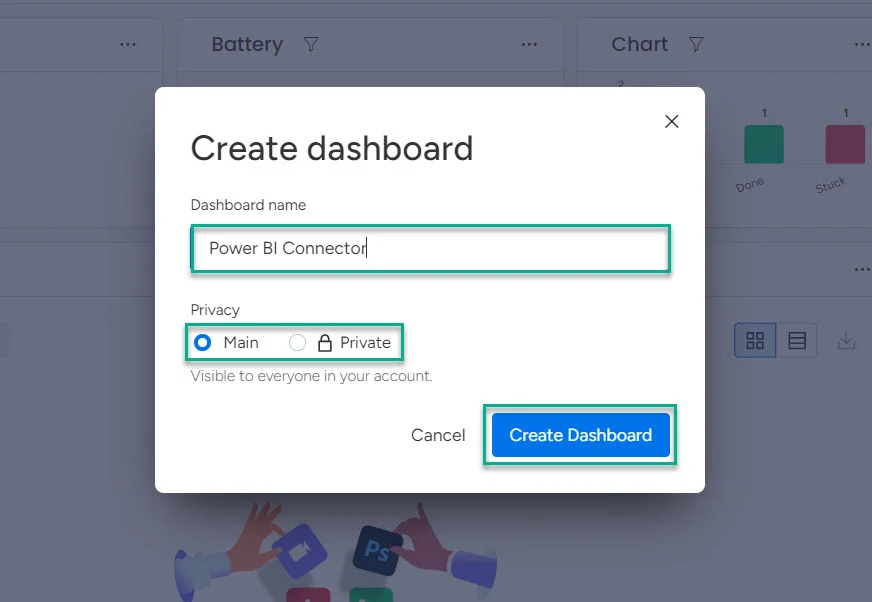
In the Dashboard name field, input your desired name (e.g., Power BI Connector). Choose the privacy settings and click on "Create Dashboard." During the Power BI Connector installation, select this newly created dashboard.
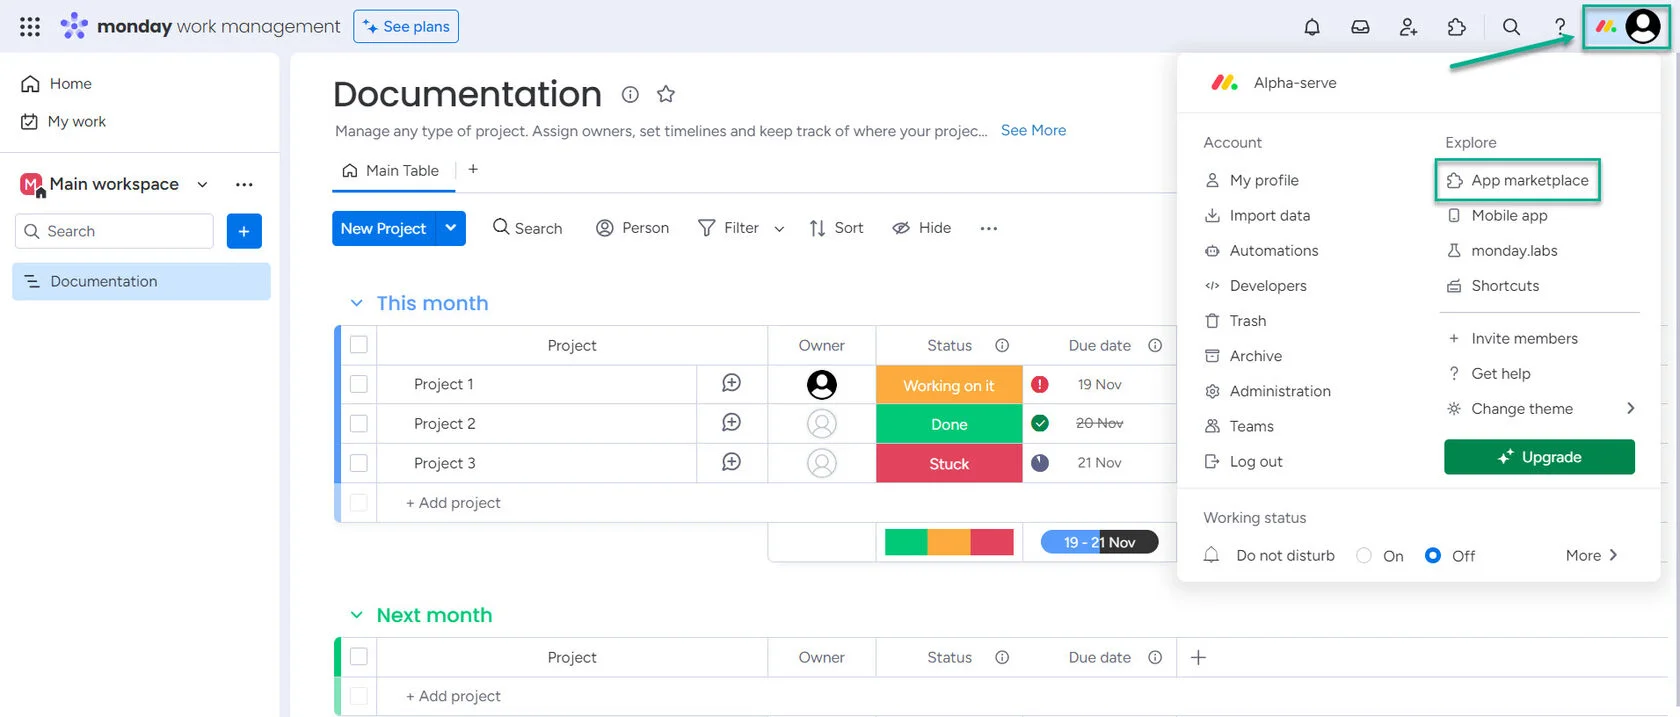
While logged into your Monday account, click on your profile picture and then access the App Marketplace. Type "Power BI Connector" in the marketplace search box and then hit Enter. From the search results, choose "Power BI Connector by Alpha Serve."
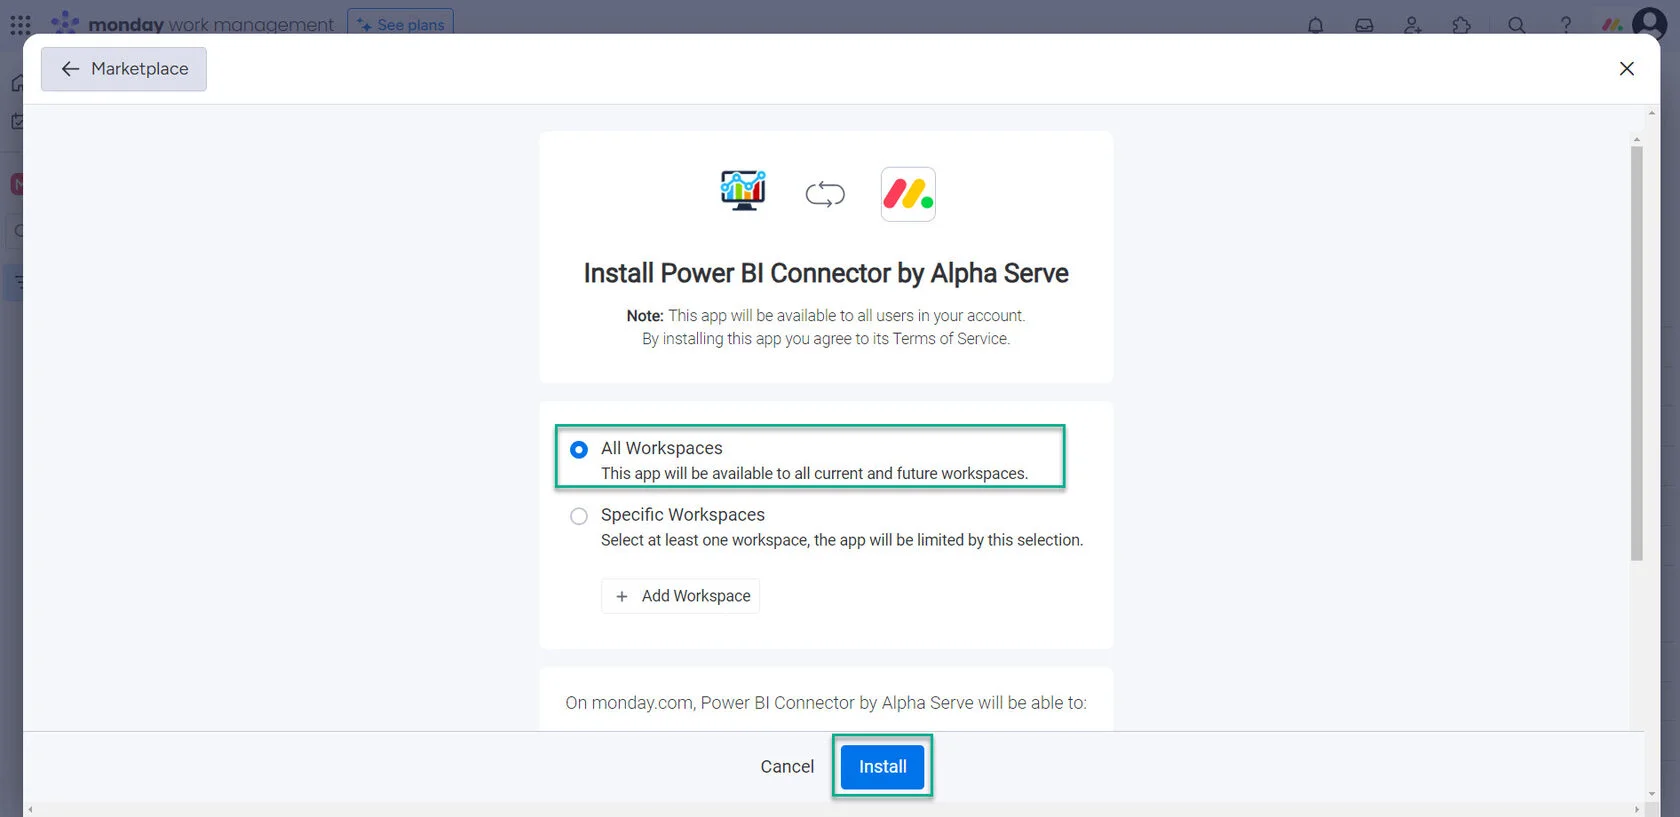
Click on "Add to your account." Choose "All Workspaces," and then click on "Install." Select the workspace where you want to add the Power BI Connector.
Choose a dashboard that you've created to add a Power BI Connector. Click on "Add app." Select "Connect boards to get started."
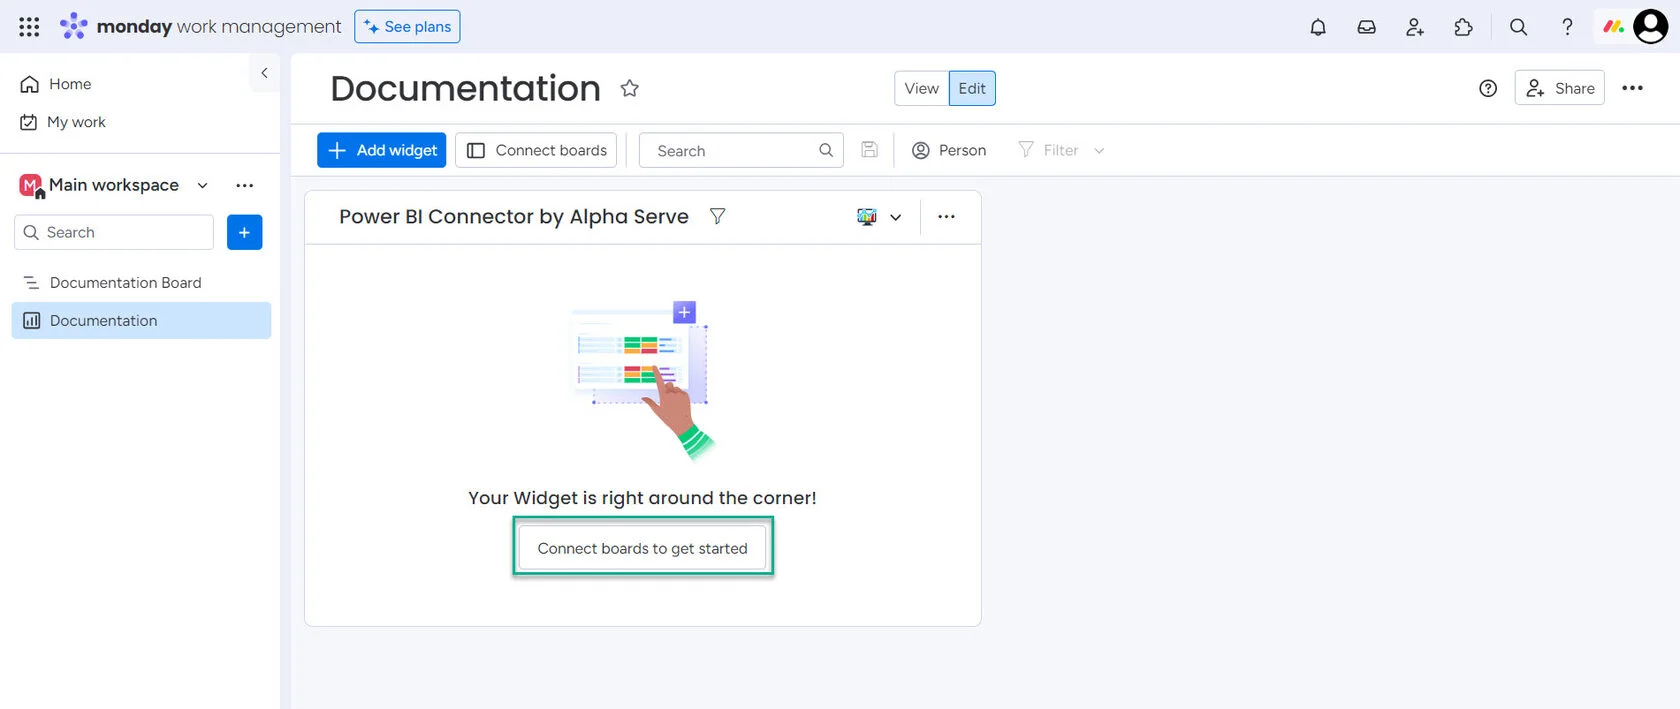
Choose the relevant boards, check or uncheck the "Add newly selected boards to all existing widgets" option, and click "Done."
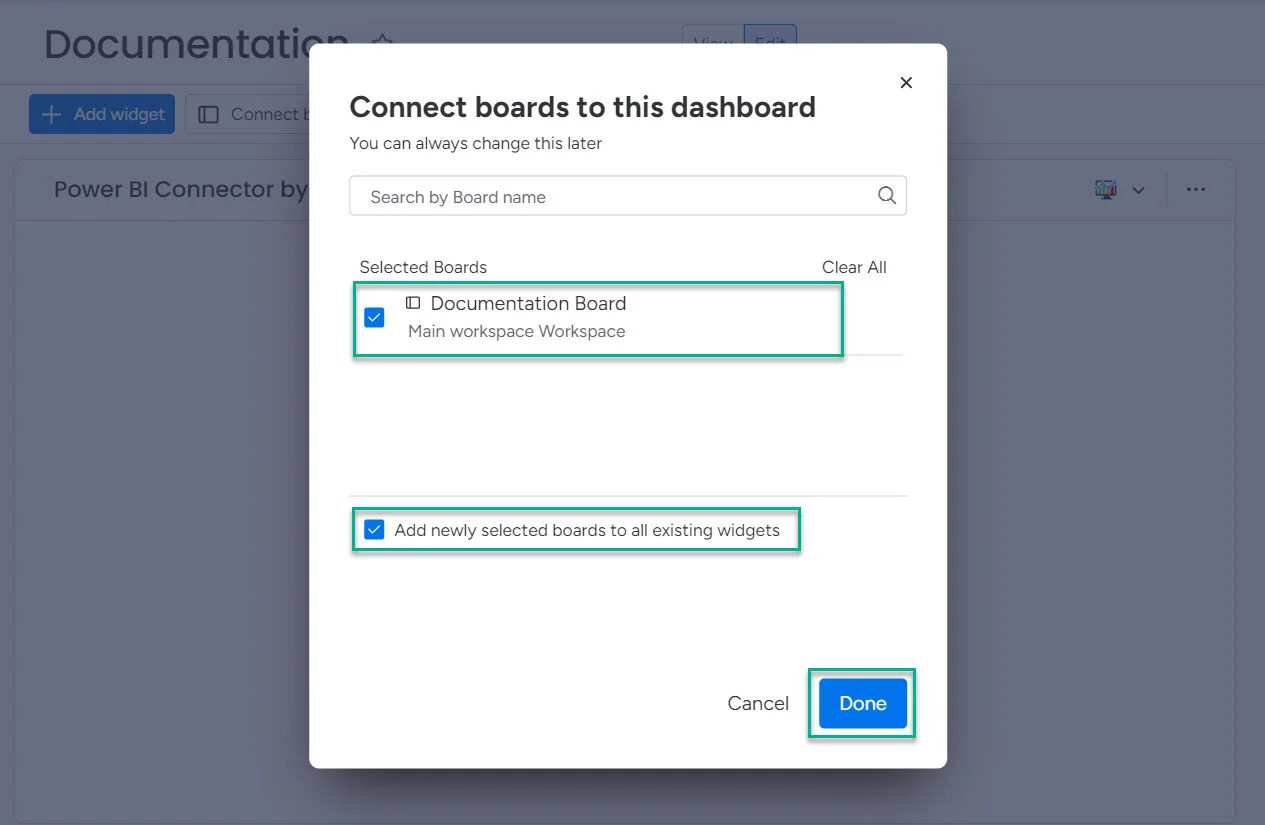
Finally, click on "Authorize."
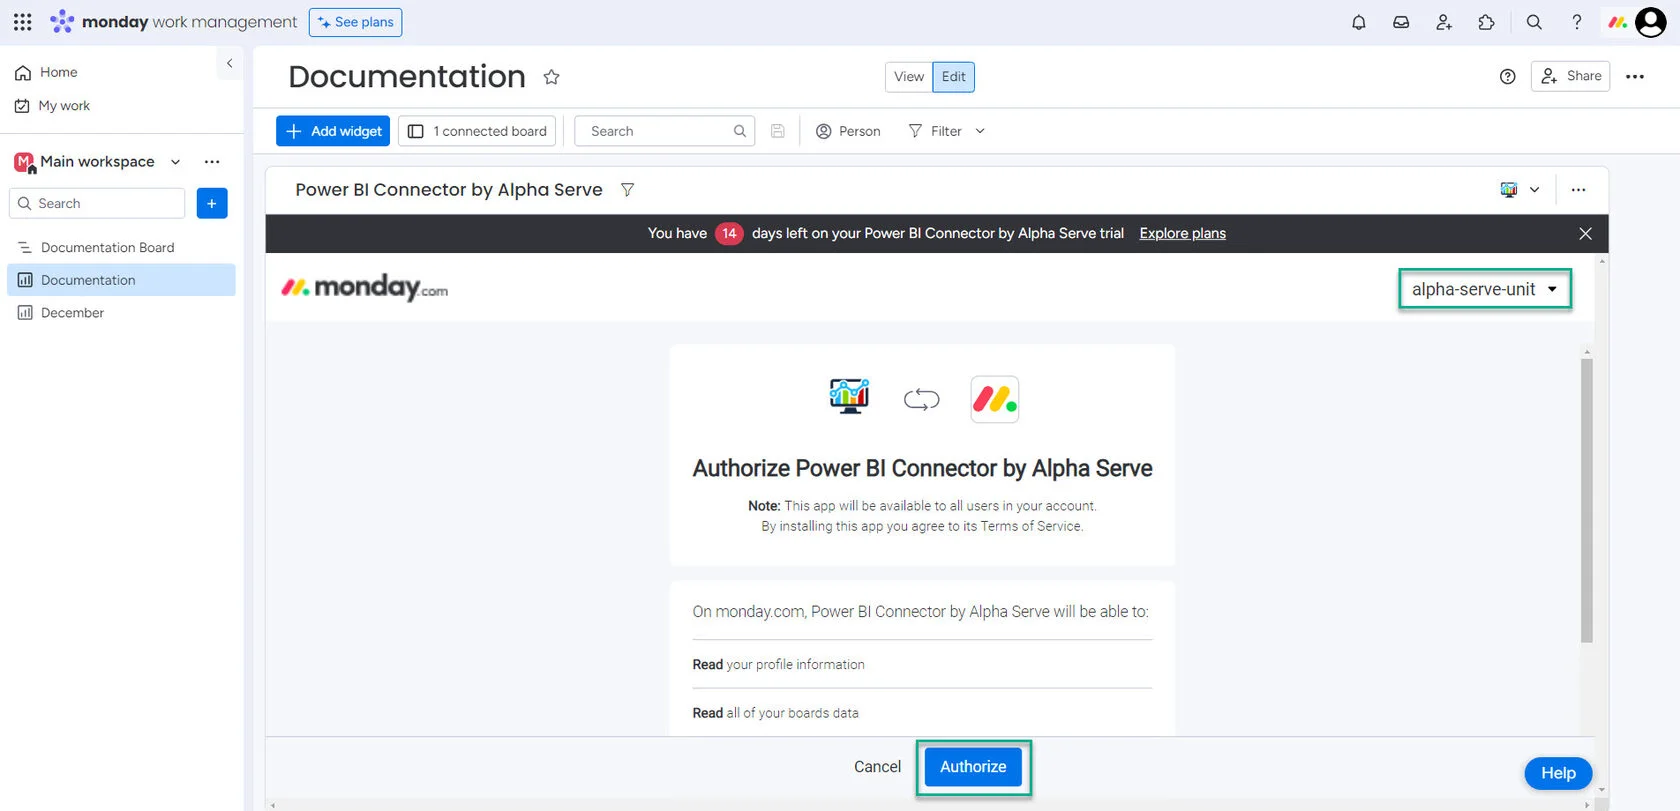
As you can see, it'll need you just two minutes to install the Power BI Connector. For more details, check out Installation Guide - Power BI Connector for monday.com, which also contains the guide to disable or uninstall the connector.
To export data from monday.com to Microsoft Power BI, create a data source by accessing the Power BI Connector widget and selecting "+ Create your first Data Source now."
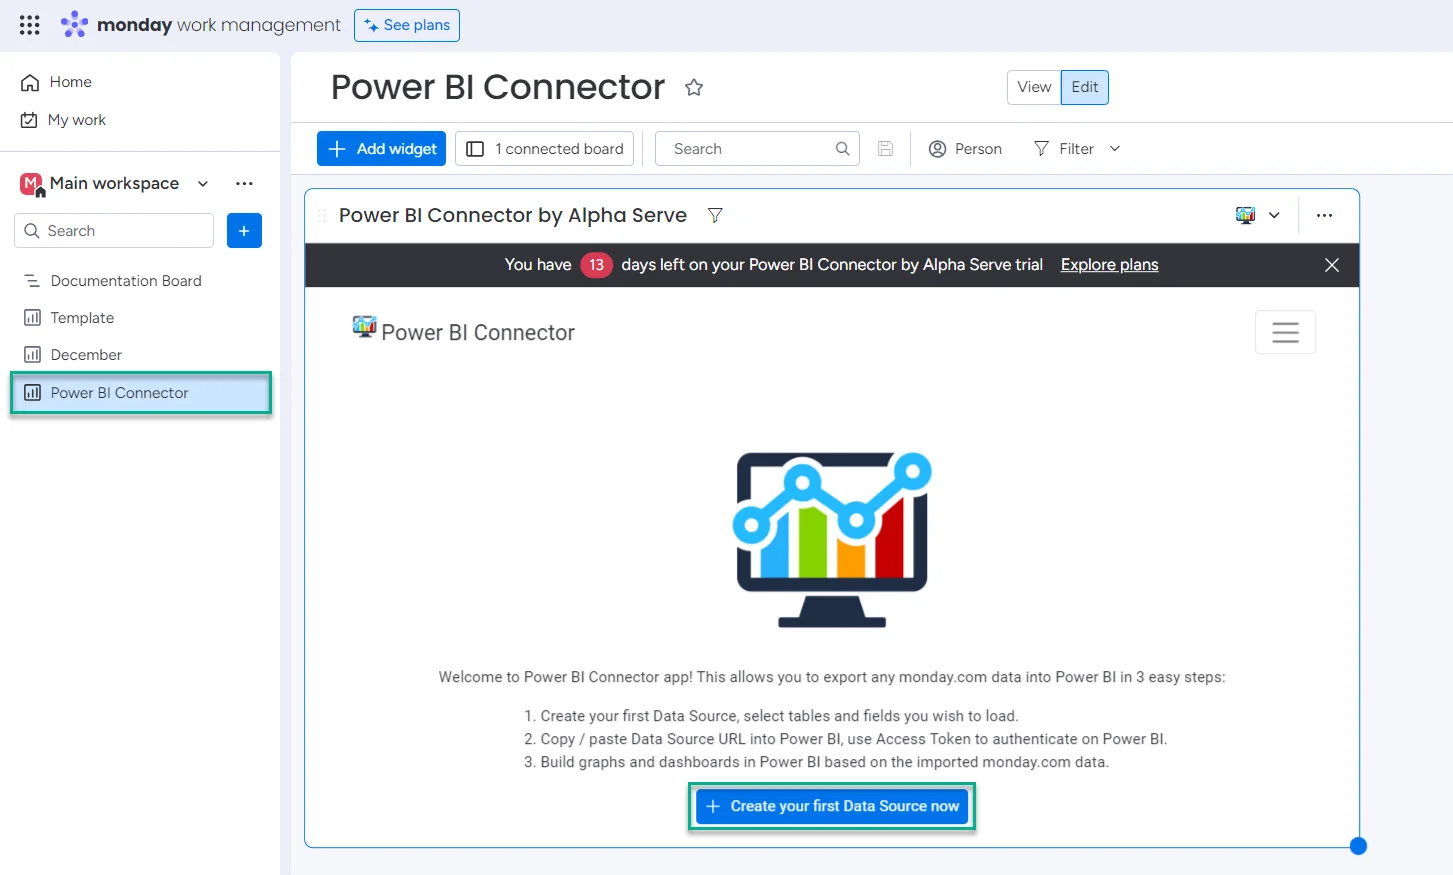
Name your data source, mention short description and choose filters and tables you want included in your data source.
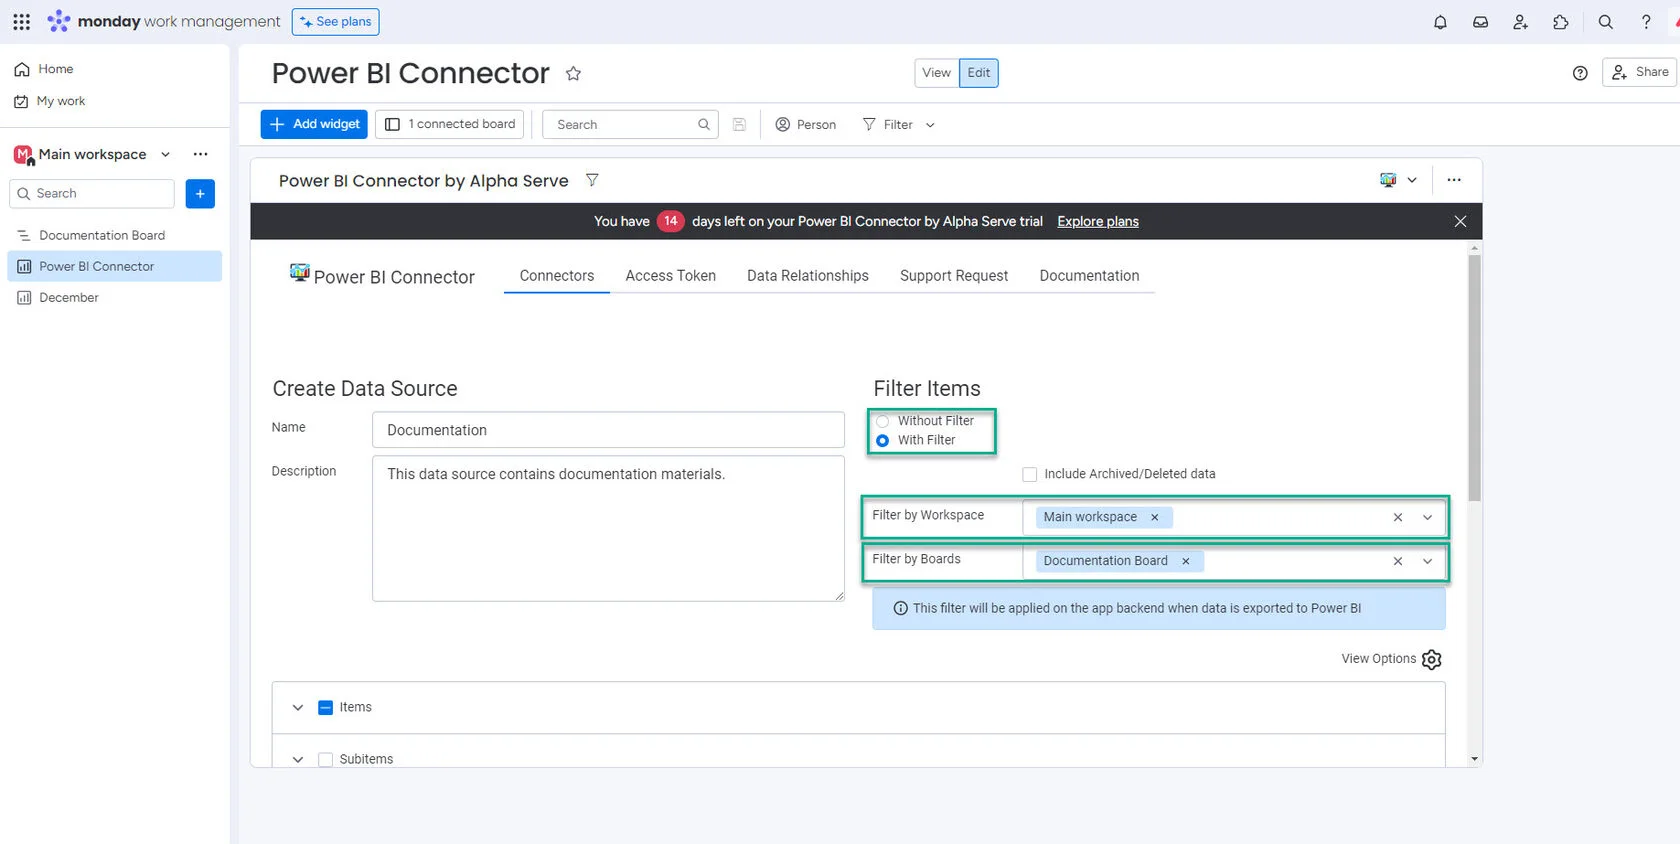
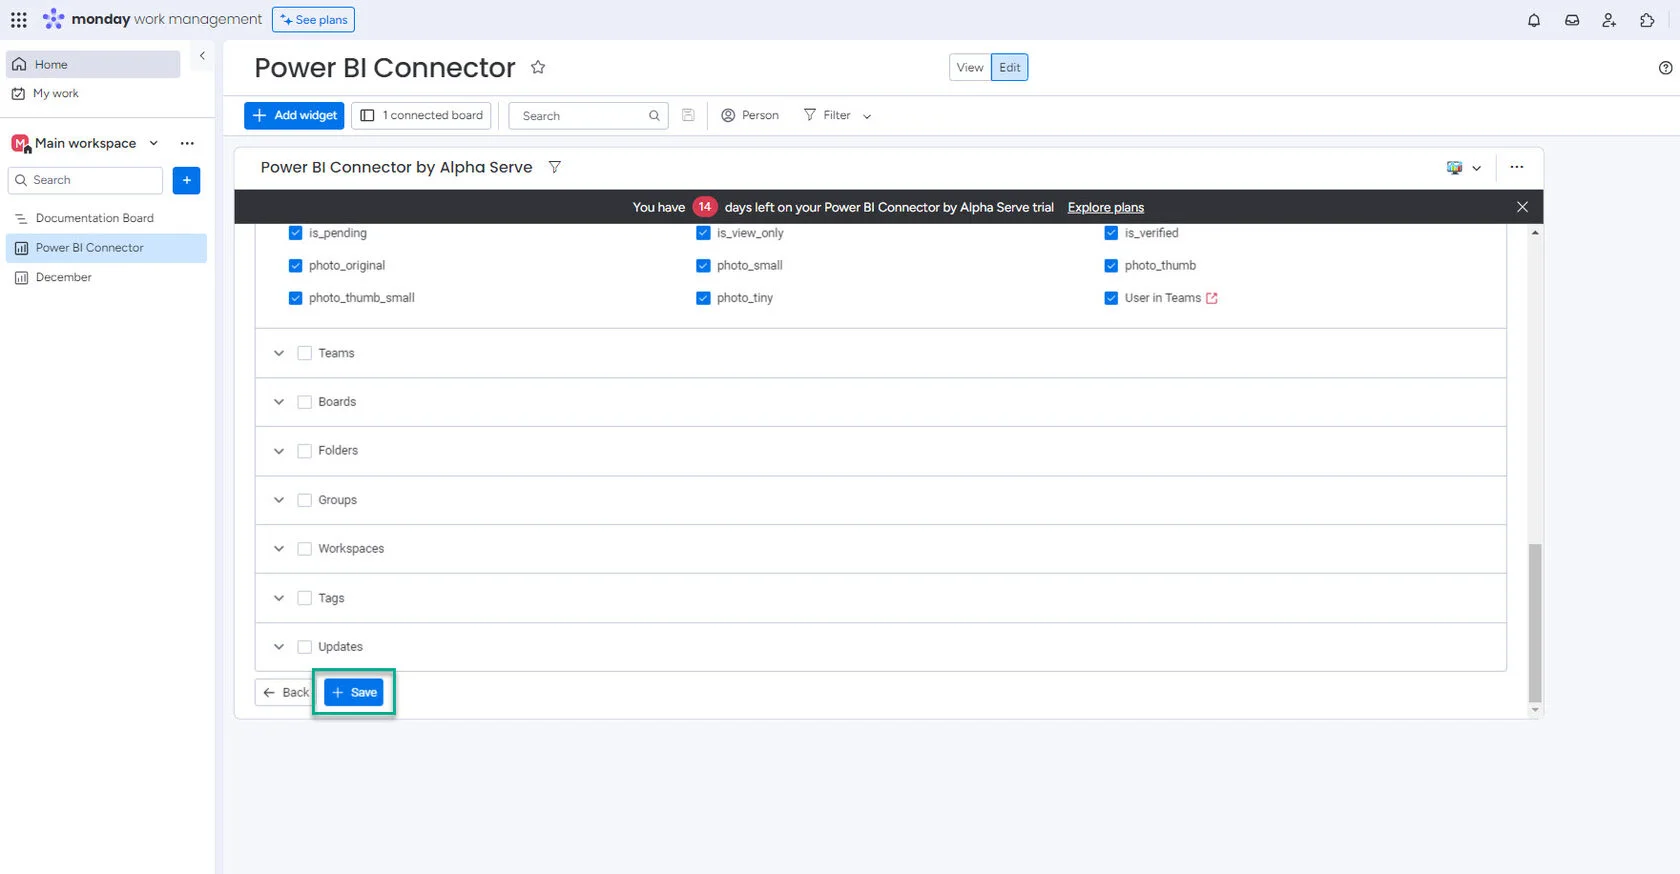
Choose all the tables and fields you wish to include in your data source. Click on "+ Save."
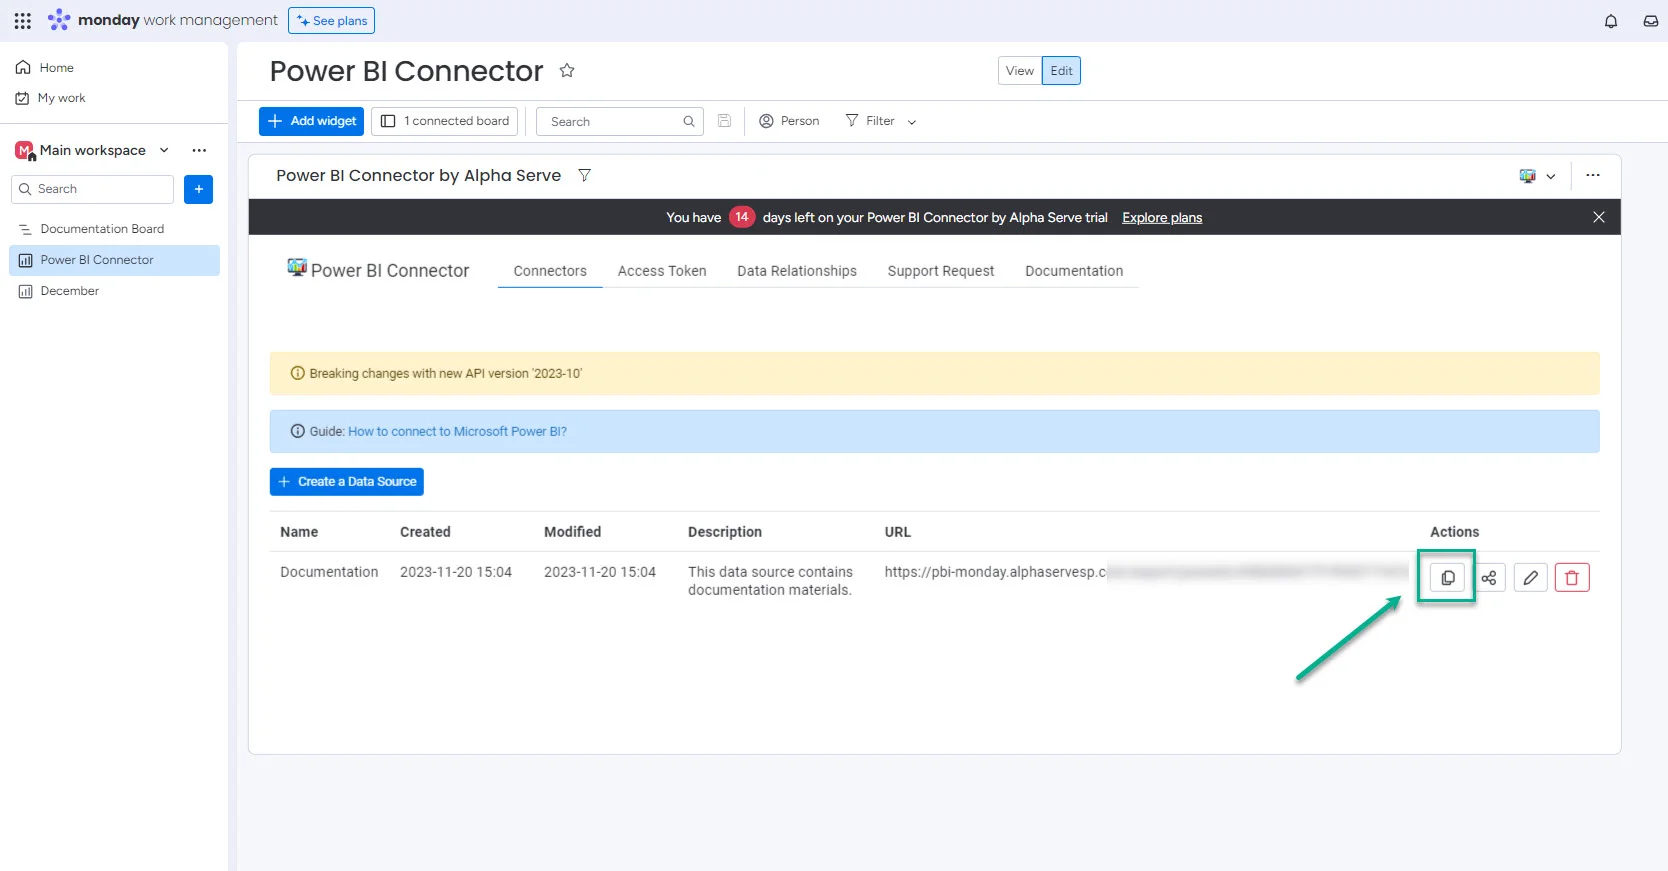
While logged into your monday account, open the Power BI Connector widget and copy the desired data source link.
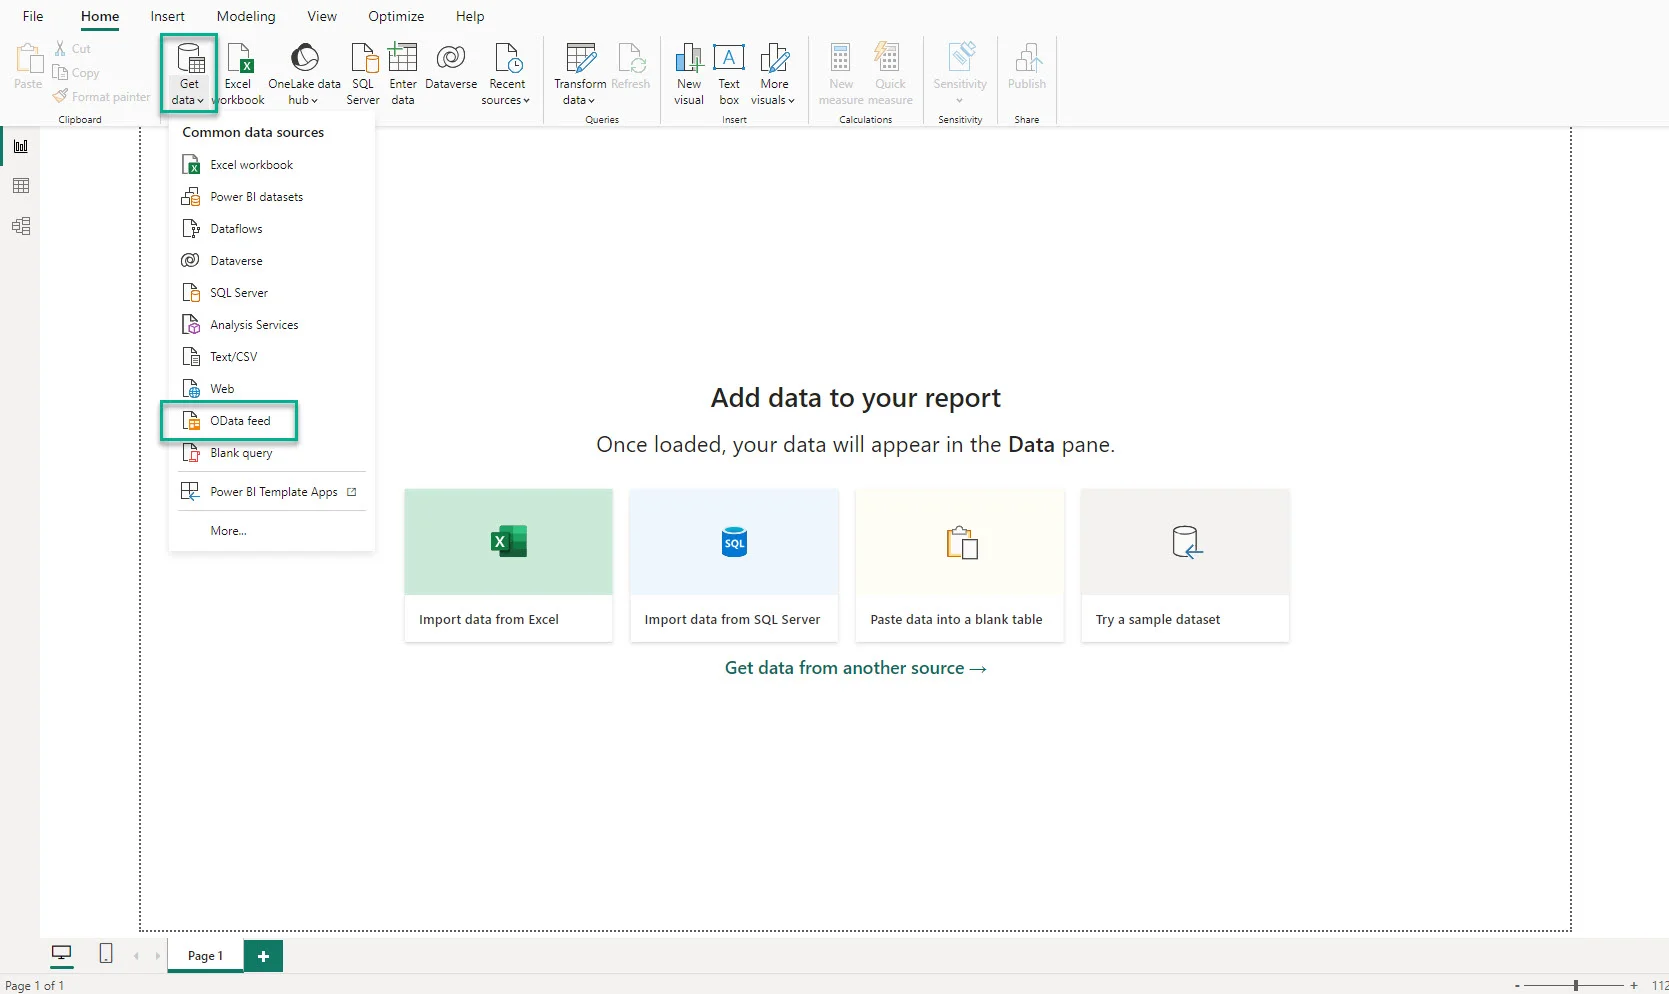
Open Microsoft Power BI Desktop, click "Get data," then choose "OData."
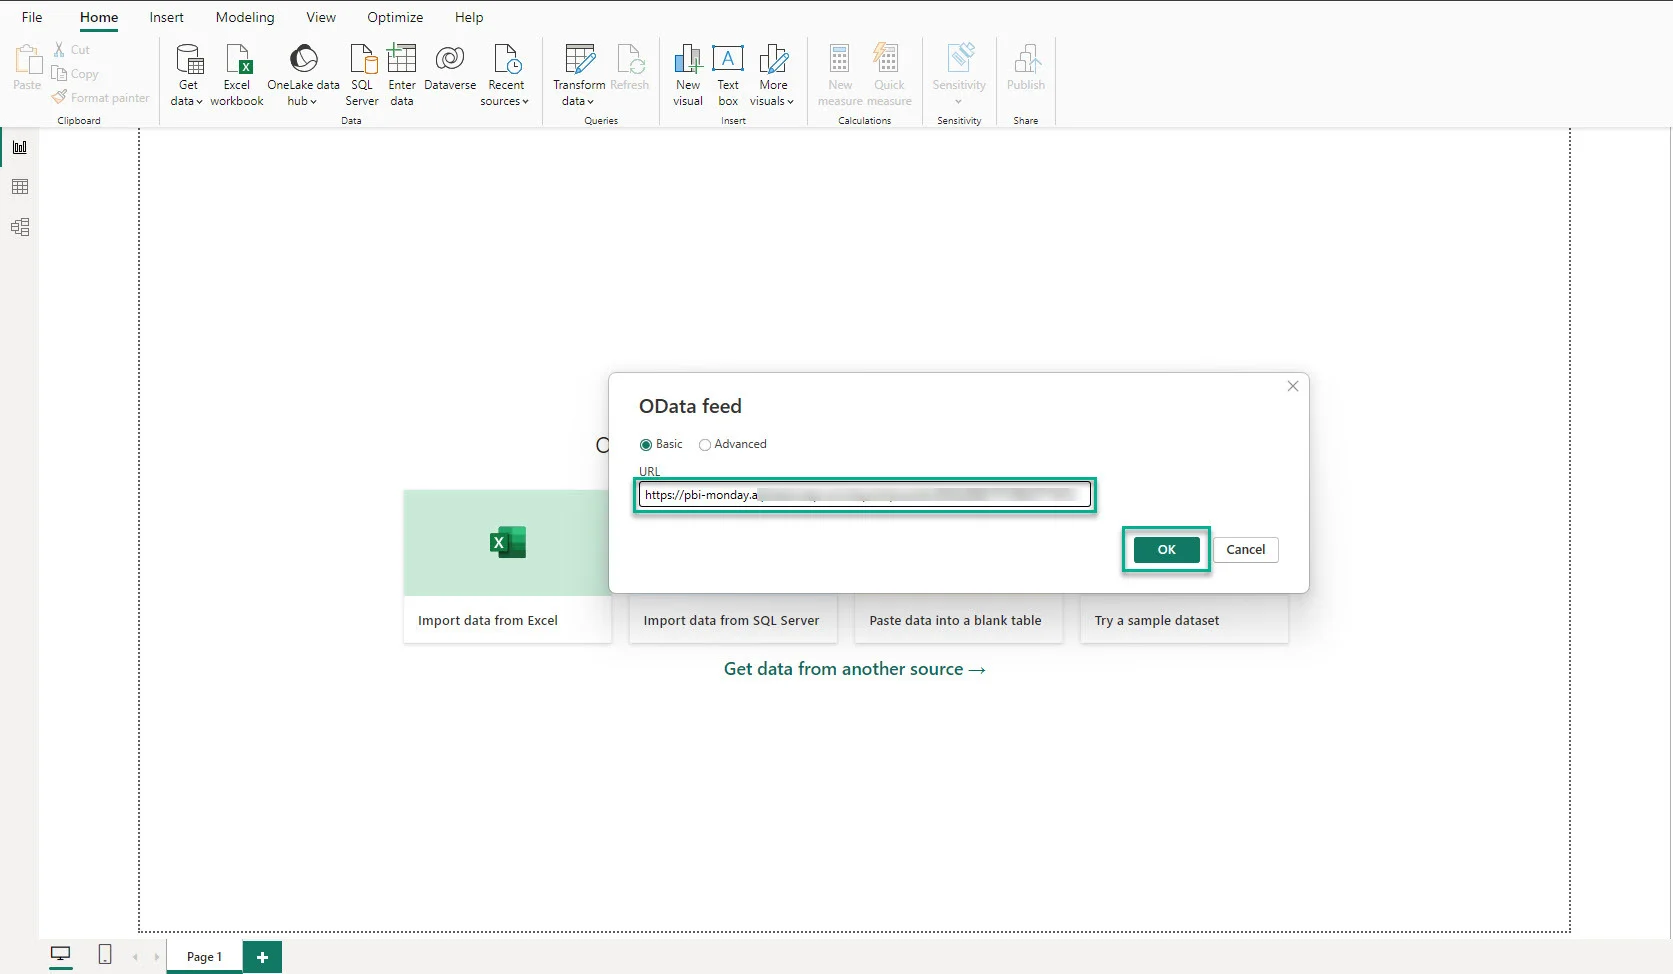
Paste the link of your data source into the URL field, and then click "OK."
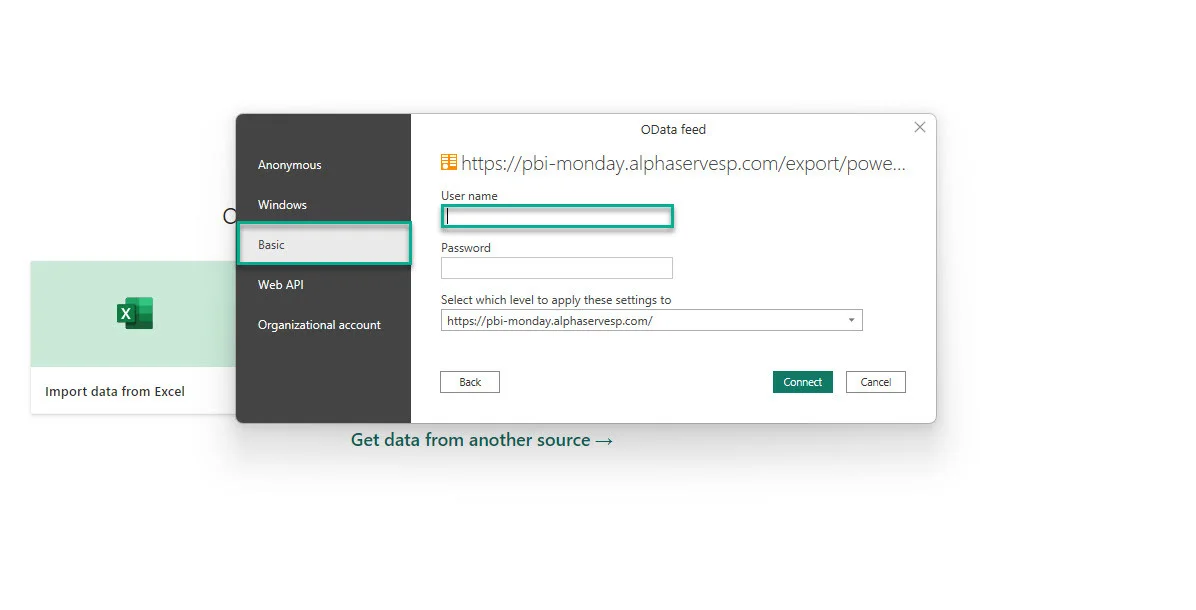
Choose Basic authentication. Leave the User name field blank.
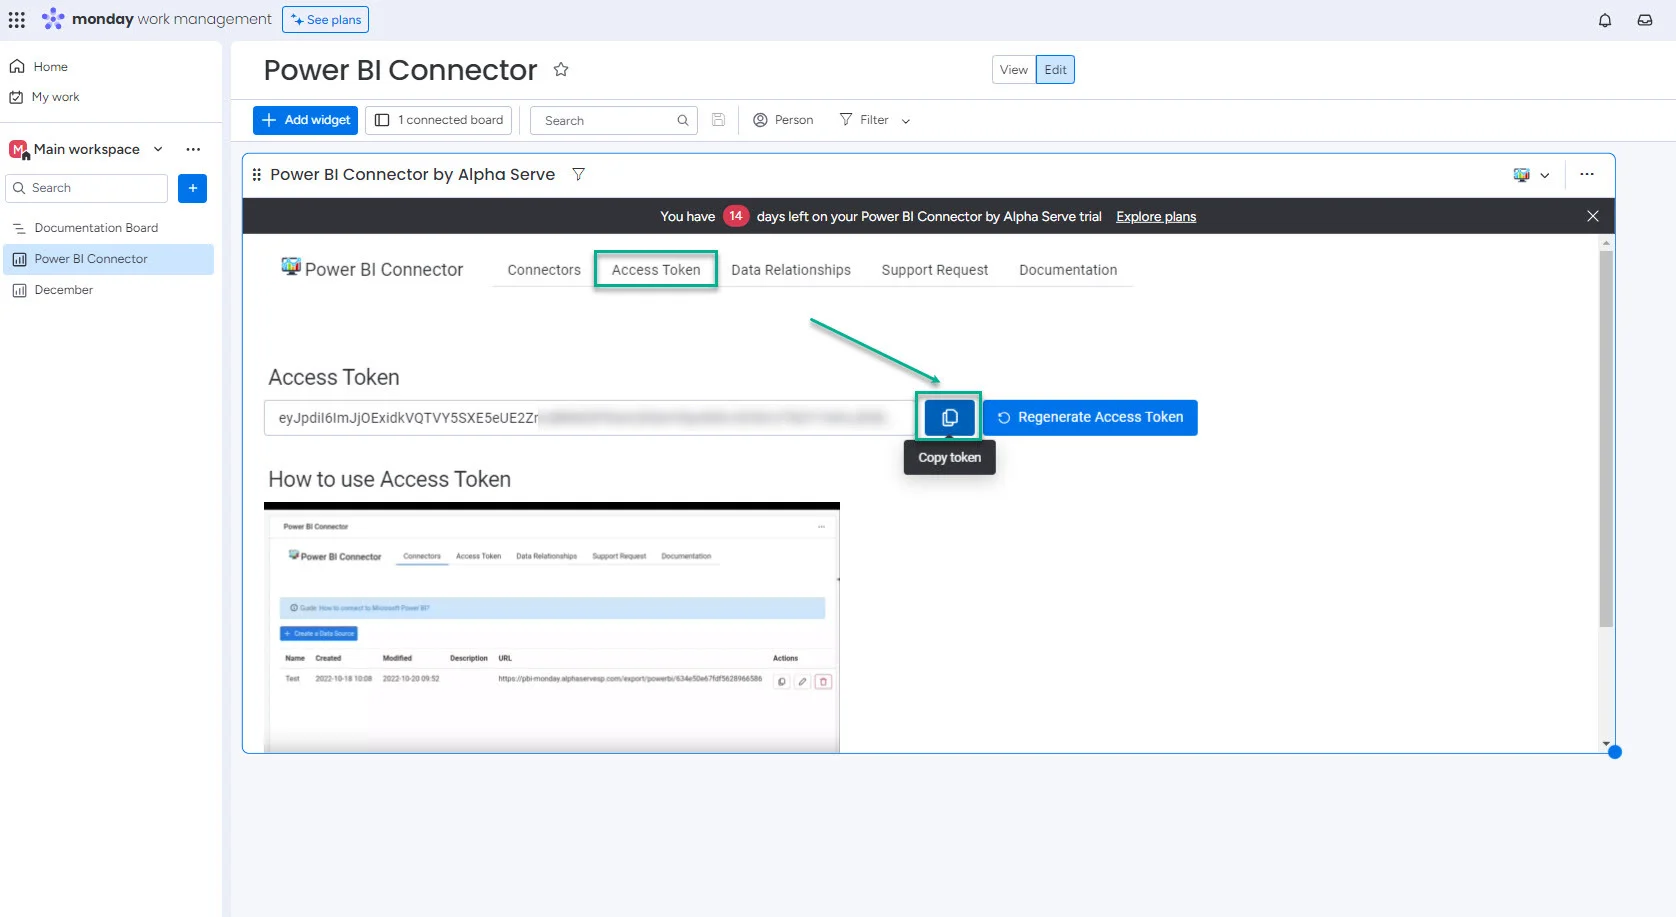
Return to your monday account, open the Power BI Connector widget, choose "Access Token," and then copy the token.
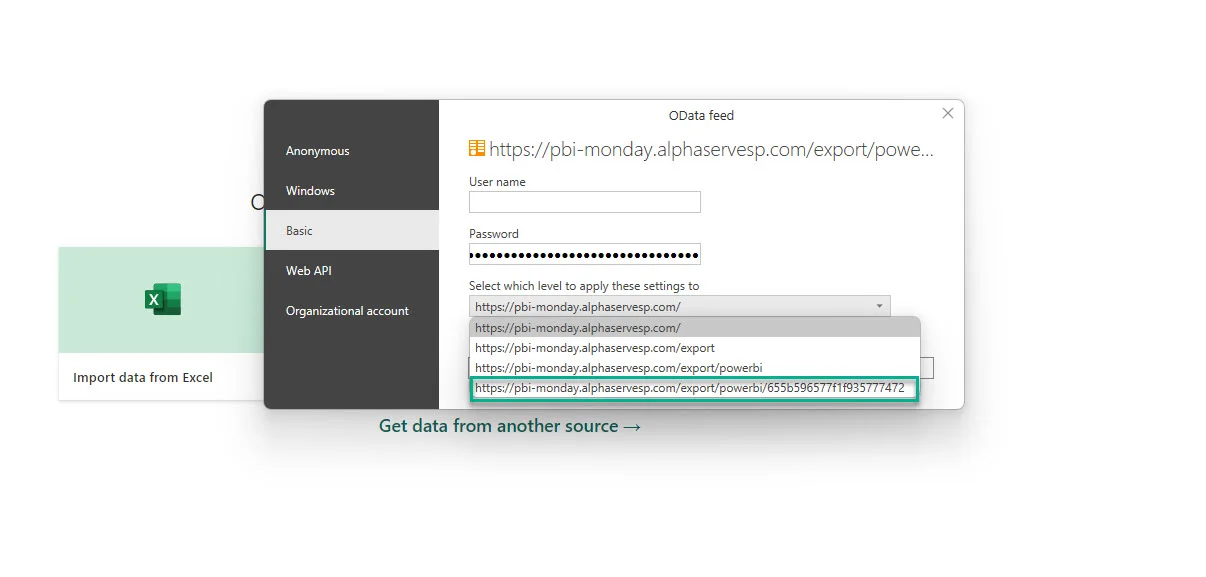
Return to Microsoft Power BI and paste the copied token into the Password field. Select the lowest level to apply the settings and click Connect.
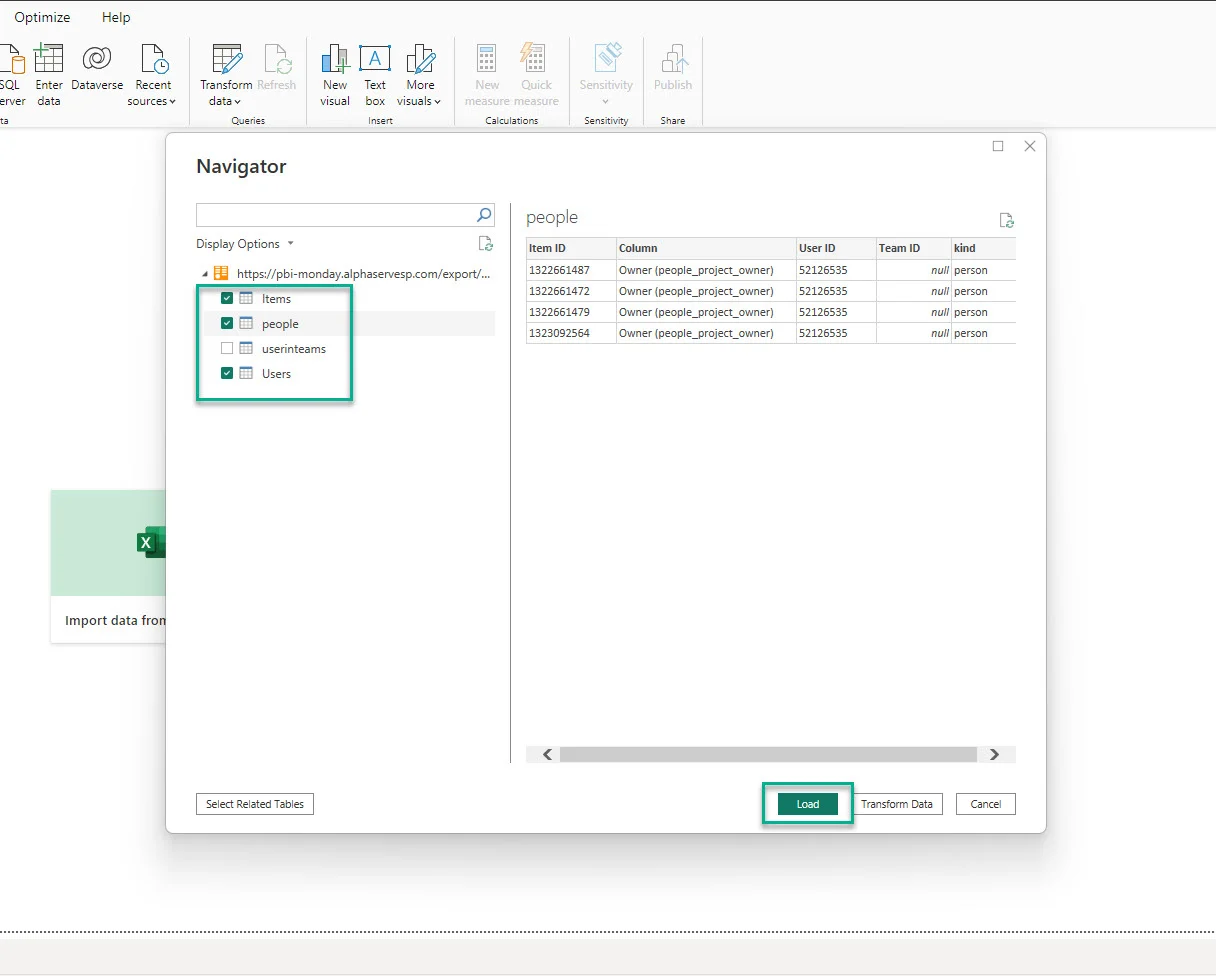
Choose the tables you require, and then click on "Load." If there's substantial data to import, it may take some time. Once the data is loaded, you can build graphs and dashboards using the imported monday.com data.
It is imperative to say that monday.com and Power BI can change how businesses look at data. After all, monday.com reporting is basic and only gives you essential information about your team collaboration and workflow. Connecting them provides you complete access to hidden insights in your data.
However, it must be done smartly and with the help of the Power BI Connector for monday.com. This automates the connection and ensures you only import the needed data without writing a single line of code.
Conflict is a constant presence in life. The pressure to deliver unique results on a short timeline adds to the pressure in the world.

Migrate to Jira Cloud with confidence. The software’s new features are exciting, and Atlassian provides resources to support a smooth transition.

Track key metrics in real time with a KPI dashboard. Learn how to build one, explore examples, and improve visibility using Tempo’s Jira-native tools.

Learn how various Jira custom reports can improve team efficiency and manage workloads while providing the necessary data for informed decision-making

Learn to create a project baseline to track progress, manage scope, and control costs for successful project management.

Strategic portfolio management keeps your projects and spend aligned with company strategy. Learn more about how it works and set it up in Jira.
Roadmaps are essential to bridge the gap between planning and action. Learn how to transform your roadmap into a dynamic, decision-ready tool.
Efficiency and effectiveness pull in opposite directions. Here's how project managers navigate both without sacrificing one for the other.

Leverage automation in Jira service desk to help your support team log their time without them doing any extra work.