How to export data from Jira: A comprehensive guide
Tempo Team
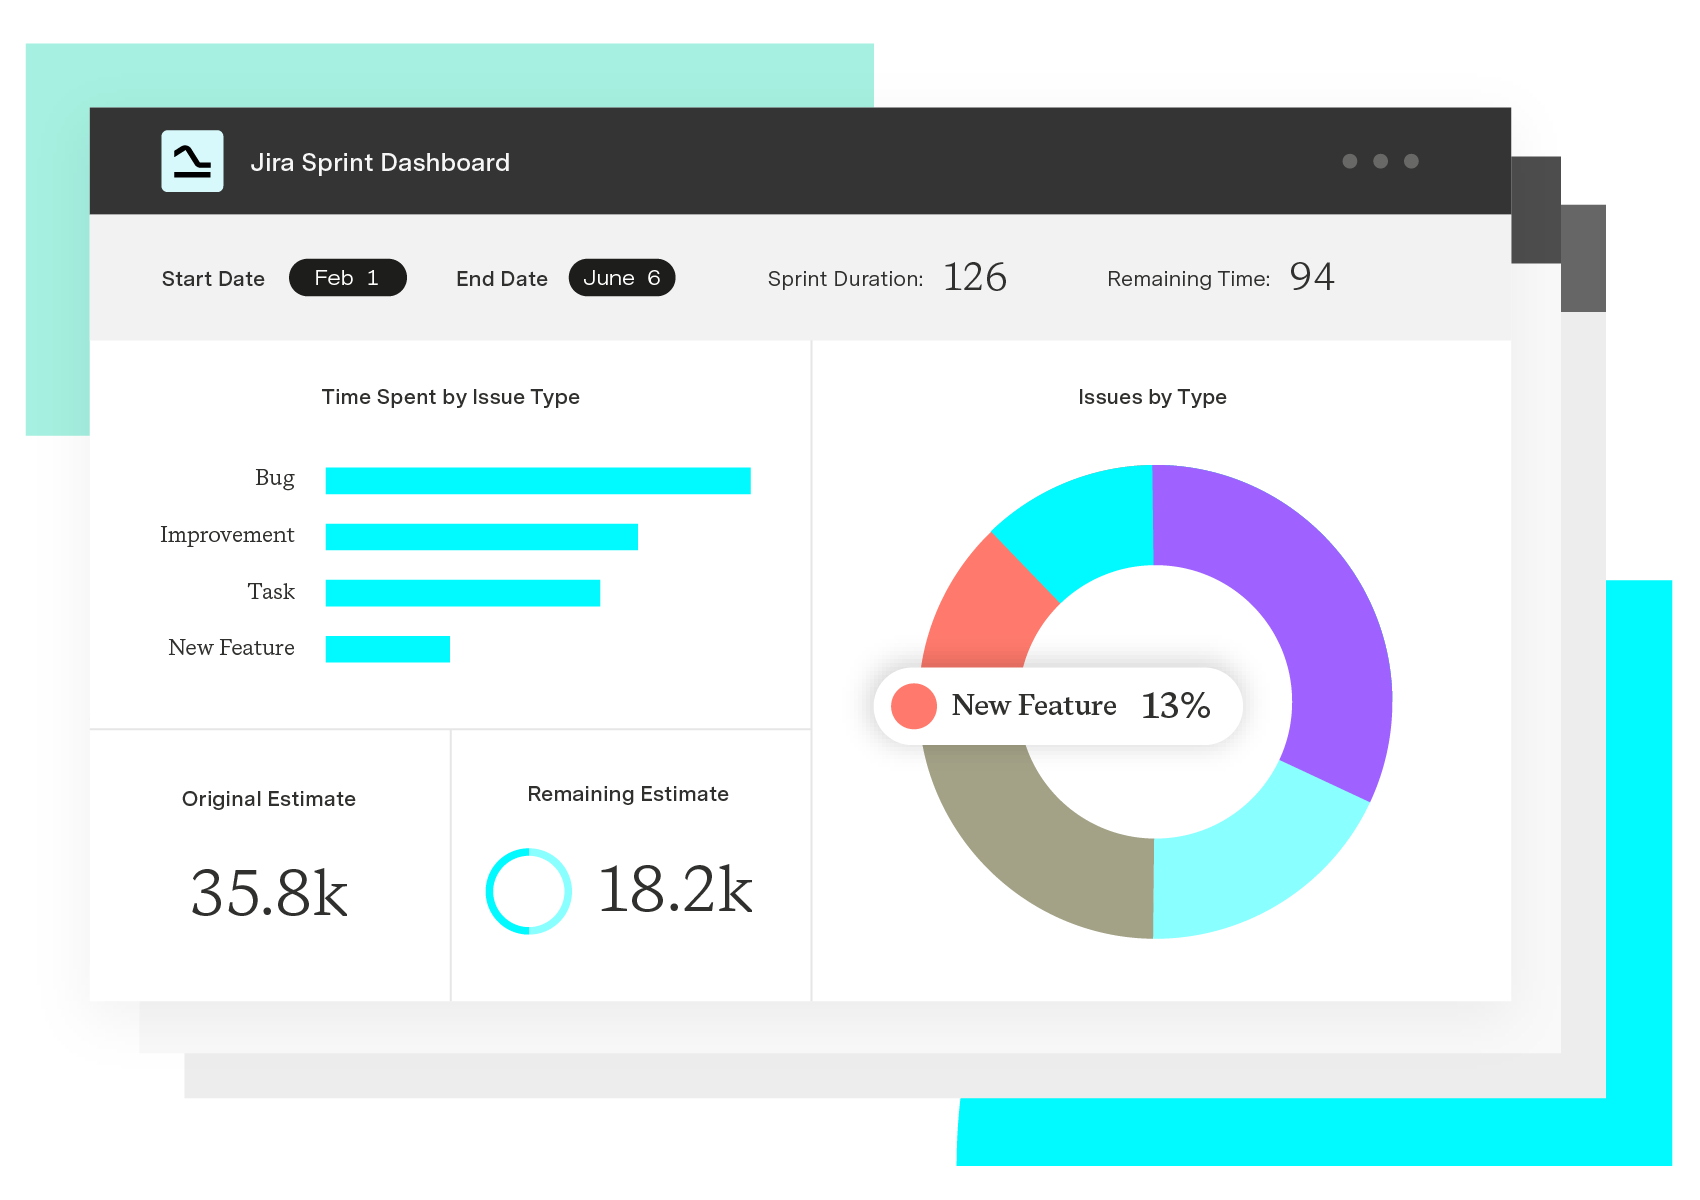
Although it’s an impressive tool for IT, service teams, and support specialists, Jira hasn’t achieved universal adoption. Colleagues and stakeholders outside technical departments likely have their own software for managing and crunching data. As a result, sharing information between departments can be challenging.
Thankfully, Atlassian has come to the rescue with integrations for Microsoft Excel, Google Sheets, and other file formats to support the cross-channel export of Jira data and reports. No matter your teammate’s preferences, you can provide them with the up-to-date Jira data they need in their preferred format.
Why should you export data from Jira?
As much as you and your team love Jira software, it doesn’t suit everyone’s workflow. Other groups use different tools, so you need to adapt to ensure successful collaboration. Consider these everyday situations where you would benefit from exporting Jira reports, issues, or other data:
External stakeholders: Clients regularly request detailed status reports on development or service projects in various formats, including XLSX, CSV, or PDF.
Excel spreadsheets: Management staff often use Microsoft tools to analyze data and generate reports or presentations. Save them time by exporting Jira to an Excel file so they can start work ASAP.
Jira audit: Audits are a regular part of Jira maintenance, tracking key activity, diagnosing performance issues, or ensuring security compliance. However, conducting a Jira audit within the platform requires hours of training. Instead, you can export the raw data into a format that works with tools you’ve already mastered.
SLA compliance: When overseeing support services with Jira Service Management (JSM), you may need to provide managers and customers with statistics about SLAs that the standard reporting functionality doesn’t include. Exporting Jira to an Excel report, PDF file, or CSV format for analysis ensures compliance.
Migration: You may occasionally need to relocate data from one environment to another – moving between Jira Data Center and Jira Cloud, Jira and Confluence pages, or between instances. In those cases, you can migrate data across environments using a CSV archive. First, export the issues from the old instance into a CSV file, then import them into the new target.
Which data can you export from Jira?
Jira aggregates a lot of data, so it’s essential to know what you can and can’t export to avoid missing out on any info vital to your project. Jira permits you to download the following data:
Users
Anyone who leverages Jira to manage their work is considered a user. You can export a list of all users within your account or specific team members, such as assignees to a particular project.
Groups
When you organize users into a team with identical permissions and access rights, they’re labeled a group. You can export a list of all groups within your account or select teams based on a shared criterion.
Issues
You can select issues for export from any Jira instance by searching for:
Name
Status
Project
Fields
It can include basic ticket information such as issue type and status or additional data, like:
Who logged the ticket
Date and time of creation
Edit history
Comments
Usually, you’ll use this information for archiving or reporting purposes, so exporting it as a CSV or XML file is the best option.
Boards
Agile teams using Kanban boards or Scrum boards can download their Jira board to Excel using a third-party app, like the Midori Excel Exporter, from the Atlassian Marketplace. Whatever your framework, you can export the Jira backlog to Excel in its entirety or by sprint, status, or epic reports.
Sign up for a demo
Request DemoHow to export data from Jira? 5 methods
Exporting issues from Jira into the format of your choice is simple, requiring only a few keystrokes using functionality integrated directly into the platform. The method is similar no matter what Jira version you use, whether Jira Cloud or Server/Data Center.
Export issues from Jira to Excel
Jira includes built-in export functionality to simplify downloading data into an Excel file using the Advance Search feature. To start, select “Filters” from the top navigation bar, click “Advanced Issue Search,” and conduct a JQL query. If you’re already on a Jira project page, navigate to the “Issues” panel and filter for the ones you wish to export.
Once you have your list of issues, click “Go to advanced search.”
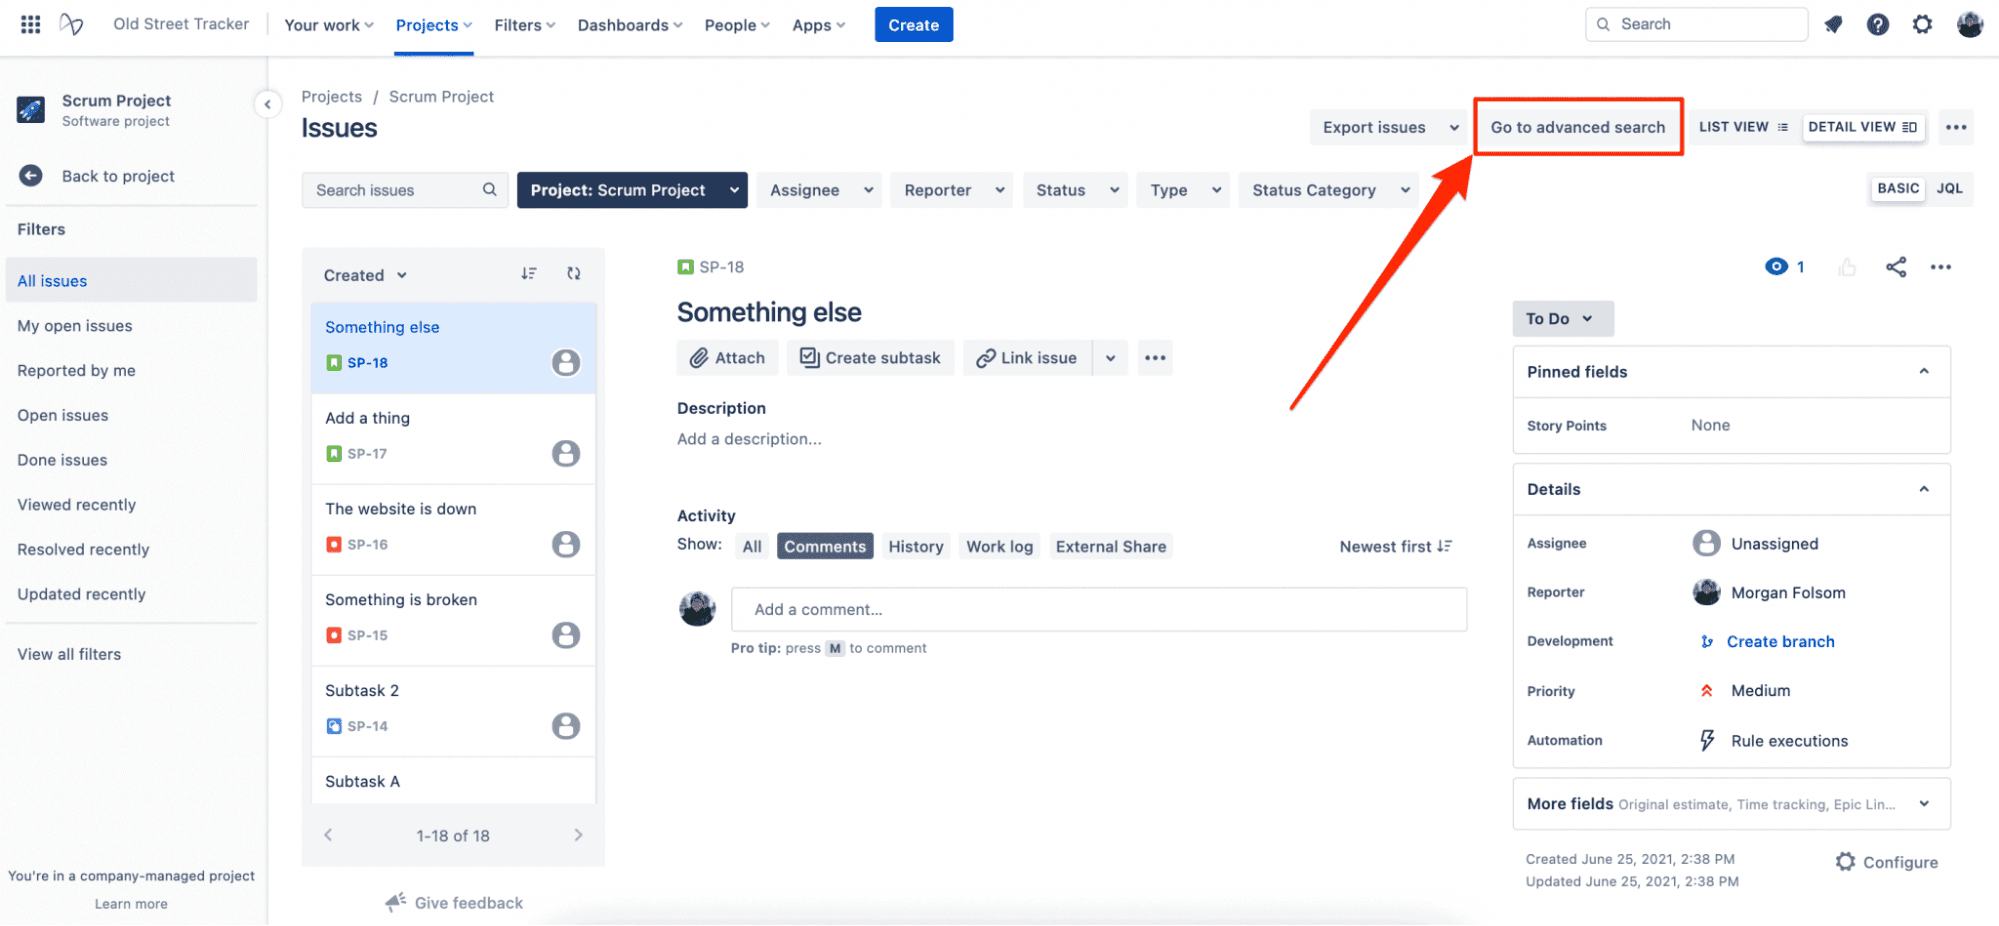
Clicking this button will take you to a new panel with additional icons at the top right of the screen.
(Source: Old Street Solutions)
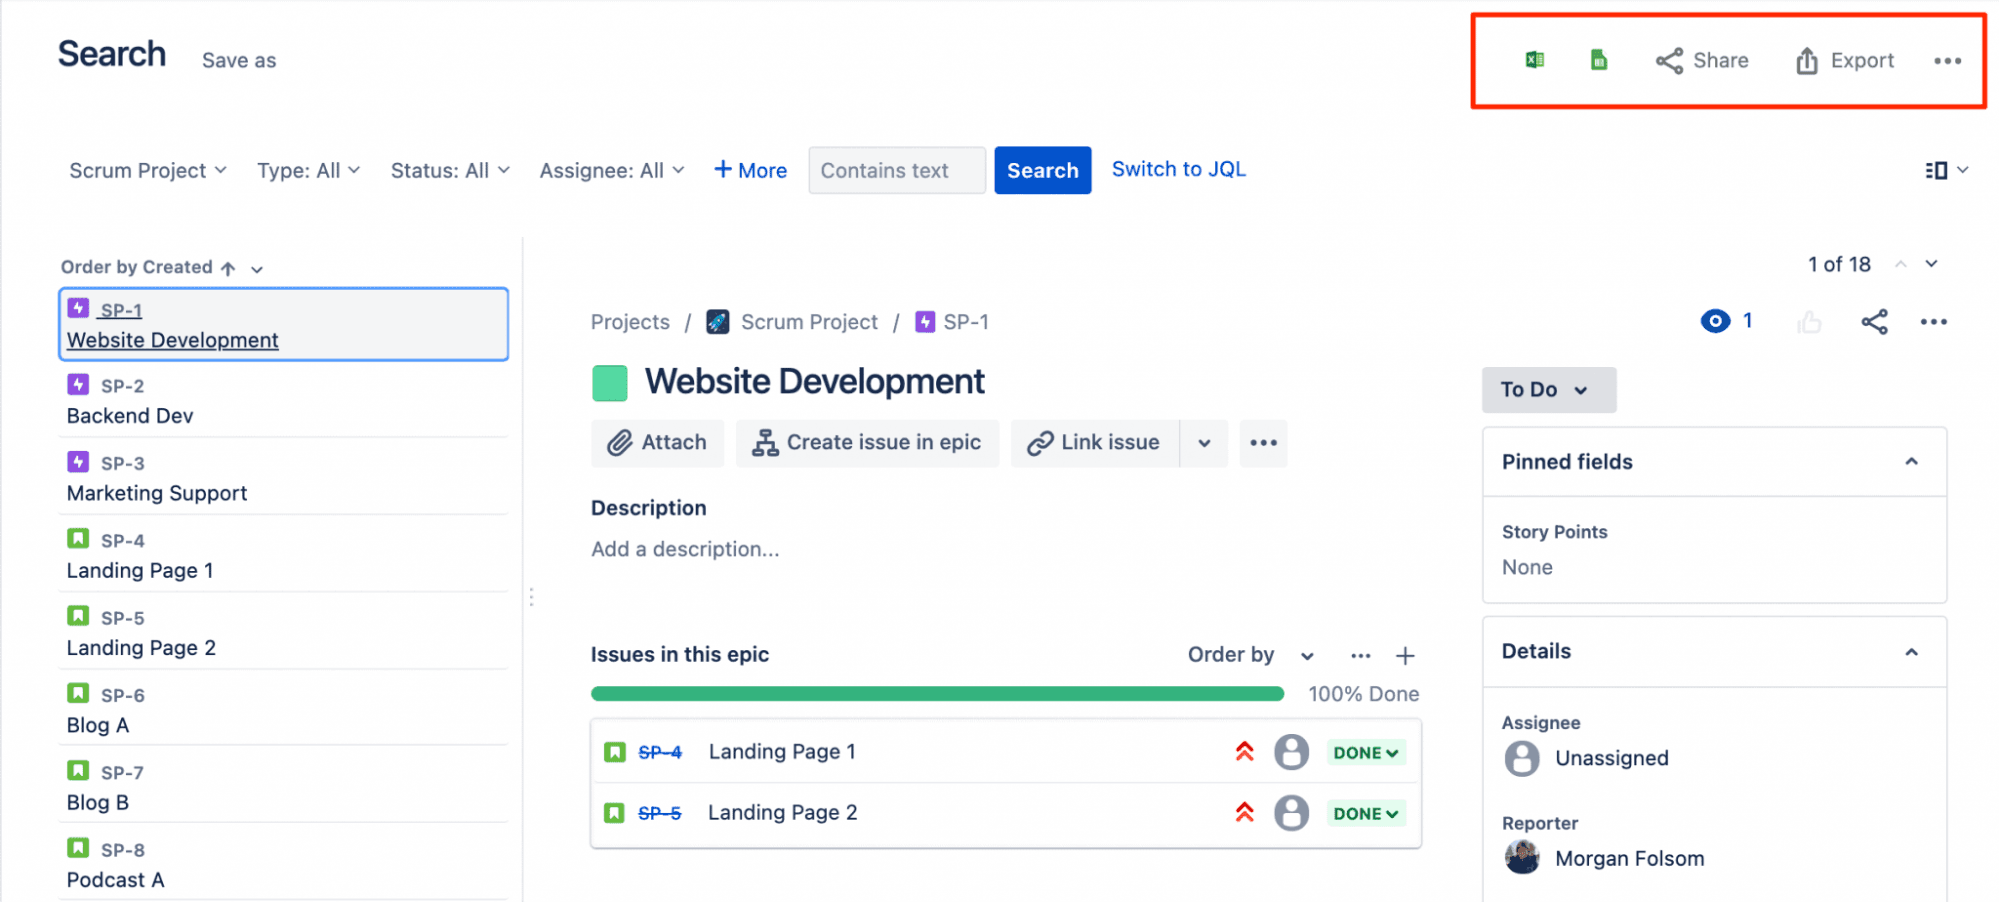
Click the Excel icon. The system will ask to connect with your Microsoft account. Then, the Jira data will migrate to Excel so you can begin your work.
Updating your Jira data in Excel
If you regularly use Jira data to create status report spreadsheets for daily standups or weekly reviews, you can save time by automatically updating the information in your Excel file.
To configure your Excel automation, return to your Jira advanced search page, select “Export to Excel,” and then select whether you’re an Excel online or desktop user. If you choose “Desktop,” you’ll open a “New Office Add-in” box describing “Jira Cloud for Excel.” Click “Trust this add-in” to authorize Excel in your browser.
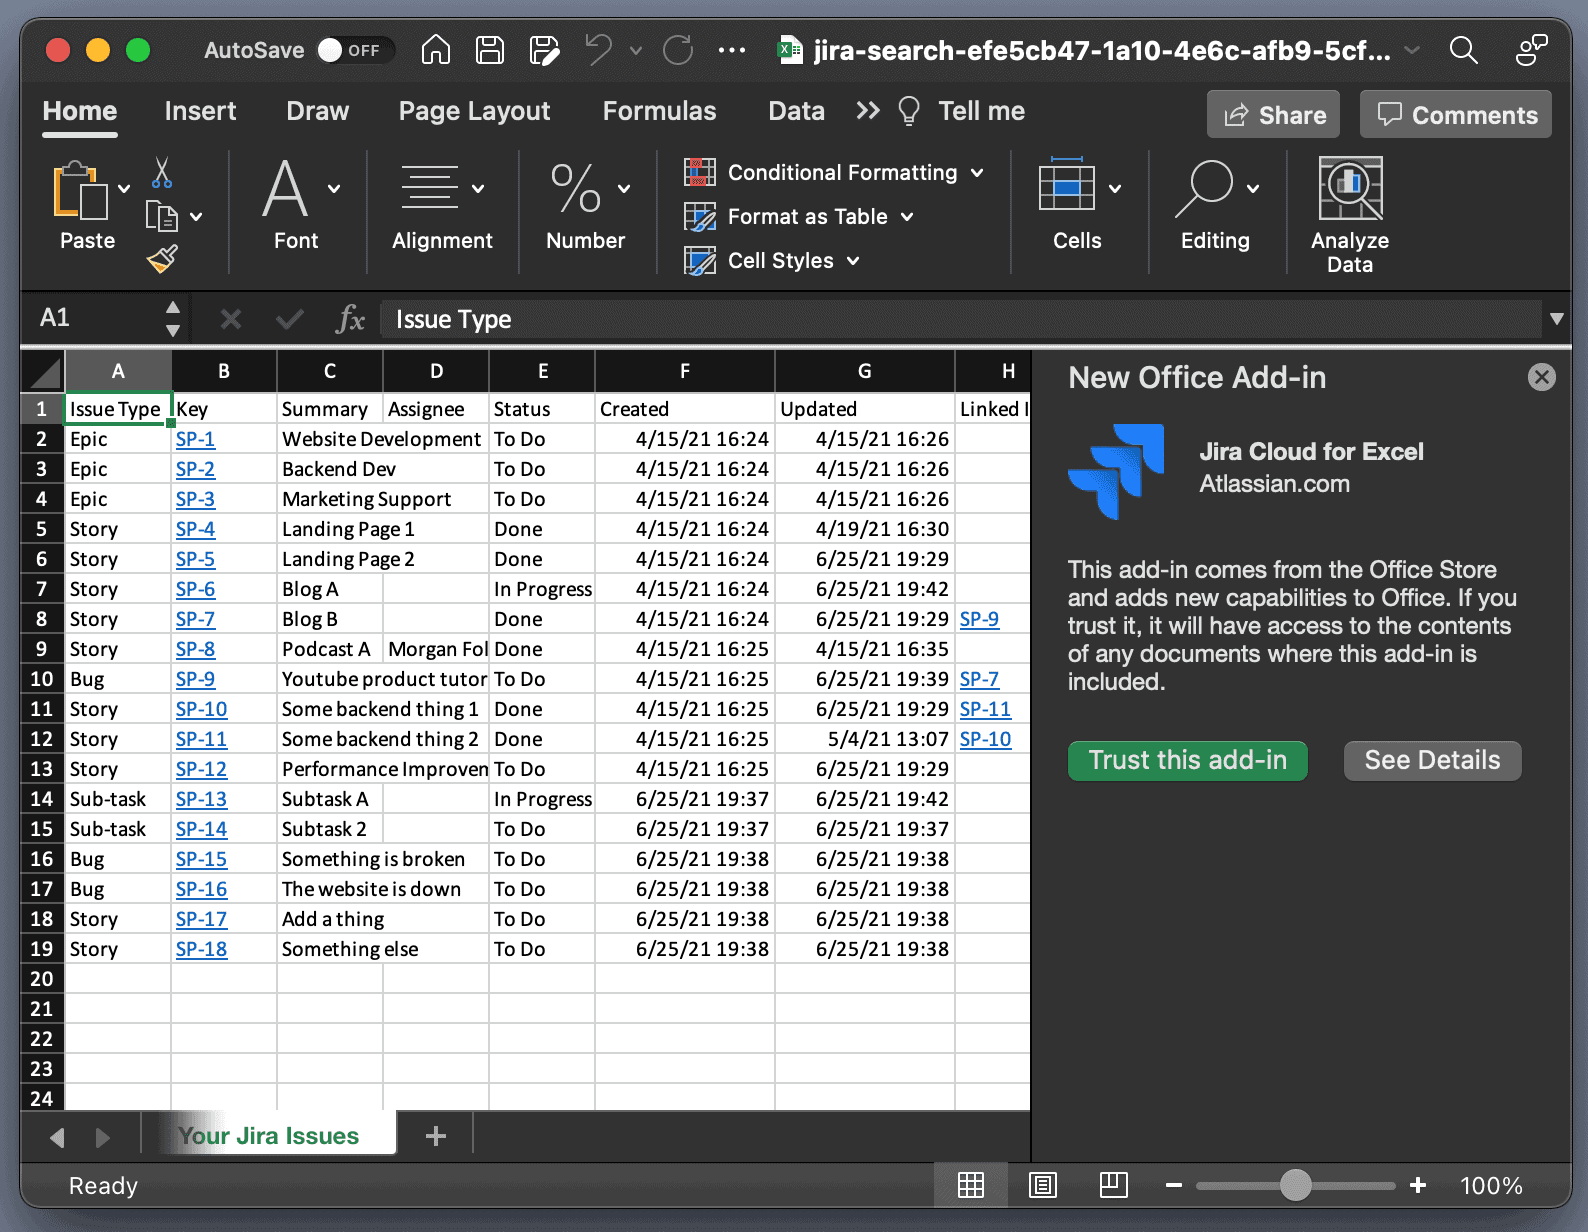
(Source: Old Street Solutions)
If you’re starting from a blank page, you can enable this feature by selecting “Insert” from the navigation bar and clicking “Add-ins.” You’ll find yourself on the Microsoft Office Add-ins store. Search “Jira Cloud for Excel” and click “Add” from the landing page.
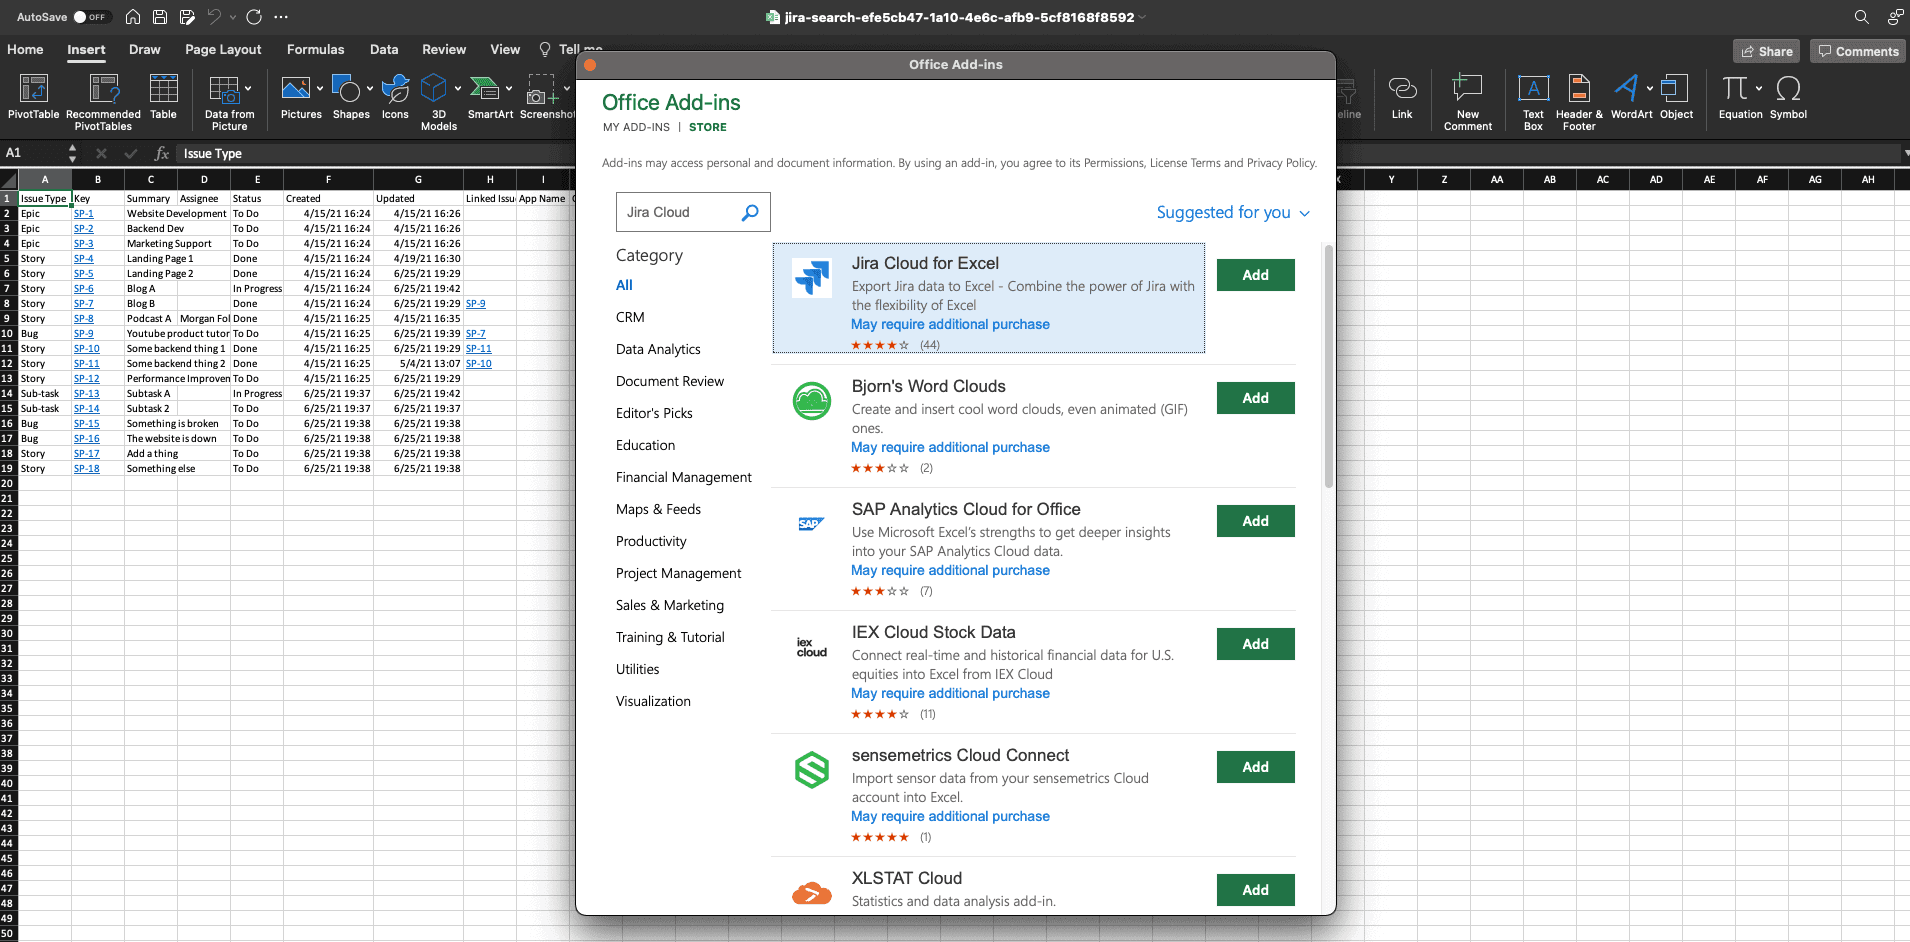
(Source: Old Street Solutions)
Finally, you need to configure this app using the panel on the right side of your spreadsheet. Define your “Issues” and “Fields” options before moving on to “Update.” Set your sheet to automatically refresh whenever you open the file or opt for a manual push to sync your spreadsheet with the current Jira data.
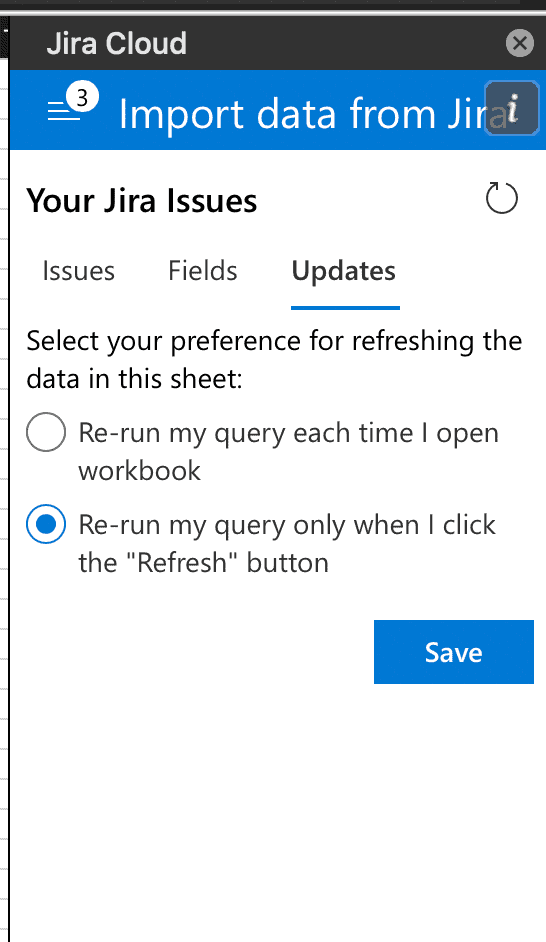
(Source: Old Street Solutions)
Export data to Google Sheets
The process for migrating Jira data to Google Sheets is similar to the Excel method. Select “Filters” from the navigation bar and click “Advanced Issue Search” to run a JQL query. If you’re already on a project page, click over to the “Issues” panel and select the issues for export. Now click “Go to advanced search.”

Instead of selecting the Excel icon, click on the Google Sheets graphic.
(Source: Old Street Solutions)
Grant Jira permission to connect with your Google account to begin downloading to Sheets, and you’re done.
Updating your Jira data in Google Sheets
Google Sheets also comes with a configuration to allow automatic updates from Jira.
From a blank spreadsheet, click the “Install now” button beside the description of an add-on app called “Jira Cloud for Google Sheets.” You’ll navigate from Google Sheets to the GSuite Marketplace to download the add-on.
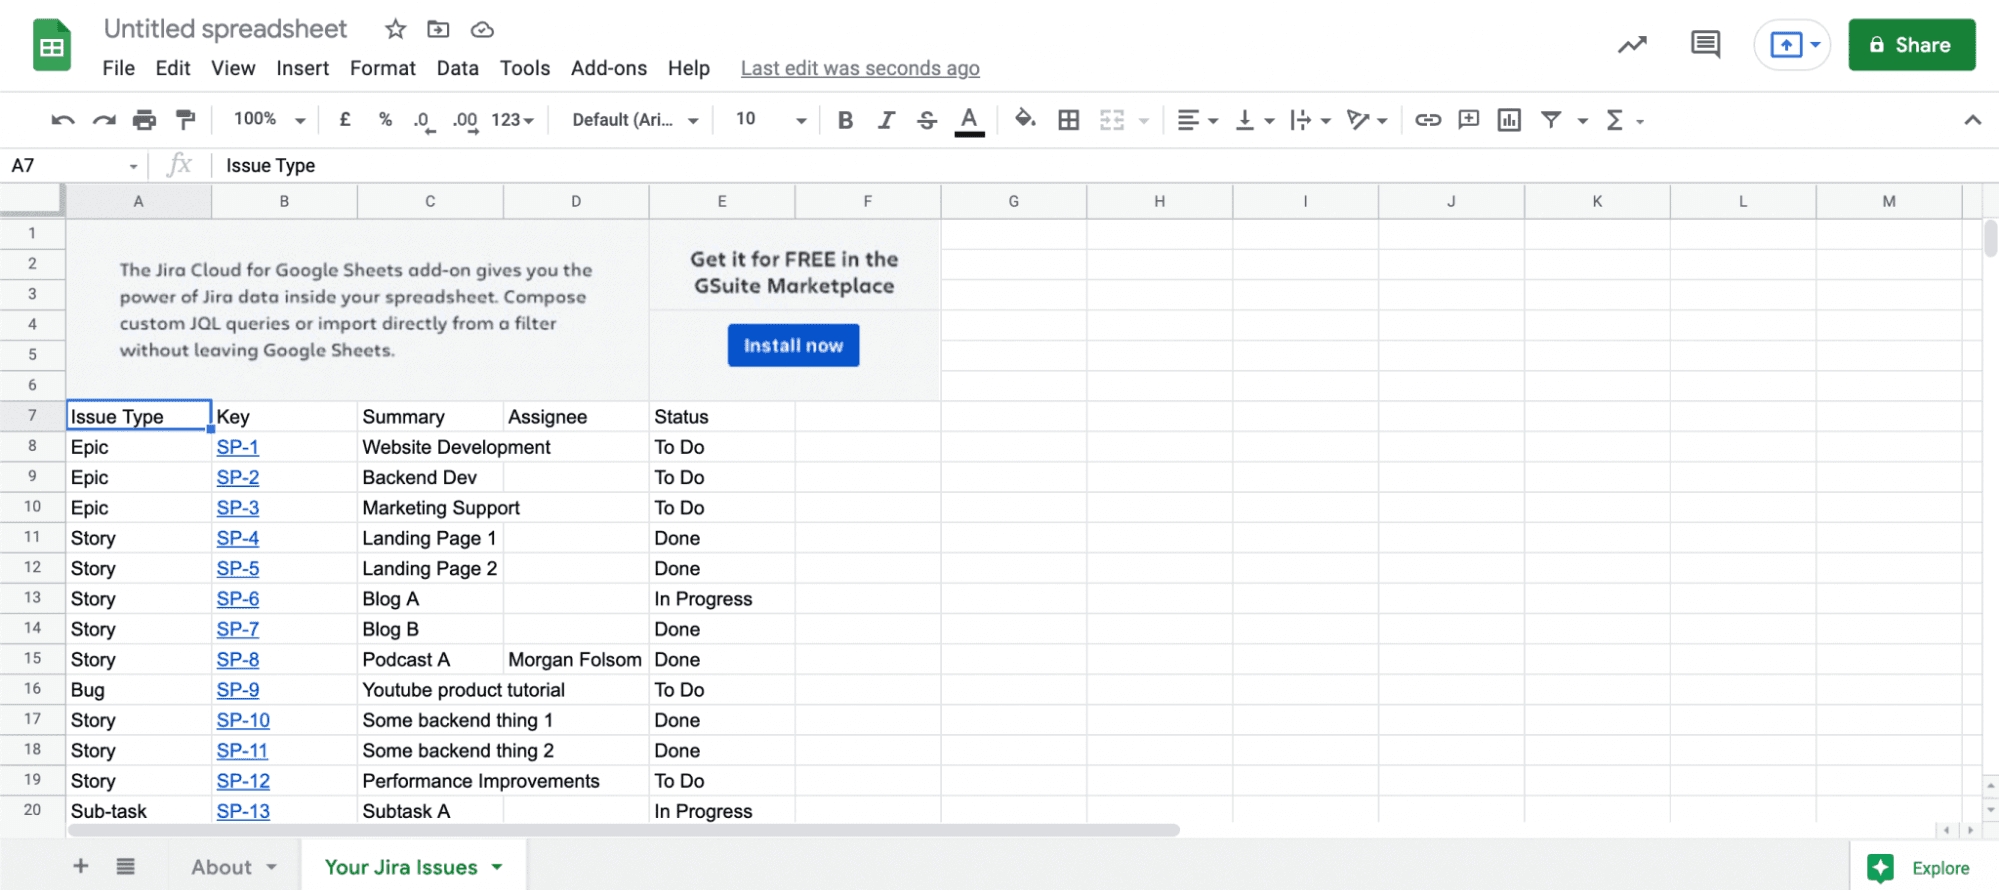
(Source: Old Street Solutions)
Once installed, go back to Google Sheets and select “Add-ons.” Click “Jira Cloud for Sheets” from the drop-down, followed by the “Open…” button to launch the Jira integration within your spreadsheet.
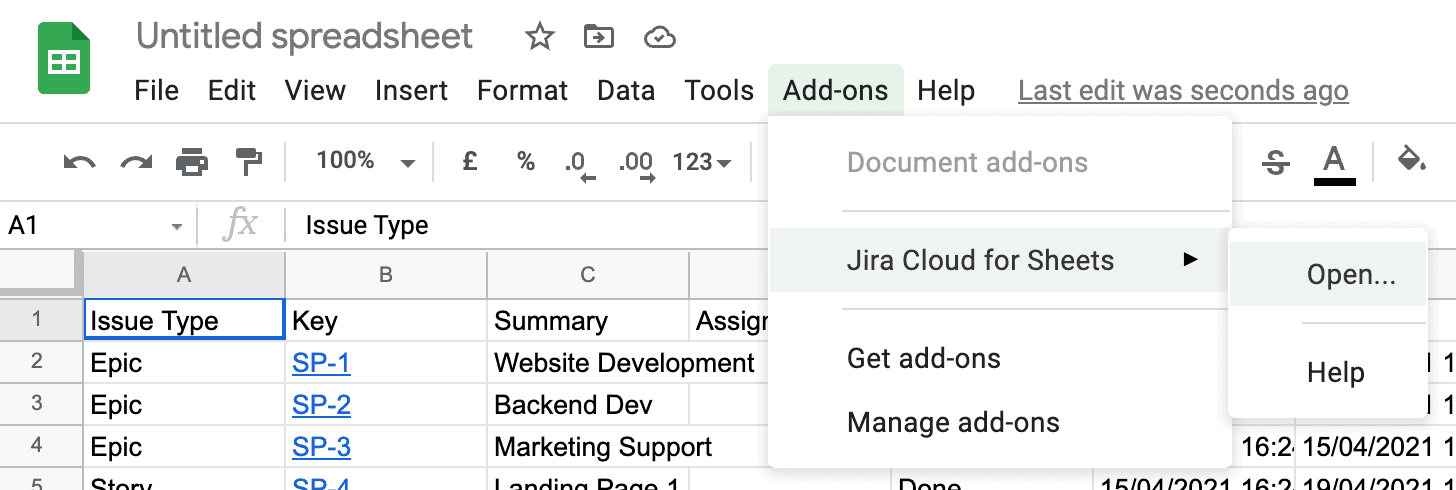
(Source: Old Street Solutions)
Next, you’ll see a window similar to the Excel version. Select “Get issues from Jira,” then scroll to “Schedule data refresh” to set the timetable for your updates.
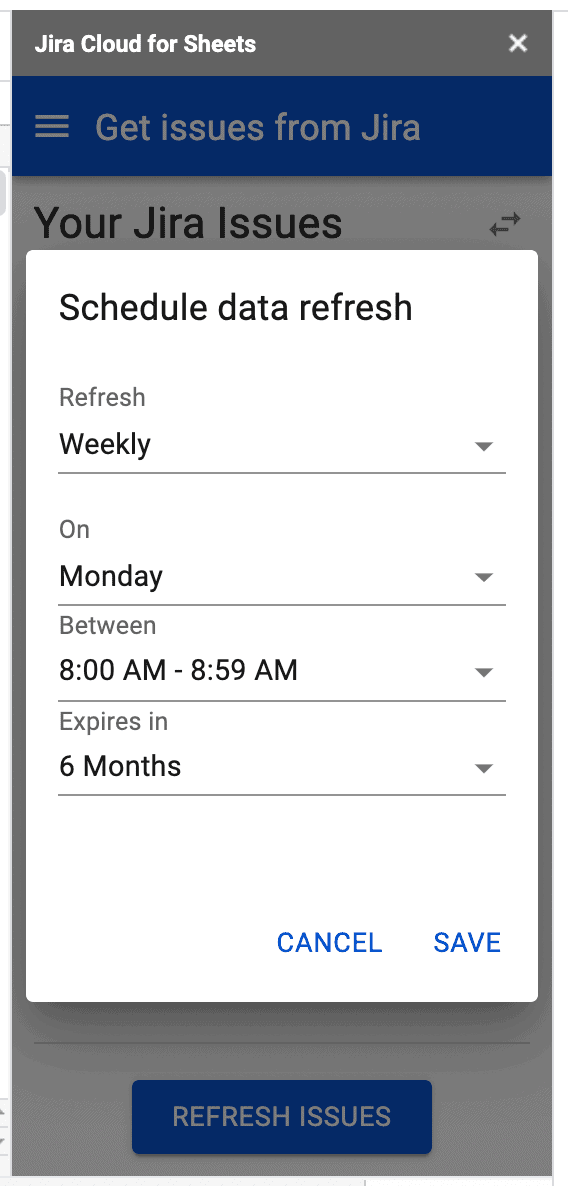
(Source: Old Street Solutions)
Click “Save,” and voilà! Automatic updates to your Google Sheets.
Export Jira data to a CSV file
As with Google Sheets and Excel, the best place to start your CSV export is from the Issue navigator and then searching for the items you’d like to download using JQL Advanced Search.

(Source: Atlassian)
Once you’ve located your issues, click on the “Export” button at the top right corner of the Issue navigator.
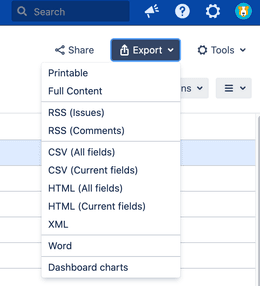
(Source: Atlassian)
Scroll the drop-down menu and select “CSV (All fields)” to download data into a CSV file.
If you prefer working in Custom Charts for Jira Reports, you can export Jira charts and data directly from the reports page to a CSV file. Simply click the overflow menu icon at the top right of your report, then select “Export CSV.”
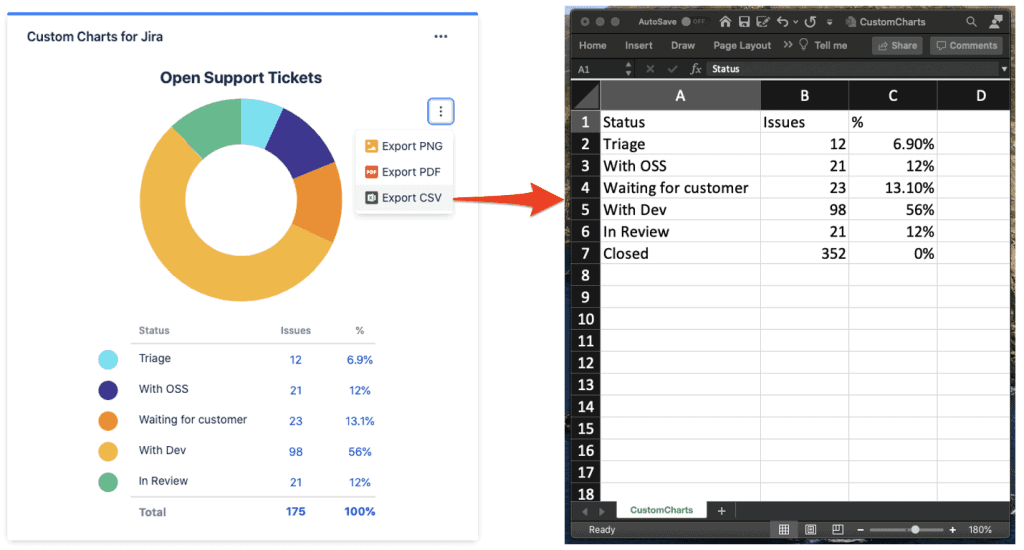
(Source: Old Street Solutions)
Export Jira reports to PDF
PDFs are the go-to format for sending reports to stakeholders as an email attachment. The process is virtually the same as sending a report from Custom Charts to CSV. Click the overflow icon at the top right of the report, then select “Export PDF” to download the file.
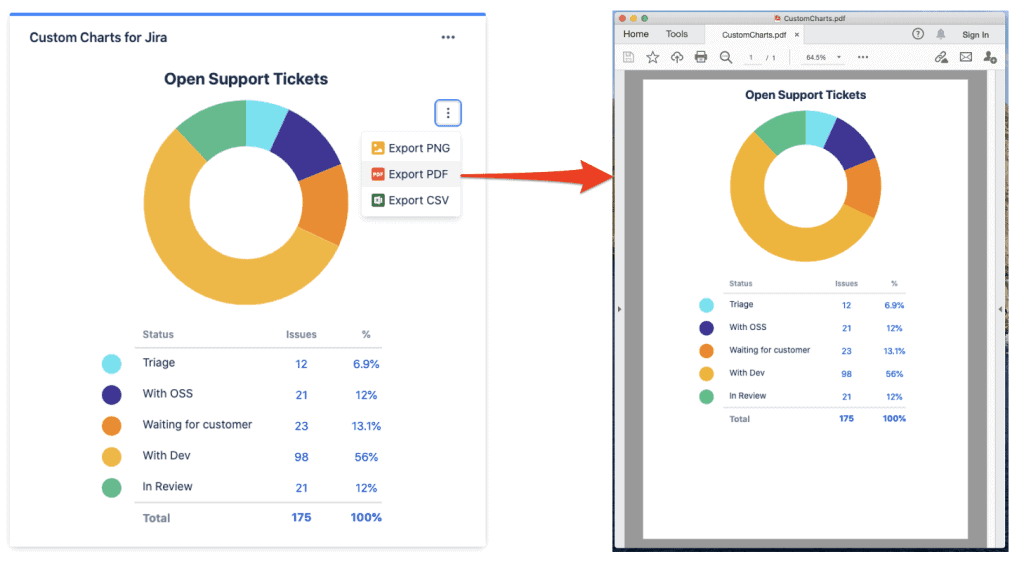
(Source: Old Street Solutions)
Export Jira to PNG
PNG is the ideal lossless image format if you need to add a graphic to a PowerPoint presentation or any other document. Once again, click on the overflow icon, select “Export PNG,” and you’re good to go.
Final words
Jira-enabled software, such as Tempo Timesheets and Accounts, also contributes valuable information to the Jira database. When integrated with Custom Charts for Jira, you can export time-tracking or resource-planning data directly into Google or Excel spreadsheets and other formats.
With Atlassian’s Jira, you’ll have all the data necessary to communicate effectively with colleagues, stakeholders, and clients. All you have to do is push a button.