4 SLA reports support teams can make using Custom Charts for Jira
Customers have high expectations for the products they buy and the services they access. As a service provider, it’s up to you to quantify and track customers’ satisfaction with your company and the experience you provide.
According to Salesforce, 90% of purchasers say their experience with a company matters as much as the quality of their product. For IT-based businesses, establishing service level agreements (SLAs) with clients allows them to codify customer service and support expectations within a formal contract.
To avoid breaching the agreement, IT providers establish performance KPIs and track metrics contributing to customer satisfaction, such as response and resolution times. They need that information to prioritize tasks and measure whether they live up to contracted service levels. That’s where SLA reporting for Custom Charts can help.
Tempo’s Custom Charts software integrates with your existing Jira platform, allowing support teams to monitor and visualize their productivity. They track service benchmarks and provide a positive experience that turns clients into loyal, repeat customers. The reports also allow groups to identify areas of improvement in their processes.
Sign up for a demo
Request DemoCustom Charts for SLA reports: How they work
Custom Charts gives the support group quick access to status reports that track their performance. Using charts and graphs based on key metrics, team members can easily compare their productivity with the whole and see how their performance measures up against SLA goals.
Here’s how to configure Custom Charts for SLA data visualization:
Download Tempo’s Custom Charts for Jira from the Atlassian Marketplace and add it to your dashboard.
Enter “Edit Mode” and set the “Source” of your report to your Jira Service Management (JSM) project.
Click on the “Chart by” dropdown and select “Request Type.”
The default visualization is the pie chart, but you can organize data into tables, line graphs, or bar charts using one or two dimensions – whichever format works best for the team.
Next, adjust the calculation settings within the “Count” and “Story Points” menus.
Adjust the time period by clicking the cog icon to access the chart display settings. Scroll down to “General Options,” select the “Time Unit” dropdown, and choose “Hours,” “Days,” or “Weeks.”
Label your chart with a name unique to the client or team.
Click the blue “Save” button at the bottom right of the app to integrate the report into your dashboard readout.
Benefits of custom charts for SLA reporting in Jira
Monitoring your customer experience team’s compliance with the SLA plays a vital role in the growth and improvement of your services, securing clients’ ongoing satisfaction and future patronage. Here’s how:
1. Enhanced visibility into SLA performance
SLA reports capture an overview of your customer service team’s productivity, allowing you to step in and take corrective action to prevent a service breach. Using custom performance reports, leaders can spot when a rep isn’t meeting their KPIs or SLA goals and offer additional support and training. Custom Charts also provides a high-level perspective of the service pipeline, identifying bottlenecks and potential improvements to optimize the process across the board.
In addition, you can share performance reports to a team member’s dashboard to help them prioritize their tasks and address issues before they breach an SLA.
2. Customizable reporting
Go beyond built-in Jira reports and opt for the personalization available through Custom Charts. You can customize reports using KPIs and metrics unique to each client, ensuring they’re meaningful to your team and customers. Streamline individual or team reports by drawing data from a specific timeline or create one- and two-dimensional charts to clearly visualize the support team’s performance. Different chart types (e.g., line graphs, pie charts, or tables) will effectively illustrate performance to your chosen audience.
3. Customer satisfaction insights
SLA reports generate valuable insights into a business support department, helping managers spot trends or service patterns that could impact the client or team. Visualization offers evidence to support decision-making so you can proactively address an issue before it affects customer satisfaction.
4. Documented results
If a client questions whether your team met the requirements outlined in their SLA, you can produce support documentation to demonstrate compliance. You can also show how process changes or additional training have reduced wait times and improved satisfaction levels.
Communicating these results to stakeholders is also a breeze. Team members can receive reports directly via their dashboard. For management reports, export the charts in PDF, CSV, or PNG format – whichever suits your audience.
Custom Charts examples
Custom Charts can report on various KPIs to help your service team chart a path to improved performance and increased customer satisfaction:
1. Average time to first response by request type
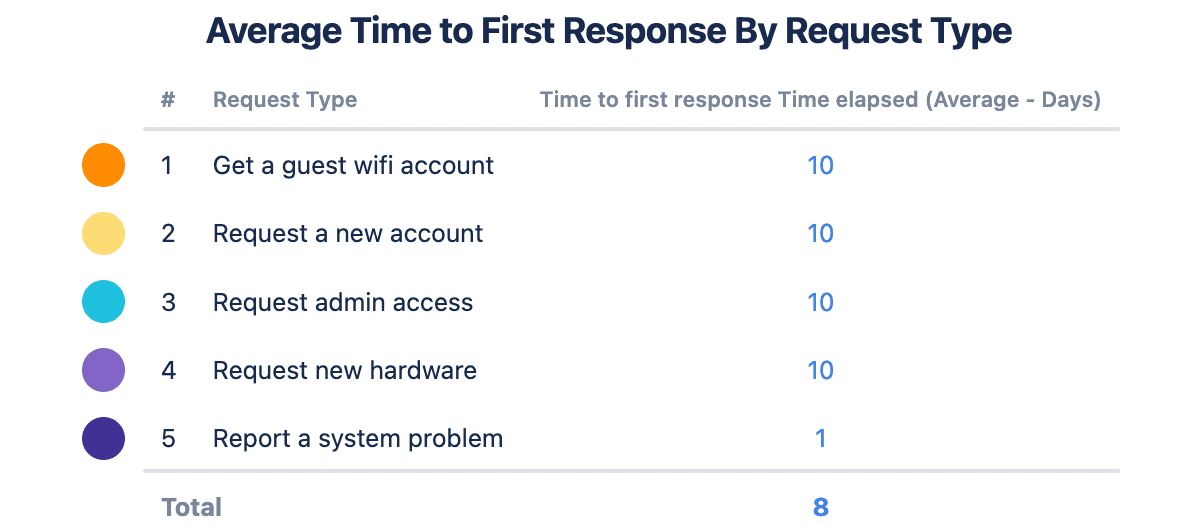
(SOURCE: Old Street Solutions)
This chart measures the average time the support team takes to respond to various requests coming through the customer portal. The above example tracks the average time in days, but you can change the timeline to hours or weeks.
Delineating between request types shows whether the length of the first response time depends on the type of request. Disparities between categories suggest weak points that put SLAs at risk. Based on the statistics, you could provide the team with additional training or hire someone specifically qualified to manage this type of service request.
Regardless of the cause, taking too long to answer clients’ calls for help puts customer relationships at risk and decreases their trust in your team’s services. With relevant data, you can create an action plan to remedy the issue and improve service.
2. Time remaining on an SLA by assignee
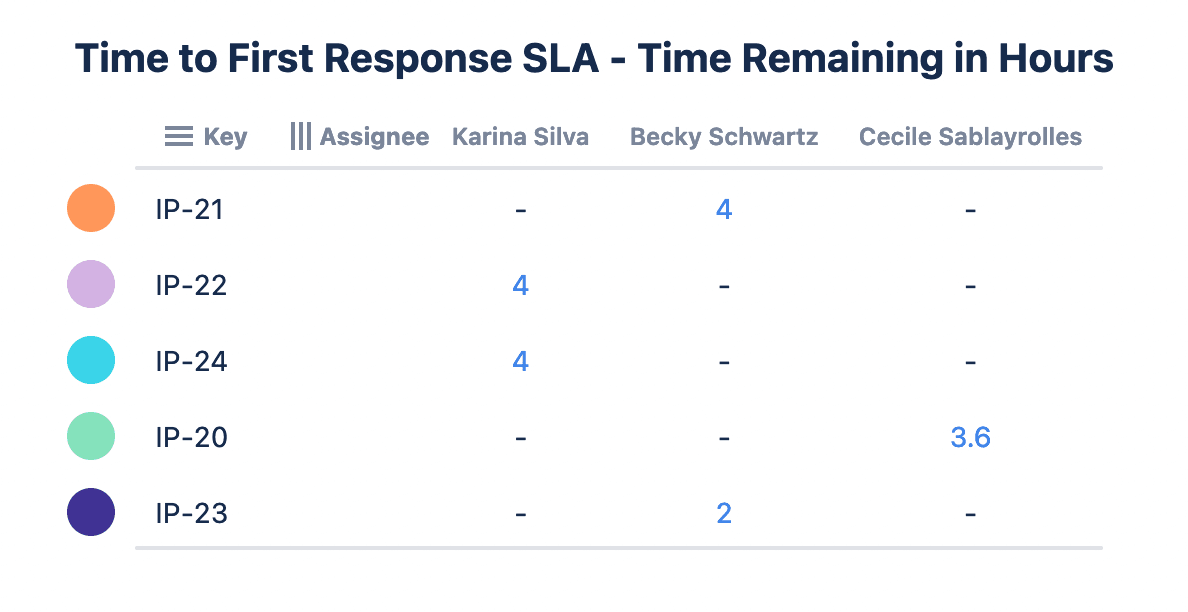
(SOURCE: Old Street Solutions)
This leaderboard is another vital statistic for JSM projects. It tracks how long the team has to resolve an issue before an SLA breach based on when the client logs it within the system. Additional customization offers team members an overview of their workload from the dashboard, allowing them to quickly access critical requests and prioritize tasks.
3. Average time to resolution by assignee
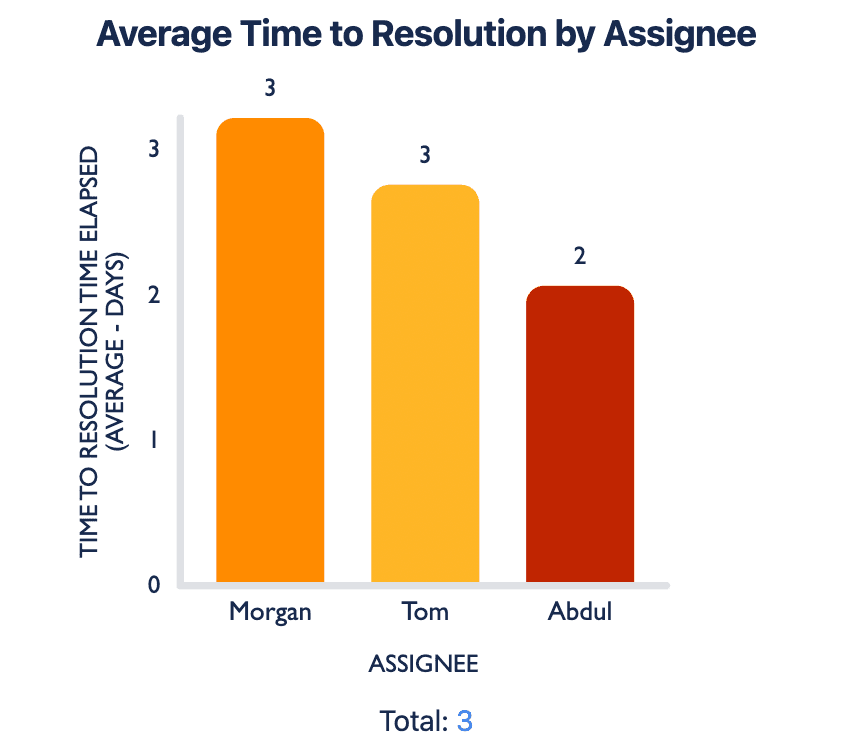
(SOURCE: Old Street Solutions)
Provide your team an overview of productivity and efficiency using this bar chart. By segmenting the statistics by individual, you gain insight into team workloads. If certain team members take significantly longer to resolve requests, they may require additional training, or the platform may be distributing the workload unevenly among team members.
4. SLA breached vs. not breached
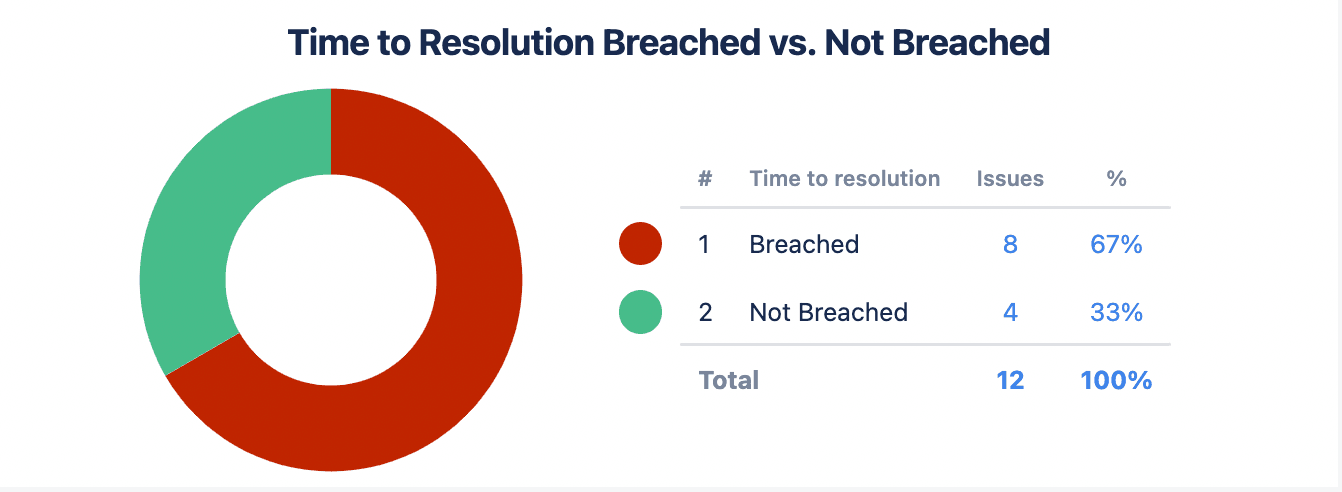
(SOURCE: Old Street Solutions)
This pie chart compares the number of requests that breached the SLA versus those that have not. This statistic is essential to management reporting, tracking how well the team achieves its SLA goals and meets client expectations. From the above example, the group has breached the Time to Resolution SLA two-thirds of the time, jeopardizing customer relationships and risking the team’s viability.
Final words
Tempo’s Custom Charts for Jira is an invaluable reporting tool to track how well your company’s customer support teams meet the goals outlined in the Service Level Agreements. The platform ensures performance data is easy to understand, allowing you to identify areas where the group can or must improve.
When you combine these performance statistics with Customer Service Satisfaction (CSAT) ratings – data you can aggregate and calculate using Custom Charts – you get a complete picture of your performance regarding customer experience, service, and fulfillment.
With this information on hand, you have everything you need to analyze processes and performance, find improvements, drive long-term customer loyalty, and promote business success.