Learn step-by-step processes for Agile release planning, overcome common challenges, and discover how to deliver value faster with practical tools.

In data analysis and business intelligence, a data source is a vital component that provides raw data for analysis. A data source is a location or system that stores and manages data, and it can take on many different forms. From traditional databases and spreadsheets to cloud-based platforms and APIs, countless types of data sources are available to modern businesses.
Understanding the different types of data sources and their strengths and limitations is crucial for making informed decisions and deriving actionable insights from data. In this article, we will define what is a data source, examine data source types, and provide examples of how they can be used in different contexts.
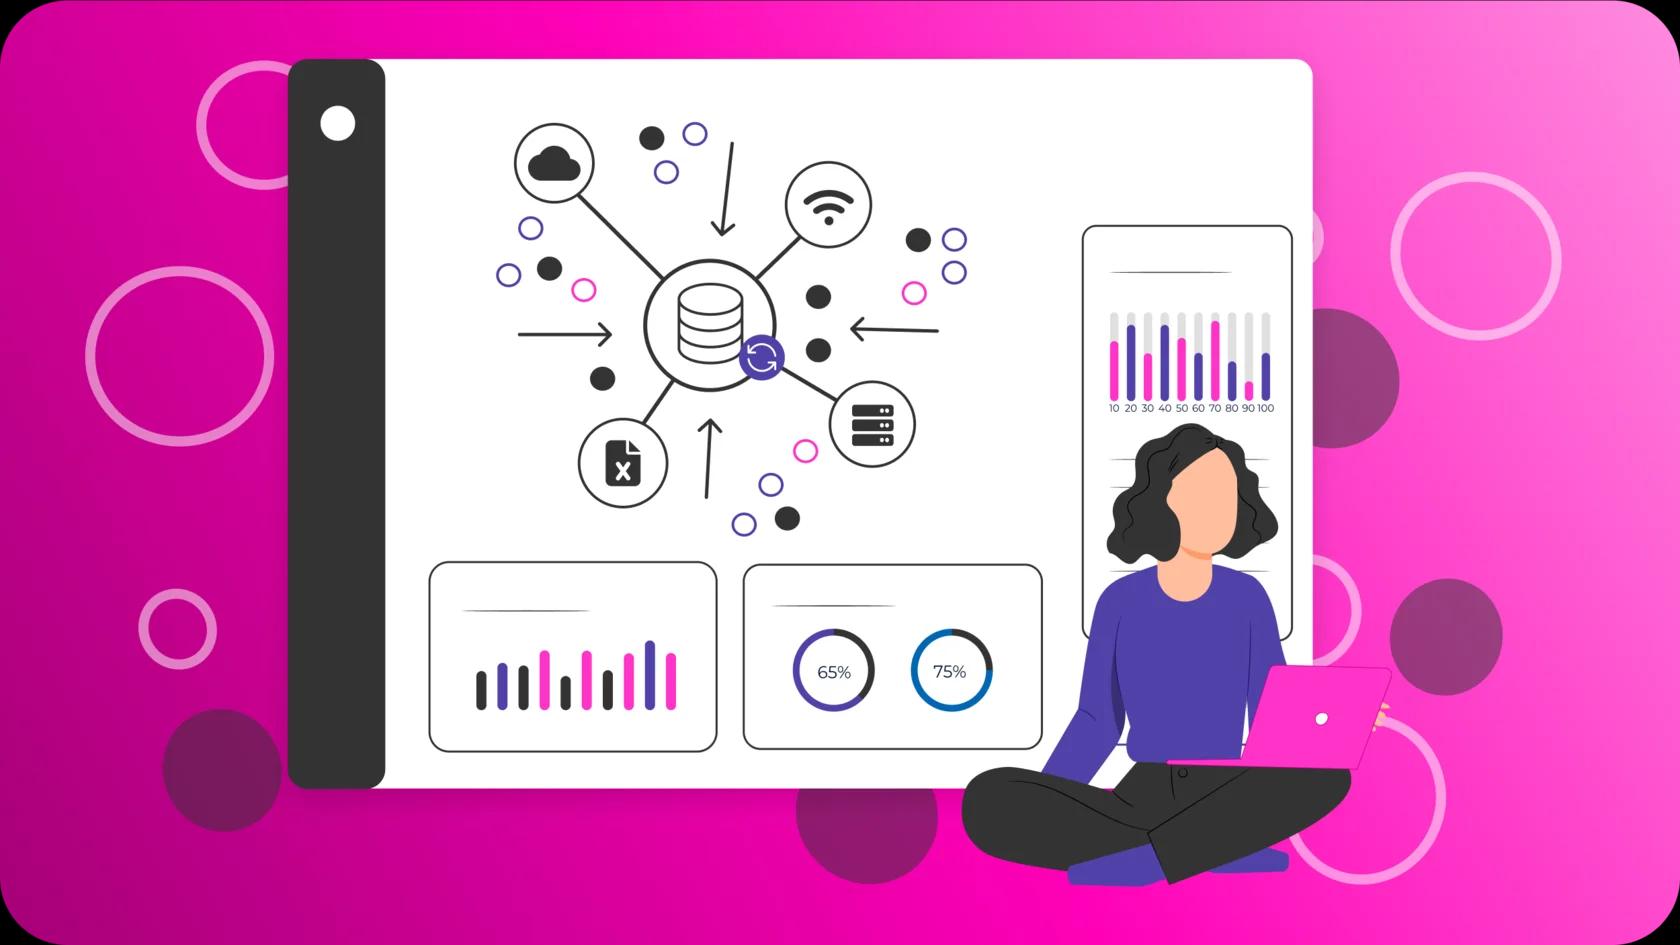
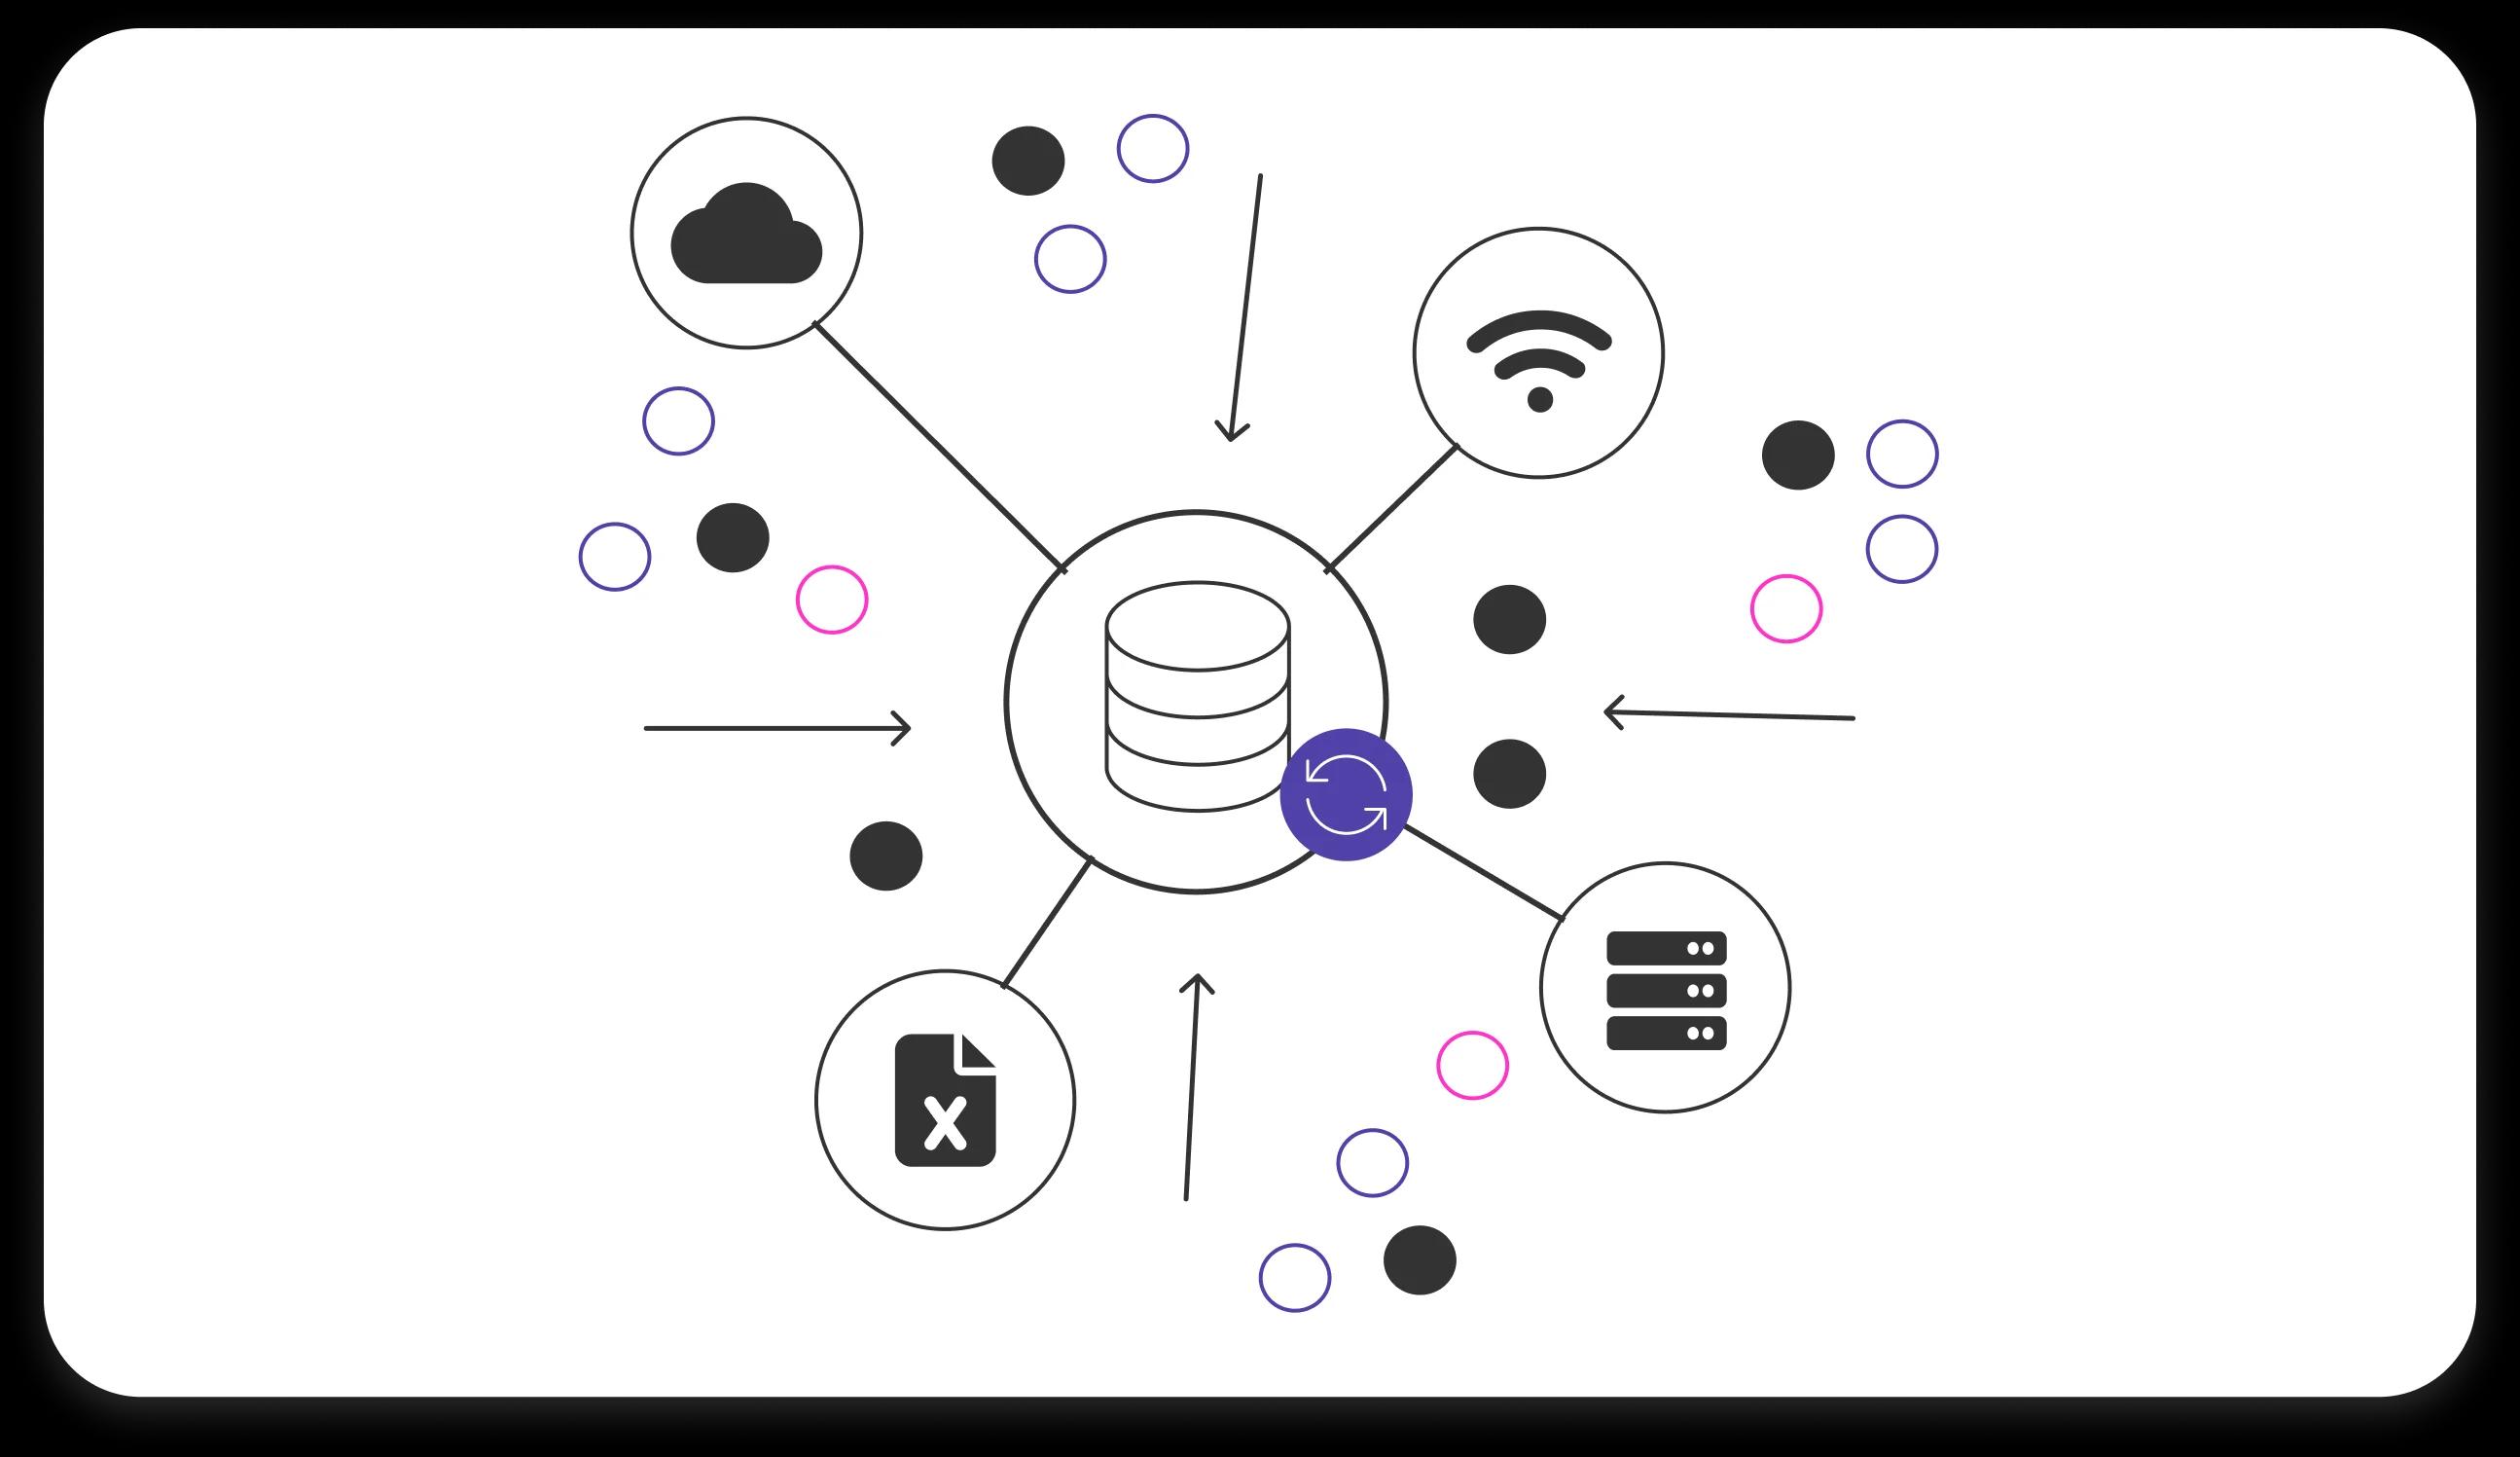
In short, data source refers to the physical or digital location where data can be stored as a data table, data object, or another storage format. It’s also where someone can access data for further use — analysis, processing, visualization, etc.
You often deal with data sources when you need to perform any transformations with your data. Let’s assume you have an eCommerce website on Shopify. And you want to analyze your sales to understand how to enhance your store performance. You decided that you would use Tableau for data processing. As it is a standalone tool, you must somehow fetch the data you need from Shopify. Thus, Shopify will act as a data source for your further data manipulations.
You can use a third-party integration plugin like Tableau Connector for Shopify to facilitate the task. Such applications allow making links between the business intelligence tools like Tableau and data sources like Shopify. Moreover, with the connector, you can select all the data in your eCommerce account and select particular fields, tables, etc., with broad filtering options.
One of the main advantages of Tableau is its capability to manage data source integration. It means you can combine several data sources to model different scenarios and make predictions based on them. So, apart from Shopify, it can be other platforms like Jira or Confluence, graphic tools, social media, Excel files, etc.
The terms data source and database often need clarification by users. But these concepts are different.
A database is a structured collection of data, typically stored electronically in a computer system. A database is usually organized so that it can be easily accessed, managed, and updated. A Database is typically managed by a Database Management System (DBMS), which provides access to the data in the form of queries and reports.
Examples of databases include customer relationship management (CRM) systems, financial records, inventory systems, online catalogs, and other types of information that can be organized and retrieved quickly and easily.
Databases come in many types to serve different purposes. There are two main types of databases: relational (SQL) and non-relational (NoSQL). The SQL database uses Structured Query Language for communication and management, while the second utilizes non-tabular structures. Some common types of databases include cloud databases, end-user databases, graph databases, object-oriented databases, operational databases, open-source databases, distributed databases, and personal databases.
On the contrary, a data source is an entity that holds data, such as a file, a web service, an application, or a combination of these resources. A database can also be a data source, but it is not the only possible type.

Most data sources can be divided into two main categories: machine data sources and file data sources. Let’s look at each of them in more detail.
The machine data source is created on the client machine, be it a computer, a phone, an Internet of things, or another device. It is available to users currently logged onto the system and cannot be shared with other machines. They can be further categorized into user data sources (available only to a particular user) and system data sources (available to all the system users).
Machine data source examples include network traffic logs, system and application logs, output from sensors, event data from IoT devices, database query results, etc.
Users need to use the data source name as a shortcut to connect to the data.
File Data Sources are not assigned to particular machines, applications, systems, or users. They can be shared between devices. These data sources are usually stored in separate text files. They do not have a data source name (DSN) like machine data sources. Such data sources include spreadsheets, text documents, PDFs, images, and audio and video files.

Data sources are necessary for organizations to collect, store, and organize their data to the tools or other destinations they are willing to use it. They also provide a secure, reliable, and efficient way to access data. And finally, one of the essential functions of data sources is to help receive the data where it is needed.
In such a way, data sources serve as links between different applications, tools, and systems and allow migrating data from one location to another or from one format to another. As a result, data sources can also help integrate several systems more seamlessly and effectively.
To better understand the functionality of data sources, let’s look at how data sources help us manipulate the data.
A data source is a place where the data is modeled, that is organized in a logical structure. Thus a data model is a set of fundamental rules of how data is organized inside a data source.
It is used to represent the relationship between different data elements and helps to manipulate data consistently. For good use of data, it should be meant in a readable or in any other way clear format for users or machines.
Examples of data models include tables in a database or fields in a report. The most common models are hierarchical, relational, unified modeling language (UML), entity-relationship, object-oriented, and dimensional data models.
Data Source Connectors are used to facilitate the flow of data between applications, databases, analytics tools, etc. It makes it easier for organizations to access and analyze their data quickly and efficiently.
In other words, connectors also provide a unified platform that allows different applications to communicate, allowing organizations to make better decisions faster.
For example, the IT team uses Tableau for reporting and forecasting. In that case, it can use connectors to connect to the data it needs, including those contained in Jira, Confluence, Excel files, cloud databases, etc.
As we already figured out, machine data sources are hard to manage, as their capabilities are limited within one device, system, user, etc. File data sources, on the contrary, are more eligible for different manipulations. Like most digital assets, they can be copied and shared with other devices or users.
Data sources can be copied and shared in a variety of ways. Some can be downloaded to a local computer and sent via email, cloud storage, or other file-sharing services. Another way is to export the data source as a CSV, Excel, or other file format and then share the file. Finally, data sources can be shared by providing access to the source, such as a web page or database.
Data is transported with the help of existing network protocols. File Transfer Protocol (FTP) and HyperText Transfer Protocol (HTTP) are the most widely used. Other protocols for fetching data between systems, especially on the web, include NFS, SMB, SOAP, REST, and WebDAV.
Another method of moving data from sources to destinations is using Application Programming Interfaces (APIs) provided by websites, networked applications, and other services.

The primary data source purpose is to collect and provide all the technical information needed for the user, application, or machine to access the data. These may include a driver's name, a network address, and other connection information. Most importantly, data sources help users avoid dealing with these technical details by themselves.
All connection data is hidden securely inside the database and is only used when it is necessary to perform any manipulations with the data stored in the data source, i. e. when you need to copy it, transfer it, or connect it to a particular platform or application.
Let’s imagine an IT company developing software applications that use ServiceNow daily and wishes to analyze some of its operational data in Power BI to improve its growth strategy.
To facilitate the platform integration process, the company can use Power BI Connector for ServiceNow as it allows it to link both tools seamlessly and without any coding or other technical skills.
The first step to using the Power BI Connector for ServiceNow is to create a data source containing all the necessary information for reports and analysis. It can be done by navigating the ServiceNow app store and installing the app. Once installed, an admin or a user with the proper permissions should create a new data source by clicking the New button within the ServiceNow portal (from the ServiceNow portal or the Power BI Connector page). It will initiate making a new data source, enabling seamless integration between ServiceNow and Power BI.
To understand what data you want to include, the system will display a form with different fields to be filled in. They have the data source name, description, and row limit. To be able to export data, you must configure the data source by adding tables and fields with the necessary data.
Power BI Connector for ServiceNow allows narrowing the data. You can select particular fields and use different filtering options to make your final data source maximally adapted to your reporting needs. You can study the process of creating data sources with Power BI Connector for ServiceNow in more detail here.
After creating the data source using the Power BI Connector for ServiceNow, you can start exporting your data to visualize in Power BI, create reports, or model different scenarios to meet your business needs. ServiceNow provides various ways of making data sources and exporting them to files such as CSV, JDBC, FTP, HTTP, and XML.
To export the data, you'll need to fill in the required fields, which can be found here. However, it's worth noting that integration with other systems can be more complicated in this case.
Data has become a valuable commodity in the modern economy, as it is increasingly used to make decisions, optimize business processes and create new products and services. Businesses use data to gain insights and competitive advantages. Data sources help teams manipulatу the data more effectively.
They are used for data collection, organizing it in a structured, easy-to-use form, providing access, and moving to the required destinations. Data sources are indispensable for system integrations, with the help of connectors, APIs, or other technical methods that help to migrate data to where it is needed.
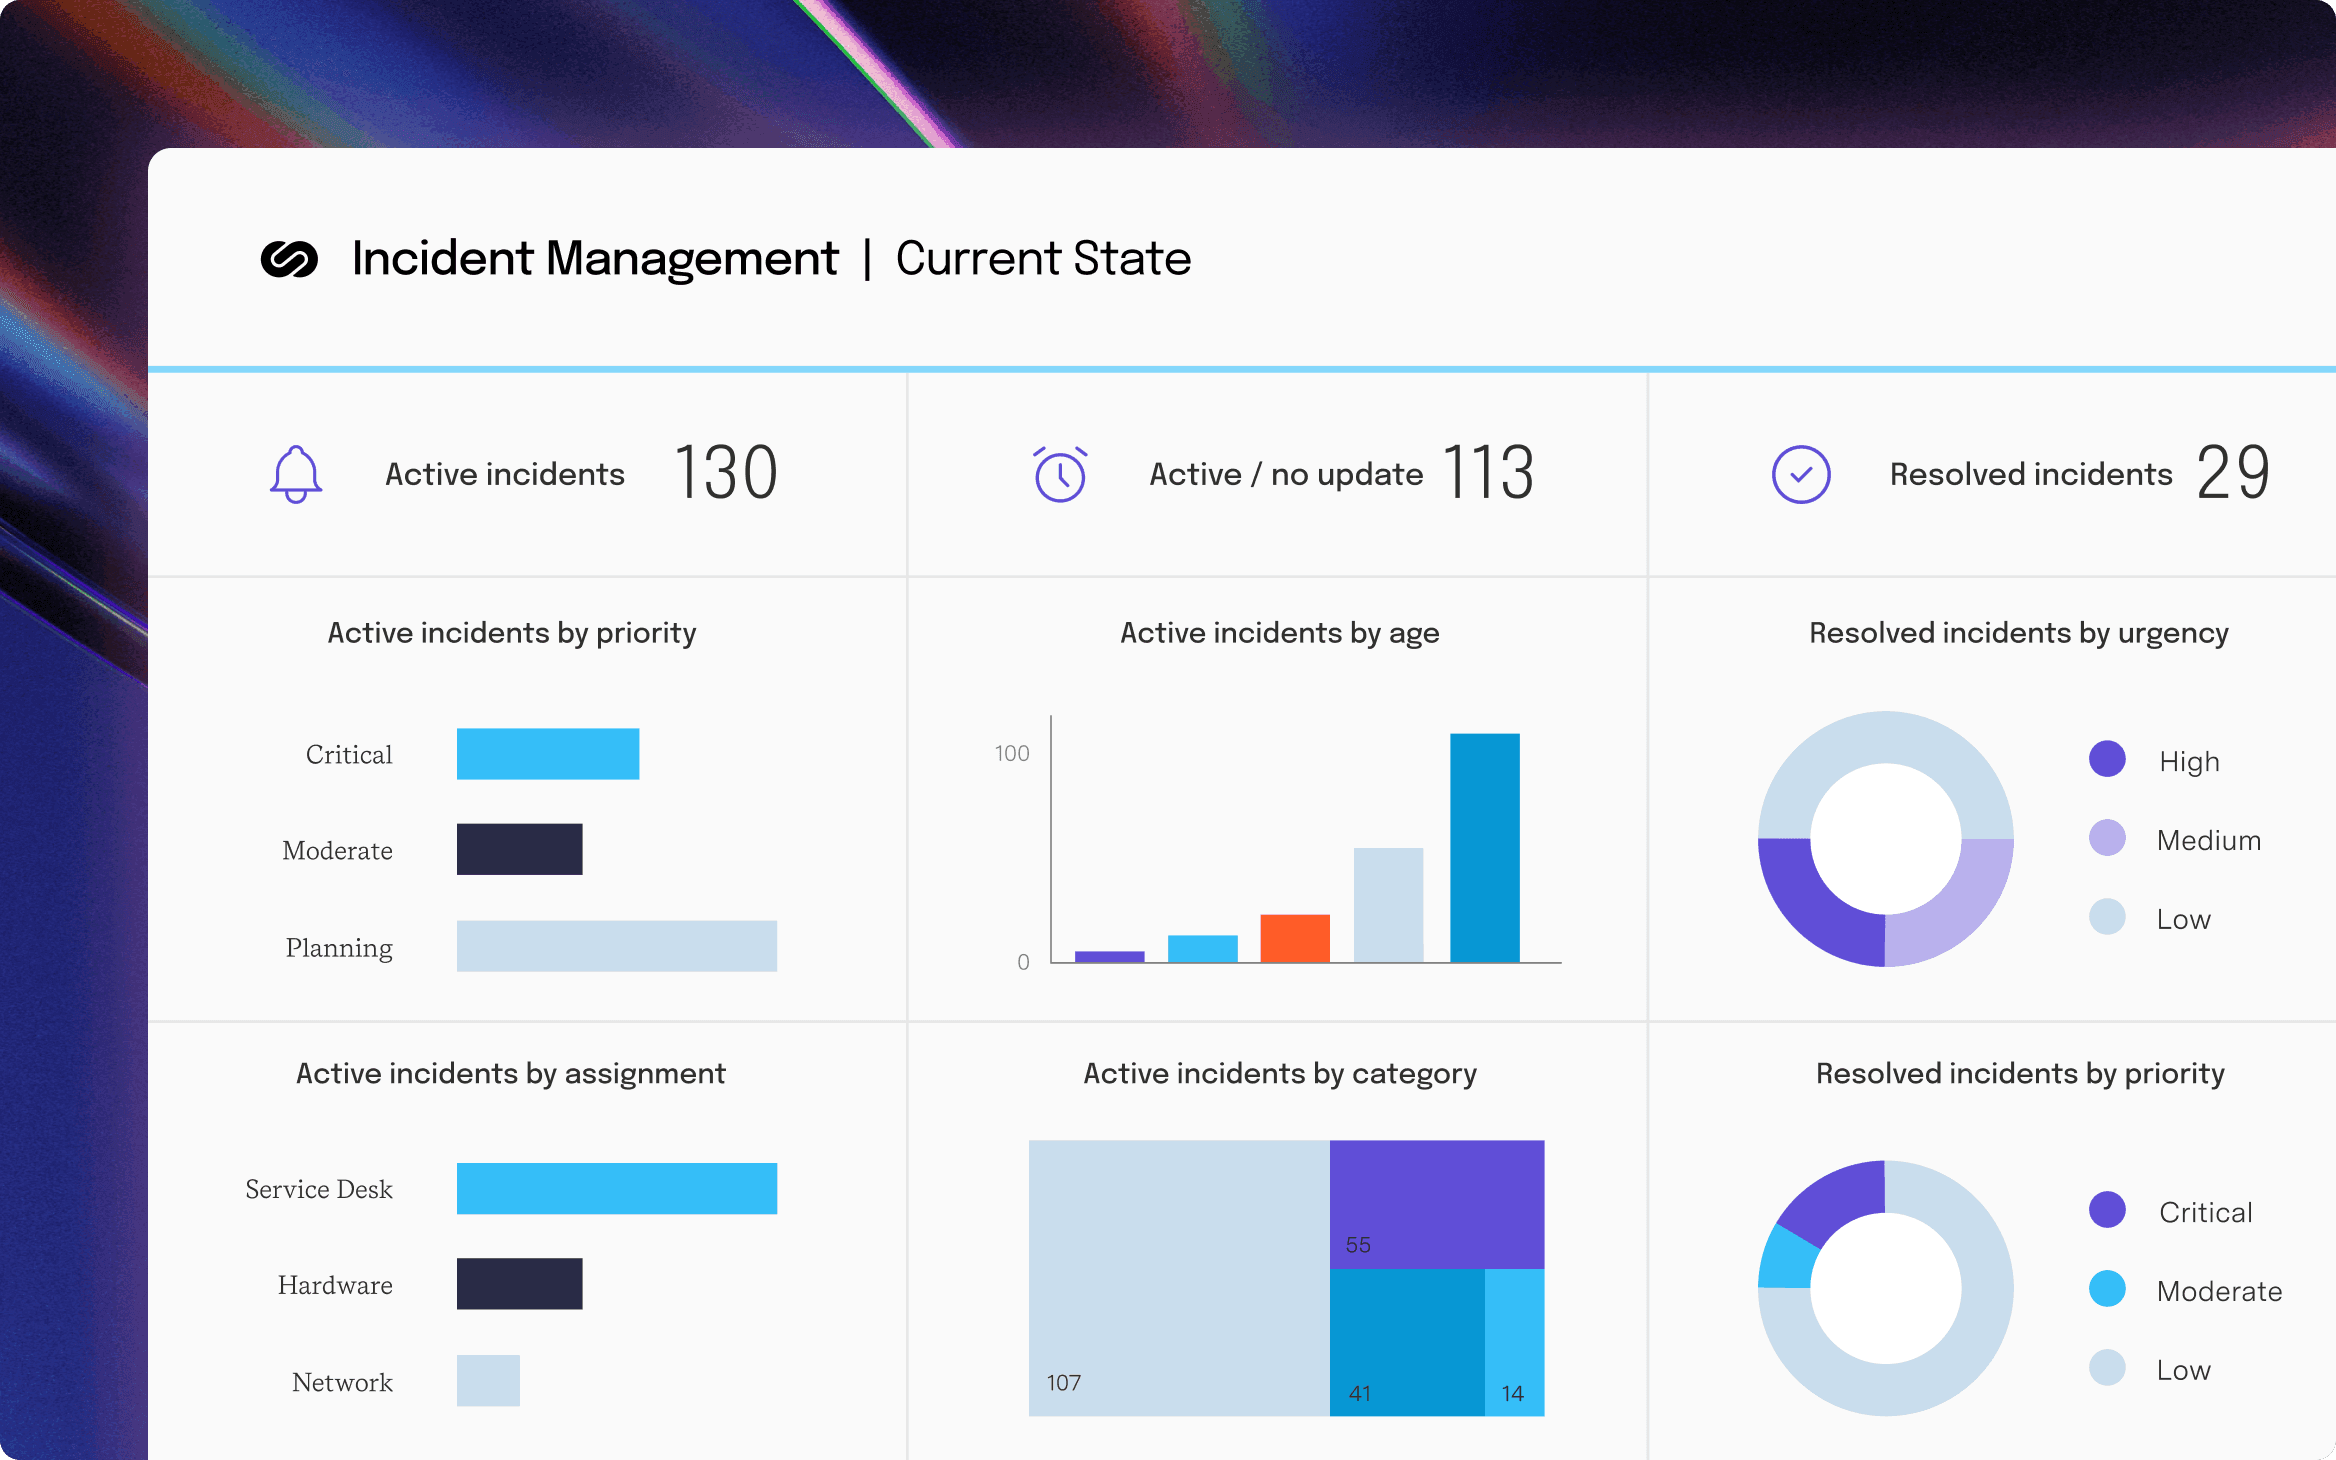
Power BI Connector for ServiceNow
Connect ServiceNow to Microsoft Power BI for advanced insights and streamlined integration, enabling comprehensive data analysis and improved decision-making.
Start a Free TrialLearn step-by-step processes for Agile release planning, overcome common challenges, and discover how to deliver value faster with practical tools.

Learn everything you need to know about project planning: how it’s done, its purpose, and its role in securing your team’s success.

Perfect the art of agile story mapping to develop products and features that delight consumers while meeting their needs and maximizing value.

Progress reports encourage organizational transparency and keep stakeholders informed. Learn how to compose intuitive and valuable reports.

Boost your Agile team’s accuracy with Planning Poker. Discover how this gamified estimation technique can improve forecasting and sprint planning.

Program increment (PI) planning is a vital event that builds alignment among agile release trains, prioritizing backlogs & uncovering dependencies.

Learn the best practices for professional services project management to optimize workflows and build a more successful business.

Migrate to Jira Cloud with confidence. The software’s new features are exciting, and Atlassian provides resources to support a smooth transition.

Develop high-performance teams to improve the organization’s bottom line through improved production, collaboration, and efficiency.