Tempo logotype

EazyBI is the F1 Race Car You Don’t Need. Get The Ford Focus.

From Team '23

Tempo Team

Know what? We’ll happily admit straight up that as a custom reporting tool for Jira, EazyBI is more powerful than our own app, Custom Charts for Jira. It generates incredibly detailed and interactive charts out of extremely large data sets. The point is, do you need all that power, and all those charts?

Probably not. For non-technical Jira users handling much smaller amounts of data, EazyBI is a needlessly steep mountain to climb. And by the time you’ve hit the summit, it’s often overkill.

Life is complicated enough. For most users, Custom Charts is a much better fit. Let’s use the analogy of a Formula 1 race car versus a Ford Focus to explain.

Who needs a Formula 1 car to get to work?

Formula 1 race cars go from 0 to 160kph in less than five seconds. They’re designed to stick to a race track, with advanced aerodynamics and tire technology to maintain traction. They’re supposed to be controllable at speeds of more than 200kph and take corners terrifyingly fast.

Do you need any of this to drive down the road to the office? No. A Ford Focus will do just fine.

As shown below, EazyBI will let you build a story points burndown line chart showing resolved story points, cumulative resolved story points, remaining story points, linear trend for remaining story points, and an optimal story points burndown guideline. All in one line chart. Frankly, who needs all of that when ultimately teams are just looking for a quick view of their sprint velocity?
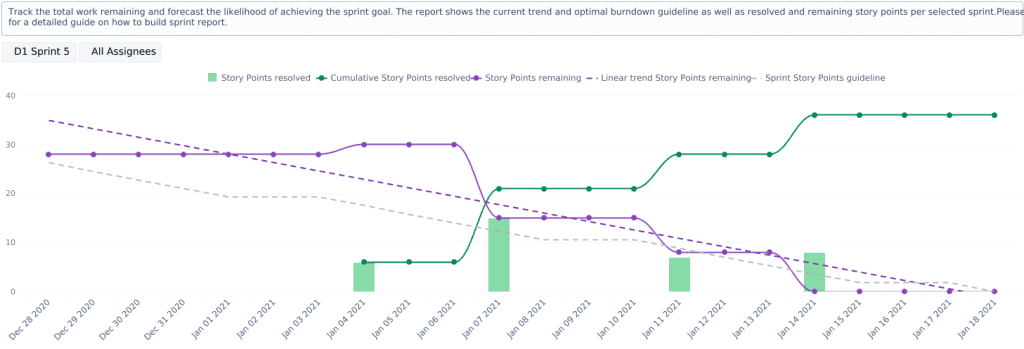
Yeah, we’re exhausted looking at this too
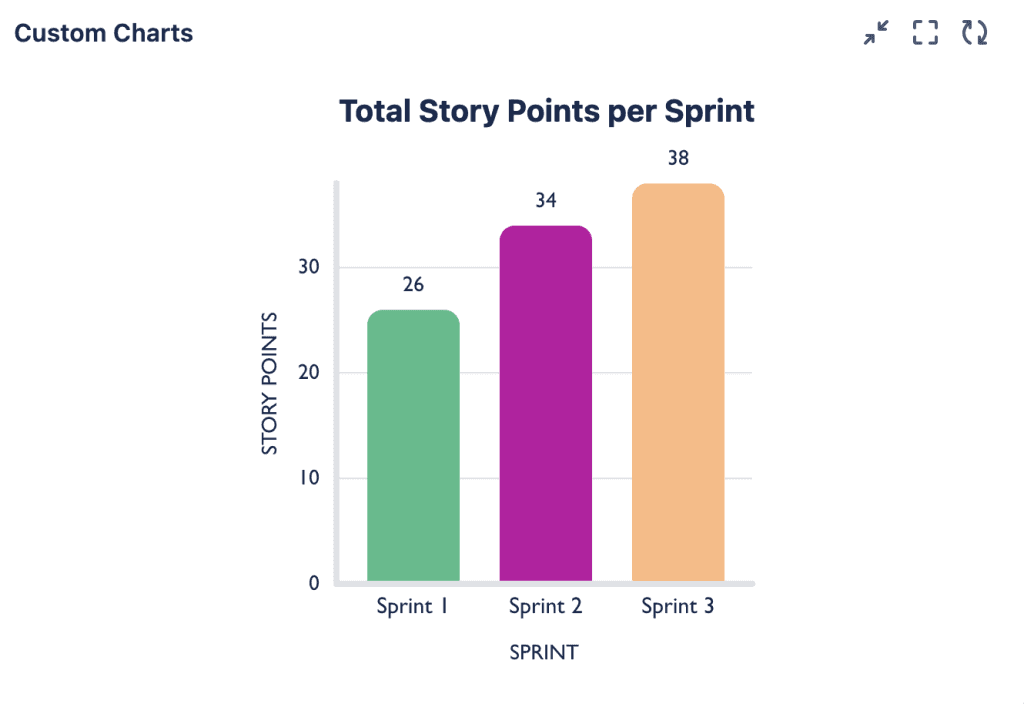
Ah, that’s better

F1 race cars and Ford Focuses have different purposes and are for different people. Likewise, we never intended Custom Charts to be a one-to-one stand-in for EazyBI. Sure, they both produce lovely, colorful, and highly customized pie charts, just like F1 cars and Ford Focuses drive. But like F1 cars, EazyBI does a lot more too. That’s because it’s for programmers and developers handling big data from multiple sources, not just your average Scrum Master who wants to show her team a bar chart of their progress.

So the question is, would you rather a tool that lets 10 people make a thousand reports, or one that lets a thousand people make 10 reports?

What we’re saying is that unless you’re after complex big data reporting, Custom Charts for Jira is going to be more than enough for you and your needs. Especially if you’re someone who can’t or doesn’t want to write code, like a project manager, team leader or support technician. Then you wouldn’t be using EazyBI to its fullest even if you had it.

Steep learning curve vs no learning curve

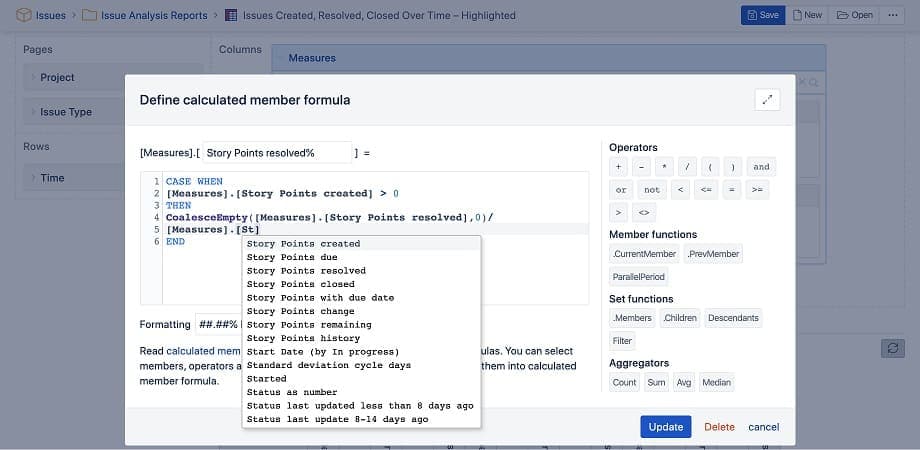
Not everyone can drive an F1 car. It requires time, training, and courage. A Ford Focus anyone can drive. Reviews of EazyBI mention its steep learning curve and how complicated it is to set up and maintain. It’s because you have to export data from a variety of different places, build your charts in multiple admin screens, and understand the Multidimensional Expressions (MDX) programming language to get them looking the way you want them.

If you know exactly what to do on the admin screen below, fantastic. You’re already an EazyBI pro. But most people won’t have the foggiest.
With Custom Charts, you simply open a Jira dashboard and add a Custom Charts gadget. You can then build whatever chart you want just by clicking a few boxes and selecting options from dropdown fields. Easy. It takes, on average, ten times fewer clicks to make a pie chart with Custom Charts than it does with EazyBI.
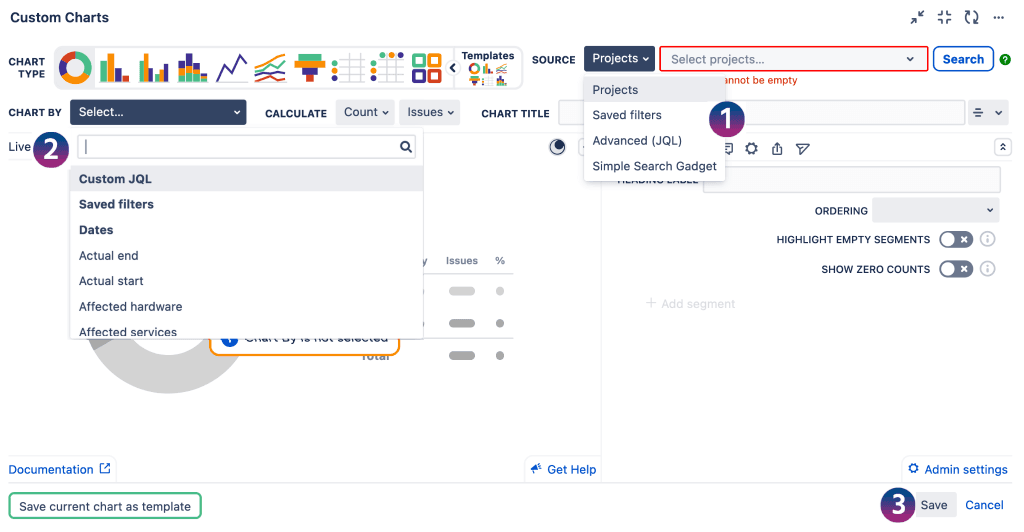
Just 3 quick steps to make a pie chart!

Be gone, reporting overlords!

The other important thing to mention is that to create the most complicated, fancy-schmancy reports in EazyBI, a company would need to hire a full-time dedicated expert to code them. This effectively creates a ‘reporting overlord’ within your organization — someone who hoards all the knowledge, visibility, and control of your company’s data. Not only does this lead to knowledge and time bottlenecks in day-to-day working, it’s also more expensive (because the programming expertise needs to be paid for) and higher risk (because the expert could leave, plunging you into a reporting blackout).

The ethos underpinning Custom Charts is the democratization of processes that used to be reserved to experts. We want more employees to do more things without technological barriers in their way. That’s why, with Custom Charts, we’ve built an interface that, if you know how to drag and drop, you can start using it immediately.

Although Atlassian has traditionally aimed its technology at techies, most Jira users these days aren’t developers, or programmers, and don’t have master’s in big data. This is why we created Custom Charts for Jira. It’s for the people who have no interest in coding or time to watch a million tutorials, but still want to get more out of their Jira instance.

If that person’s you, you know what to do.

Sign up for a demo

Register

Explore More Content

Align your organization with proactive portfolio management

Portfolio Manager (LiquidPlanner)

Predictive scheduling and the ability to forecast project timelines and spot risks so you can meet deadlines with confidence.

Learn more

Powered by Structure’s custom hierarchies, visualize your roadmap, project plans, timeline & dependencies within Jira Gantt charts

Go to marketplace
Colleagues interacting around a desk

No-Code Power BI Jira Integration

Power BI Connector for Jira

Effortlessly bridge Jira with your preferred BI tool, unlocking unparalleled insights and enhancing decision-making

Learn more

Industry-leading project plan and roadmap visualizations with a Gantt chart extension

Gantt Charts for Structure PPM

Visualize project plans and roadmaps with a Gantt chart extension for Jira

Learn more

No-code BigQuery Jira integration

BigQuery Connector for Jira

Integrate Jira with Google BigQuery to seamlessly export and sync data for advanced analytics and customized reporting

Learn more

Custom charts and dashboards for Jira

Custom Charts for Jira

See how work is progressing and where blockers are with the most flexible reporting app in Jira.

Learn more

Jira ITSM Solutions with Tempo

ITSM

Build and scale a custom ITSM solution at your own pace with Tempo's modular suite of integrated tools. Enhance Jira's capabilities and take control of your entire IT portfolio.

Learn more

Centralize real-time plans in one view

Integration: Structure and Gantt Charts

Gain a more complete project management solution, simplifying project reporting, improving collaboration, and ensuring projects stay on time and within budget.

Learn more

Time Tracking Software for Jira

Timesheets

Tempo’s intuitive automation and Jira-native design make it the most trusted time tracking tool for enterprise organization.

Learn more

Jira Portfolio Management PPM

Structure by Tempo

Jira Project Portfolio Management (PPM): Visualize data and manage projects within spreadsheet-like tables — in less than a minute

Go to marketplace

Real-time collaboration and capacity planning in Jira

Capacity Planner

A powerful team resource management tool designed to optimize capacity planning and project management in Jira

Learn more

Get the data you need to succeed

Time Tracker

Extend your Jira with prebuilt and highly configurable reports for straightforward time tracking.

Learn more

Jira Team & Resource Management

Capacity Planner

#1 Jira Resource Management App: Optimize team allocation, skillset utilization, capacity planning & project management

Go to marketplace

AI-enabled capacity visualization

Capacity Insights - Open Beta

Deliver visibility into how your team's time and efforts align with business objectives and project ROI - without the manual effort

Learn more

For planning leaders looking to add a big-picture roadmap view to their structured Jira data, this integration is essential. Improve visibility to leadership, reduce reporting admin, and keep your team aligned.

Learn more

Monitor financial health at every level

Financial Manager for Timesheets

Monitor projects and portfolios to get simple, clear, and real-time views of your costs, budgets, and profits that can be shared throughout your entire organization.

Learn more

Strategic Portfolio Management

Strategic Portfolio Management

Modern modular PPM solutions that scale with your business. Align your teams with the integrated platform that bridges the gap between strategy and execution.

Learn more

Jira Time Tracking

Timesheets by Tempo

#1 Jira Time Tracking & AI Apps: Log Tempo Timesheets for Planning, Project Management & Billing. Plugin Office365, Google & Slack

Go to marketplace

Project and program management for Jira

Structure PPM

Visualize all your Jira data & manage portfolios of projects in real-time.

Learn more

Take control of your projects

Integration: Portfolio Manager and Jira

Portfolio Manager integrates seamlessly with Jira to give you predictive scheduling, real-time scenario modeling, and advanced resource management – ensuring you stay on track, no matter what challenges arise.

Learn more

No-code Tableau Jira integration

Tableau Connector for Jira

Effortlessly bridge Jira with Tableau, unlocking unparalleled insights and enhancing decision-making

Learn more

Jira Project Cost Tracking

Financial Manager

Project financial management for Jira & Timesheets. Monitor project costs, expenses, revenue, billing & budgets. Track Capex/Opex

Go to marketplace

Unified time and team management

Integration: Timesheets and Structure

Combining Tempo Timesheets and Structure PPM provides a unified view of time tracking and project progress, enabling more accurate reporting and effective portfolio management. Simplify workflows, enhance collaboration, and ensure projects stay on time and within budget.

Learn more

Never lose track of a brilliant idea again

Idea Manager for Strategic Roadmaps

Never lose a brilliant idea again. Idea Manager for Strategic Roadmaps has built-in best practices to help.

Learn more

Agile at Scale Software

Agile at Scale

Adapt to changing business needs, rapidly adjust plans, and reallocate investment.

Learn more

No more reporting limitations

Custom Charts for Confluence

Create and share all kinds of highly visual and customizable charts directly on your Confluence pages.

Learn more

Unified time and team management

Integration: Timesheets and Capacity Planner

Seamlessly manage project timelines and resources while accurately tracking time spent on tasks. This integration enhances visibility, improves planning accuracy, and supports data-driven decision-making for better overall project outcomes.

Learn more

Roadmapping software for teams of all sizes

Strategic Roadmaps (Roadmunk)

The roadmapping tool designed for high-performing teams delivering boardroom-ready strategic roadmaps.

Learn more