

Custom Charts dashboards are now more shareable to anyone – in JSM portal or internally like a wallboard.

The Galactic Empire really should have used Jira to manage the construction of their second Death Star. If they had, maybe it wouldn’t have been destroyed in a matter of hours thanks to some primitive teddy bears.
Kudos to the Empire for at least trying to be agile when they built Death Star II. They got it operational, with a functioning superlaser, in 4 years. By contrast, the first Death Star took 20 years and had a great big hulking design flaw no one noticed (a classic waterfall project!).
But they weren’t agile enough. A combination of bureaucracy, poor communication, and an unwillingness to tolerate mistakes and learn from them, led the planet killer to a spectacular demise after just one iteration. If the Empire had broken the project down into tasks and tracked them in Jira, the fate of the galaxy could’ve been very different.
Here’s what the Empire’s Jira board might have looked like during construction:
Micromanager extraordinaire Emperor Palpatine was fond of saying that everything was going to plan. But you can’t know whether a Jira project is going to plan without good Jira reporting. Knowing the Empire, they probably wouldn’t have looked at reporting at all. They would have assumed everything was going great. Even if they had, they probably would’ve used Jira’s out-of-the-box reports, which don’t allow you to really dig into the data teams need to see.
And if the Empire had had the sense to start making custom reports, they probably would have used a complex business intelligence platform like Tableau or EazyBI. This creates reporting “overlords”, i.e. experts who are the only ones who know how to make the reports, and who therefore hoard and control the information. But of course, the basic M.O. of the Empire is to be overlords who hoard and control information.
But, if they’d wanted to be truly agile, they would’ve adopted an intuitive tool like Custom Charts for Jira, which everyone can use. It would have given their teams the power to create their own reports and let information flow around the Empire more freely. Perhaps with better communication and more transparency, they wouldn’t have had their butts whooped so easily by the Rebel Alliance.
Here’s what project manager Darth Vader’s Jira dashboard might have looked like, complete with easy-to-understand reports built using Custom Charts for Jira.
The pie chart below would have told Vader that Death Star commander Moff Tiaan Jerjerrod had twice as many tasks to deal with as anyone else. Maybe he’s overloaded? That might put some of his tasks in danger of being left incomplete, and the Empire doesn’t want that. If Vader had had this data in front of him, he would’ve been able to reduce the Moff’s workload by reassigning some issues.
If Darth Vader had kept track of the Empire’s costs with this simple table, he might have been able to spare some credits for more troops on Endor to deal with those pesky Ewoks.
The Empire probably would have categorized their Jira issues by severity, so this 2D stacked bar chart would have been very useful. It would have given Vader an at-a-glance view of how many at-risk issues of the highest severity need dealing with NOW. And if the Dark Lord wanted to see what exactly those issues were, all he needed to do was click on the Sev-3 At Risk section and he’d get taken to a list of them.
This issue list would have given Vader a more detailed insight into the most important issues, with visibility of each issue’s assignee, severity level, status, and a description to remind Vader of the task’s importance. Vader could have added quick filters to only show high priority issues due this week. That way, he’d know to expect that the Death Star will soon be protected by the Endor shield and have a functioning superlaser primed to annihilate the rebels. He’d also see that the Ewoks aren’t going to be a problem for much longer.
Darth Vader wouldn’t want his Emperor to be displeased with an apparent lack of progress. He’d want to make sure his teams are productive and staying on top of all the required tasks to get the second Death Star operational. The best way of conveying that is with a Created vs Resolved Issues line chart. If Vader had had sight of the chart below, he would have seen the recent drop in productivity. He could then have told Moff Jerjerrod to double his efforts or face the Emperor’s wrath.
This funnel chart would have allowed Lord Vader to monitor the overall status of the Death Star project. The chart shows the issues liable to have the biggest impact on the project (as specified by the Jira field Impact). Vader would be able to see that most of the out of the outstanding issues are low-impact, which will please the Emperor. There are some medium-impact issues that need watching, because the Emperor won’t be pleased if they’re not attended to. Finally, there are some high-impact issues that will make the Emperor fly into a dark side frenzy if they’re not resolved, fast.
And of course, Lord Vader could have had all these lovely charts in dark mode. Because the Empire knows the power of the dark side.
Alas, the Empire’s lack of agile working, lack of Jira, and lack of Custom Charts turned out to be its undoing!
May the fourth be with you
Sign up for a demo
Request Demo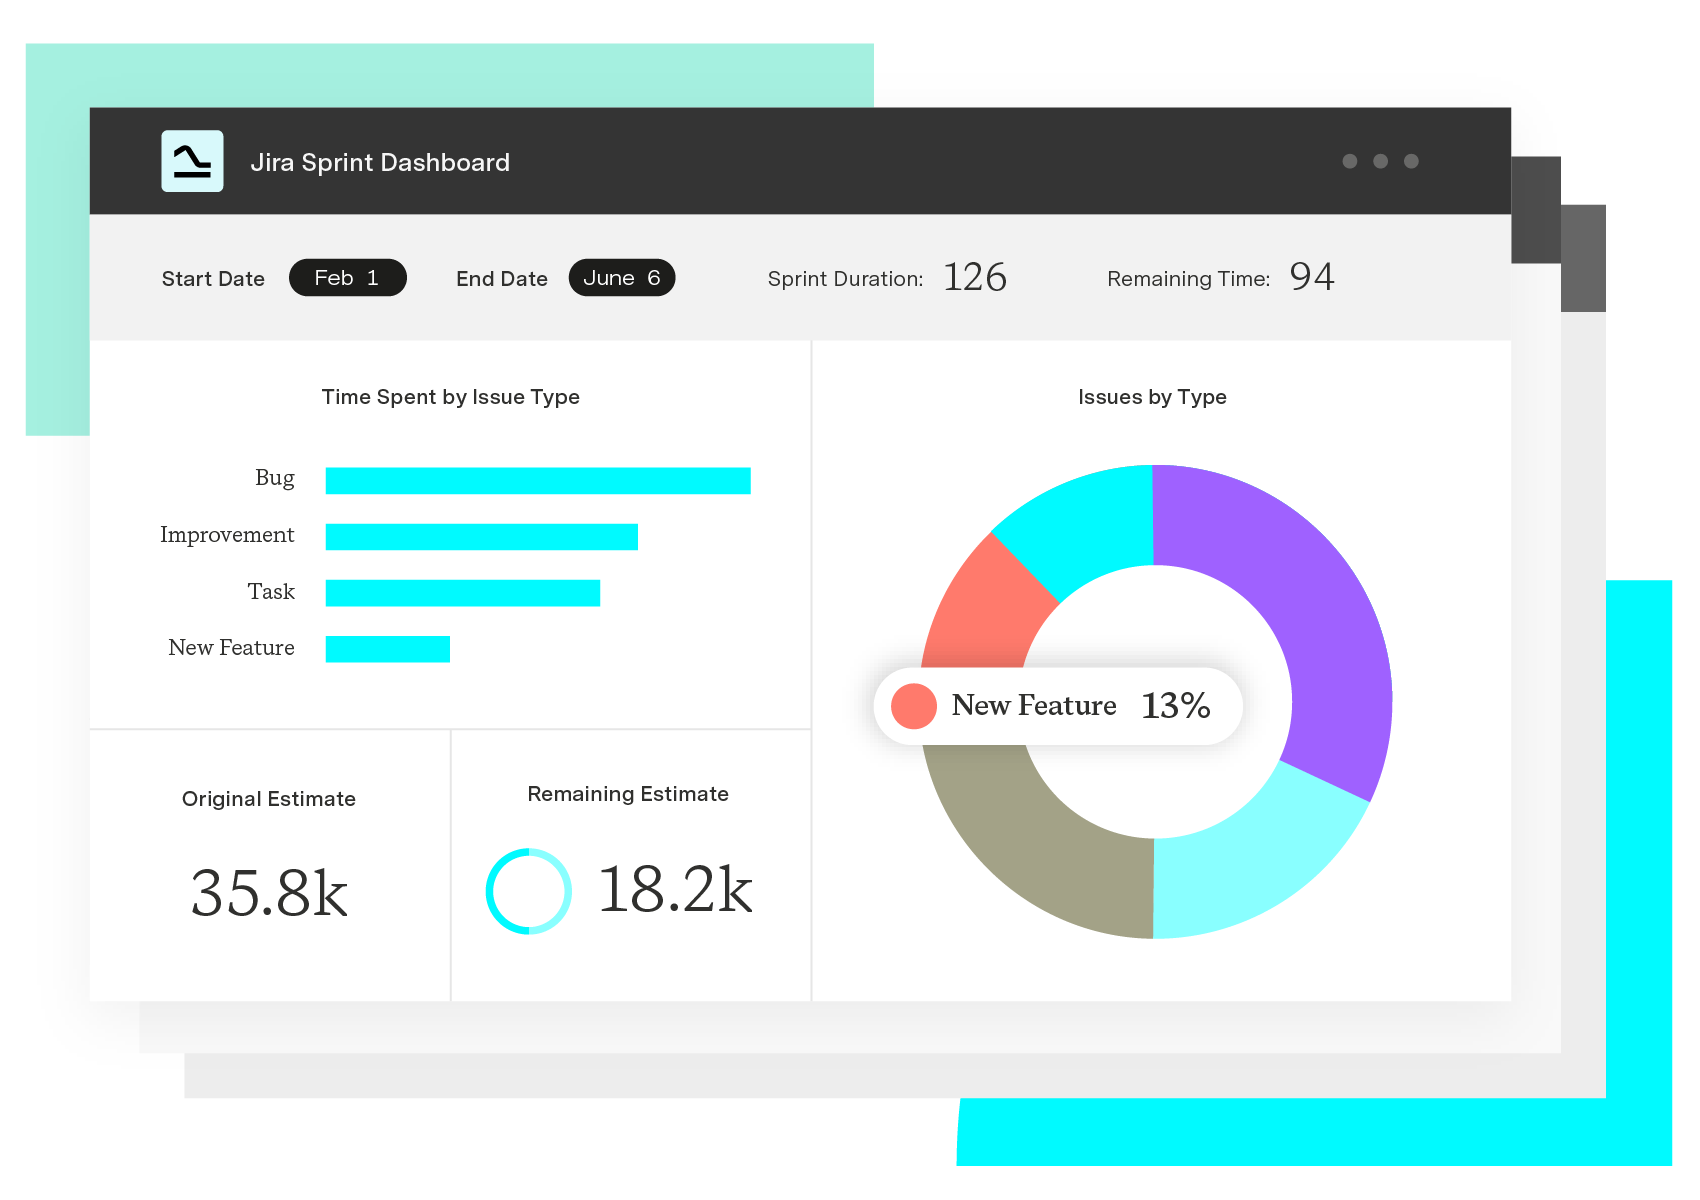
Custom Charts for Jira
Build charts and dashboards to evaluate delivery, capacity, and speed for all teams with Jira's most flexible custom reporting app
Start a Free TrialCustom Charts dashboards are now more shareable to anyone – in JSM portal or internally like a wallboard.

Remote workers can get just as much benefit from a Jira wallboard as their office counterparts. And Custom Charts Shared Dashboards can help.

We look at EazyBI's strengths and weaknesses and explain why Custom Charts for Jira is the superior reporting app for Jira dashboards.
See how Custom Charts for Jira lets you build cross-project dashboards, story-point breakdowns, and control charts that native Jira reports can't.
Great At Project Management - These are the movies that we think have the stuff of project management legend.
Even the most mundane things can be improved with the right background music. That’s why I've come up with the Ultimate Project Manager Playlist.

Project managers and executives can combine Timesheets with Epic Sum Up to better use existing time reporting to save the company money

Establishing and managing project scope is essential to the success of any initiative. Learn the basics and start your next project on the right foot.

These risk management tips can help you during the planning & execution of your project's timelines, costs, or quality as they may change.



















