

We know some Jira users aren’t clear on the difference between Jira reports and Jira gadgets (or which are better). So let’s walk through it.

So you know what an information radiator is, how it boosts Scrum team transparency and productivity, and how to create one in Jira (known as a Jira Wallboard).
Now we’ll reveal which Jira Dashboard gadgets we think work best on a Jira Wallboard, i.e. the gadgets most likely to inspire and motivate your team.
(Please note that not all Jira Dashboard gadgets are compatible with Jira Wallboards.)
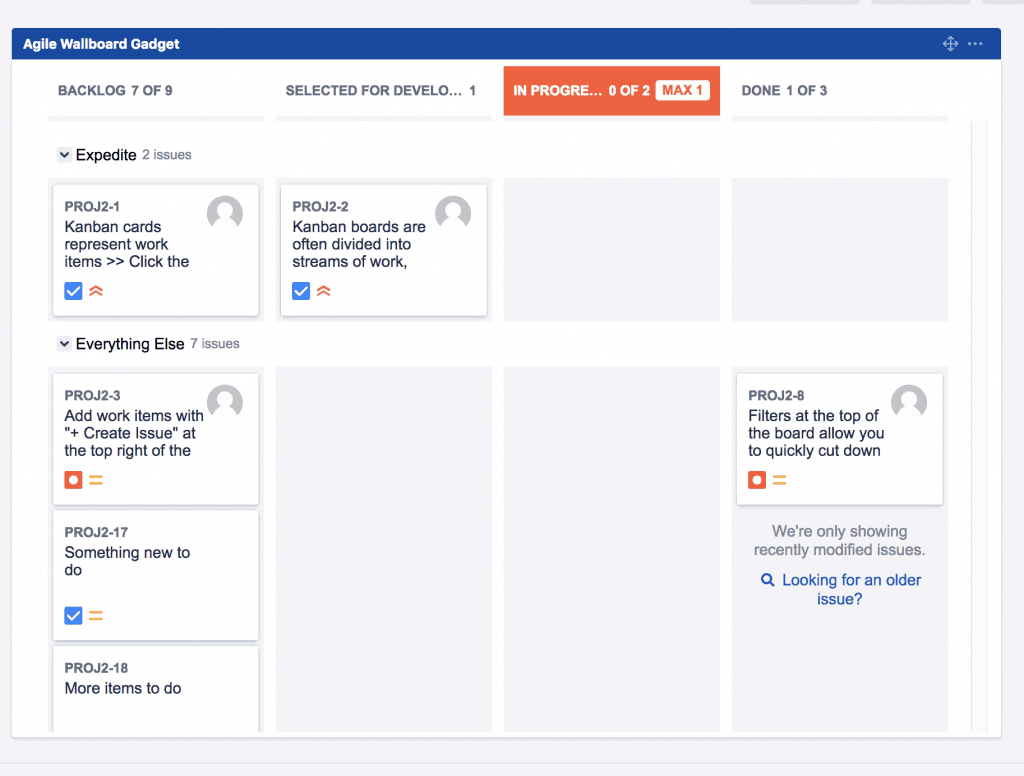
This gadget displays the team task board and is a beautiful way of highlighting the flow of work. You can see items from the current sprint together with their status and assignee, giving you an overall picture of the sprint contents. It’s a really useful gadget to look at during your daily stand-up, as you can point to specific tasks during the meeting.
Who doesn’t love a pie chart? This gadget displays issues from a project or issue filter, e.g. issue status, assignee or issue type, in a pie chart format. It helps you to know exactly how much work each team member has and how quickly they are able to complete it. As pie charts offer a very visual and immediate picture of what’s going on, this gadget is a great choice for Jira Wallboards. You can also use it during meetings; hovering the mouse over a piece of the pie gives you the issues as a percentage and clicking on a segment takes you to those issues for further detail.
There are a few limitations to the built-in pie chart gadget, e.g. the colors and ordering can’t be changed, and there are strict limits on the number of slices for most statistic types. You can purchase additional gadgets through the Atlassian Marketplace to resolve these limitations, such as Custom Charts for Jira. This allows you to create a pie chart with 250+ segments if necessary, and change the colors and ordering as per your requirements.
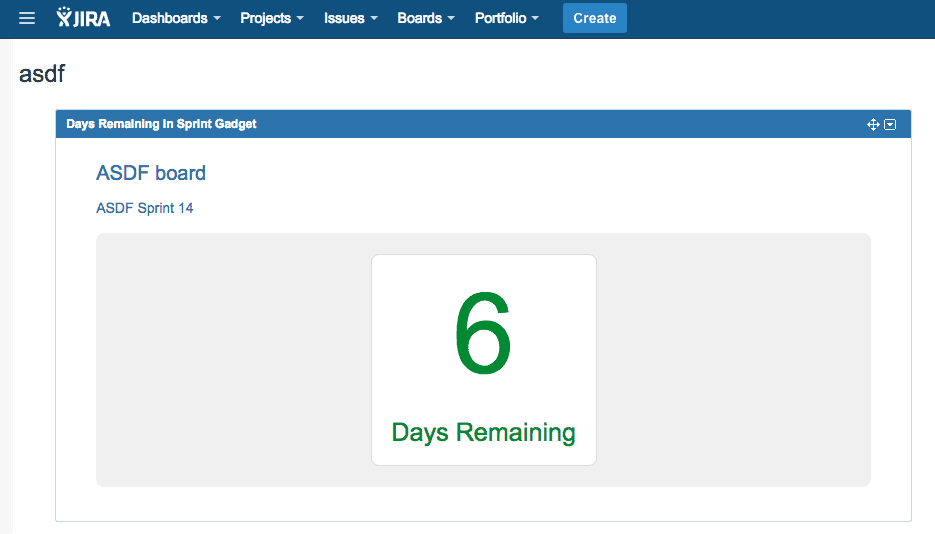
This simple gadget does exactly what it says on the tin; it gives you how many working days you have before the next release is due in a particular sprint. It’s uniquely suited to wallboards because a quick glance gives passers-by the information they need to stay on track. (That said, not everyone viewing the wallboard will have the team context.)
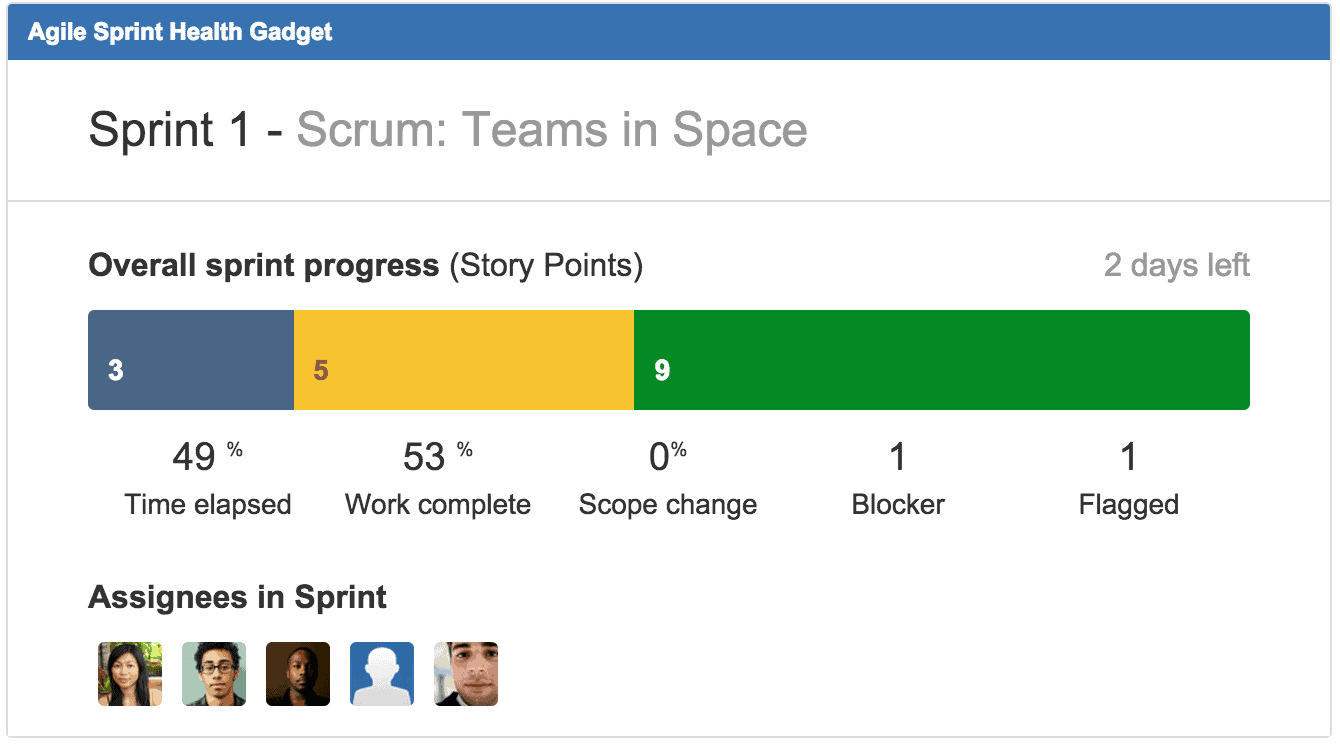
The Agile Sprint Health gadget displays a color-coded bar graph that lets you see a concise visual summary of the issues in a specified sprint. It shows your overall progress based on the time elapsed, work completed, and work remaining. The blue, yellow and green colors represent different issues in different statuses. Usually, blue is “To Do”, yellow is “In Progress” and green is “Done”. During meetings you can click any part of the bar to view the issues in the corresponding statuses.
The work completed percentage is based on the estimation statistic used for your board. So, if you have 50 story points in a sprint and 10 are resolved, then the “work complete” will be 20% (10 out of 50 story points).
In addition, the gadget counts the flagged issues, along with any blockers stopping or slowing down your delivery, in your “To Do” and “In Progress” items. And when work items are removed from an active sprint, they are noted as “Scope Change”. The gadget can also be configured to display the members of the Scrum team.
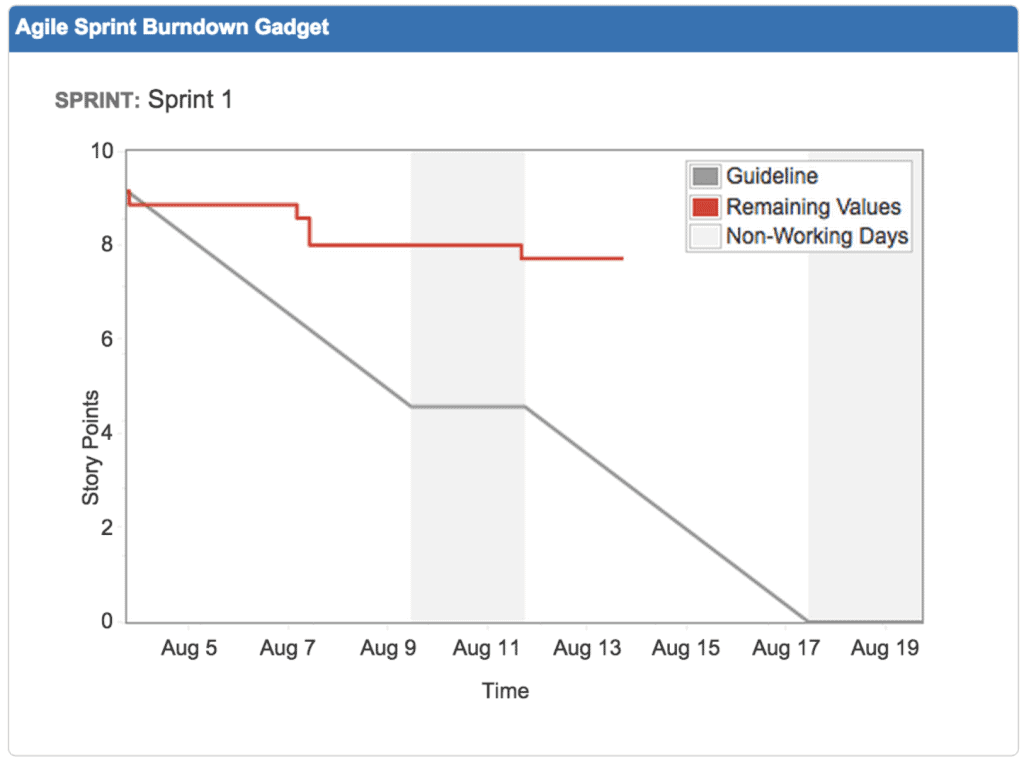
This gadget displays a series of line graphs showing the burndown for a particular sprint. The grey line is the ‘guideline’ based on the total estimated issues at the start of the sprint and the red ‘remaining values’ line is the actual work done (which ideally should fall below the grey line). The grey columns show non-working days, and flat red and grey lines indicate when no work is done on the sprint.
The sprint burndown is a popular gadget that lets passers-by see how the team is performing and whether the sprint is on track or not.
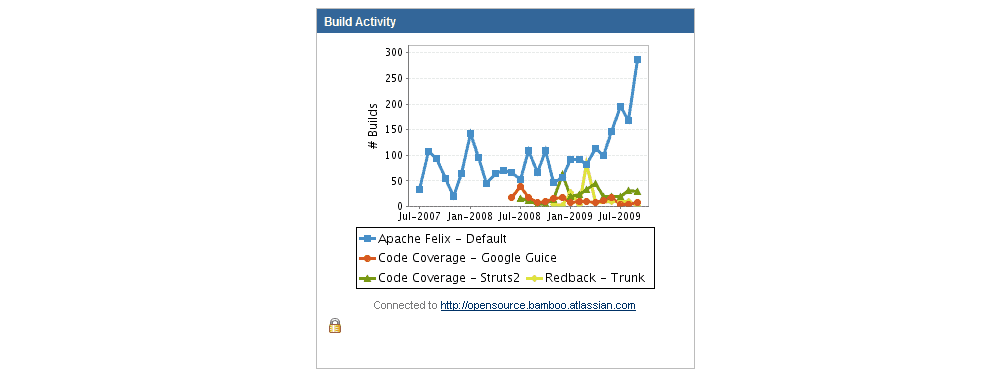
Bamboo is a continuous integration and deployment tool that combines automated builds, tests, and releases in a single workflow, and connects with Jira Software. If you have Bamboo, then the Bamboo Charts gadget is a great choice for a wallboard. It displays various charts and plan statistics from a particular Bamboo server, showing everyone the status and health of the build and thereby giving visibility to the most important metric your team maintains.
Note: your Jira administrator must have configured the Bamboo plugin on your Jira server if you want to add this gadget to your wallboard. Also, you may get a message that looks like this when you add the gadget:
“The website you have placed this gadget on is unauthorized. Please contact your system administrator to have it approved.”
Fixing this problem involves doing a bit of configuration on your Bamboo site so that Jira can pull information from it. First, your Jira administrator will need to define your Jira site as an OAuth consumer in Bamboo. Second, you will be required to perform a one-off authentication in Jira, after which the gadget should display correctly.
These are the gadgets we think would make a powerful information radiator, showing the essential metrics for an ongoing Scrum project and keeping your team’s (and passing stakeholders’) attention focused. You can try other gadgets to see which ones display your data well on a wallboard. You can also experiment with custom styling and slideshows. Your Scrum Master should find ways of testing which gadgets are most effective at motivating the team and adapt your wallboards accordingly—which is fortunately very easy in Jira!
Do you agree with our selection? Which gadgets do you ‘radiate’ on Jira Wallboards?
Sign up for a demo
Request demo
Custom Charts for Jira
Build charts and dashboards to evaluate delivery, capacity, and speed for all teams with Jira's most flexible custom reporting app
Start a Free TrialWe know some Jira users aren’t clear on the difference between Jira reports and Jira gadgets (or which are better). So let’s walk through it.

Remote workers can get just as much benefit from a Jira wallboard as their office counterparts. And Custom Charts Shared Dashboards can help.

This ultimate guide to Jira reporting explains how to create a Jira dashboard that tells your team what they want to know, the right way.

Discover the best Jira dashboard examples to track sprint progress, visualize key metrics, and customize reports for a more efficient workflow.
Jira Version Reports provide excellent visibility of your delivery timeline so that scrum teams can manage risk and identify uncertainty.

When you report on epics in Jira, you get a big-picture view of the work being done. Find out how to visualize your epics on Jira dashboards.

Custom Charts for Jira and Custom Jira Charts for Confluence now have the ability to display multiple calculations in a single chart.

Timesheets offers a variety of real-time business intelligence for executives, account managers, project managers, and team members

This guide walks through every real way to share a Jira dashboard externally, when each one fits, and a decision framework so you stop guessing.





















