Writing an executive summary that hooks readers
Someone needs to keep an eye on the big picture. That’s why executives must maintain a zoomed-out view. It also means they don’t have time to pore over extensive business documents in search of critical data. Leadership needs information that’s concise, easy to understand, and – above all – correct.
Enter the executive report – a document designed to provide a big-picture summary executives can use to get an immediate outline of a business’s or initiative’s current performance.
What is an executive report?
Unlike more comprehensive internal reports, an executive summary is limited to the essential highlights of its subject. Summaries are short – generally one page – and jargon-free, offering a brief overview of critical information using visuals like graphs, charts, and diagrams to illustrate data from a specific period – often a month, quarter, or year.
The C-suite uses data from executive reports to inform business-critical decisions. Management may include these summaries as supplementary information for project proposals, marketing plans, or business proposals.
Although there’s an established schedule for executive summaries, it isn’t rigid. Managers produce executive reports whenever they need to summarize findings from critical business segments and assist executives in creating an action plan.
Use cases include:
Highlighting a developing issue that requires immediate attention
Fulfilling a request from investors or creditors for a summary of the company’s business plan
Onboarding new clients who need to understand the workflow
Informing expansions of business operations
Proposing solutions for an underperforming department
Preparing for a change in the marketplace that poses a new challenge or opportunity
Benefits of executive reporting
Executives are busy. When they need answers, they need them fast. An executive summary lets them keep a finger on the pulse of company operations. But these reports don’t just keep decision-makers informed. Executive reports also provide the following benefits:
1. Present data in an easy-to-understand format
Summaries enable visual analysis using:
Tables
Charts
Graphs
Infographics
These allow your target audience to grasp the content swiftly, whether they are the CFO or a potential investor.
2. Increase data accessibility
Many digital reporting tools and platforms offer access via smartphone so executives can retrieve essential data while on the go.
3. Identify challenges and opportunities
Executive reports may provide insights into the performance of each business team or department. Upper management can quickly discern their contributions to the company’s bottom line and identify pain points that impact long-term success.
4. Enable evidence-based decision-making
Executive reporting captures the most relevant and up-to-date information. With data and supporting evidence, summaries empower company leadership to respond quickly and confidently to a volatile marketplace.
5. Establish performance benchmarks
Regular reporting allows executives to gauge the company’s performance against goals established in the strategic plan. If the results don’t measure up, they can tweak strategy and process before significant impacts occur.
What should you include in an executive report?
Executive summaries are condensed and to the point – similar to an elevator pitch. They often provide readers with the data necessary to explain a business plan on the fly or answer an off-handed question regarding financial projections from a potential investor.
Although a summary doesn’t need paragraphs of information divided into headings and subheadings, it should include the following:
1. Results
The first thing stakeholders look for in an executive report is a summary of company outcomes. Talking about success is easy, but reporting shortfalls and weaknesses is equally important. Outline relevant OKRs or KPIs so readers can see the progress toward long-term goals and milestones.
2. Expenses and profits
The business’s bottom line is a key point of discussion, especially when establishing a financial plan or allocating resources. Including financial KPIs balanced against other success metrics ensures company leaders receive a holistic outlook of the company’s operations and performance.
3. Feedback
Companies are realizing business success relies on employee engagement. Soliciting employee input on business operations encourages feelings of inclusion and accountability among staff. By including team member’s ideas in the executive summary, you give voice and representation to individuals outside the management team who may not have the opportunity to speak up during quarterly meetings.
Executive reporting best practices
Along with all the usual best practices, such as proofreading and using templates to standardize your reports, here are a few suggestions to help you write effective executive summaries:
Use visualization tools
Executive summaries primarily use graphs and charts to convey information. These visualization tools are essential for illustrating your data.
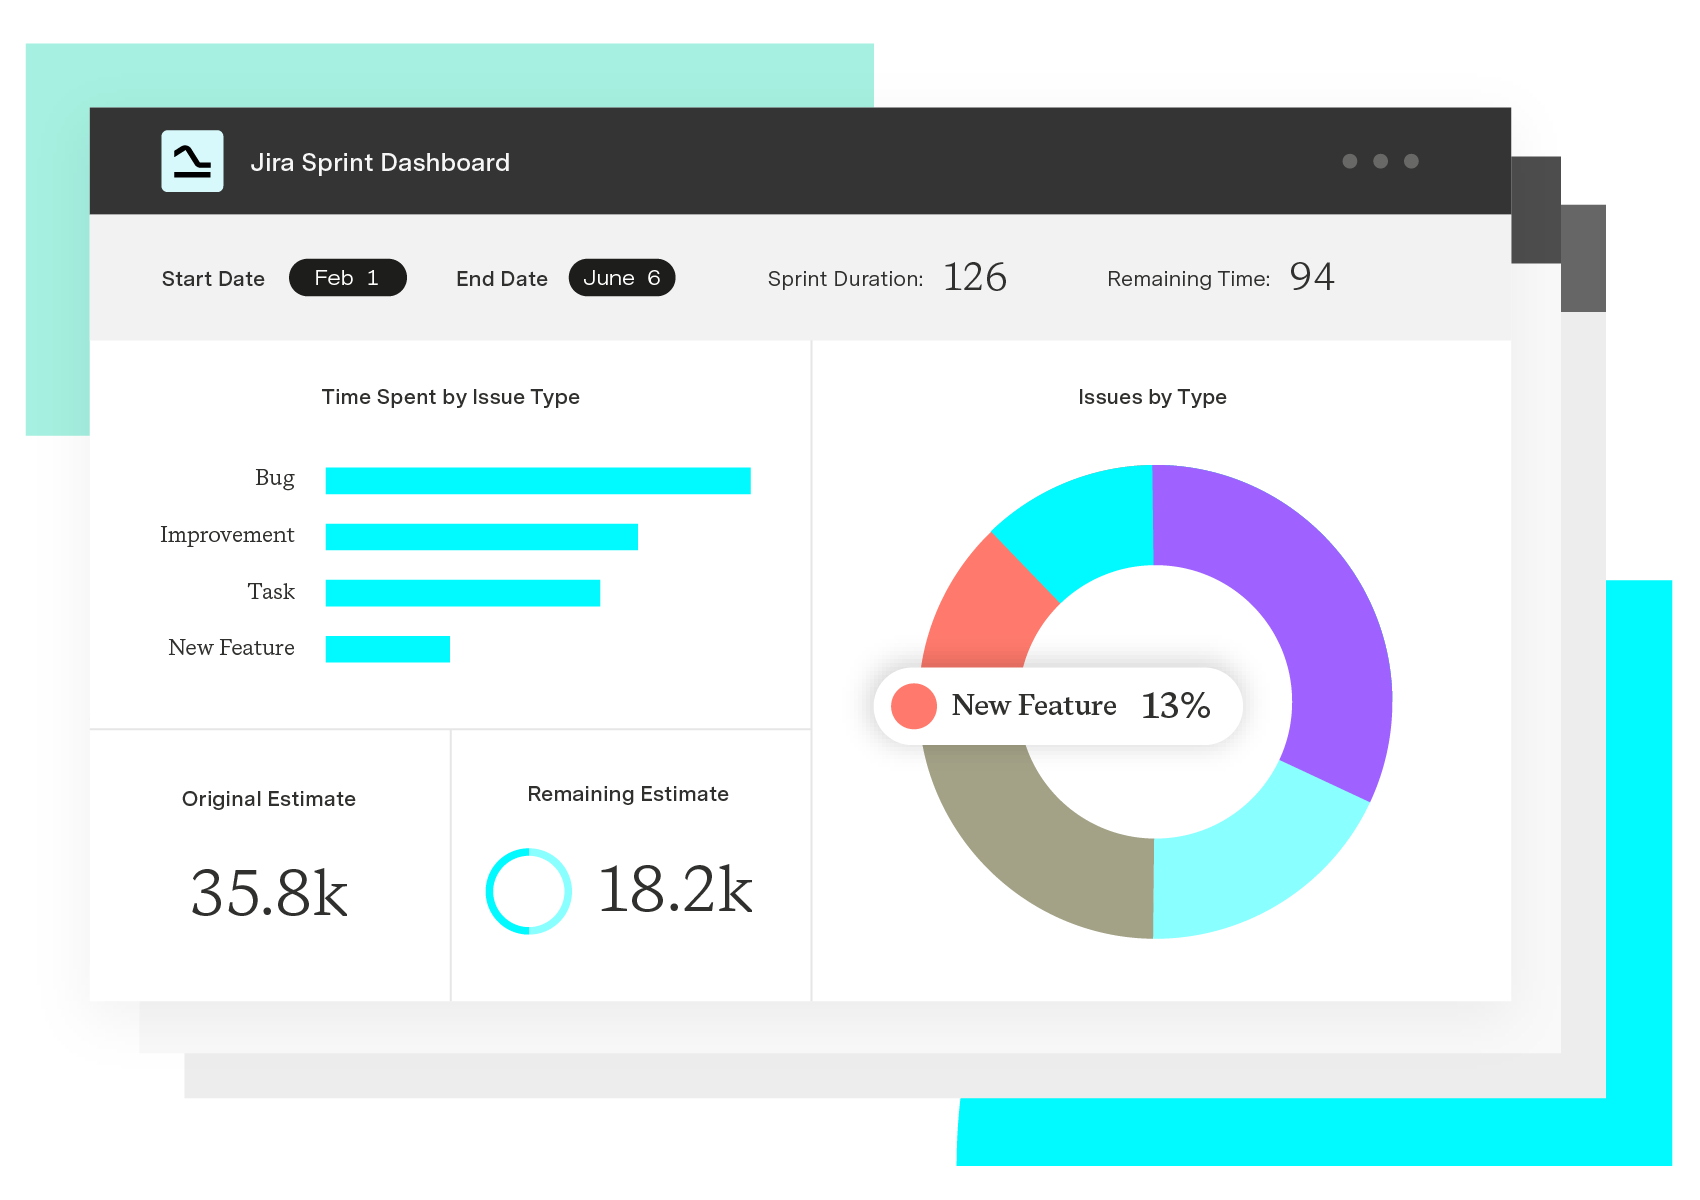
Your organization probably leverages many different systems to log information. This isn’t a problem for Jira users. You can download the Elements Connect app from the Atlassian Marketplace and integrate it into your Jira technology stack. The application allows you to populate custom fields within Jira with data from any source using:
Structured Query Language (SQL)
Databases
Lightweight Directory Access Protocols (LDAPs)
Representational state transfer application program interfaces (REST APIs)
Jira itself
Once Elements Connect is associated with your request types, you can begin reporting on them using Custom Charts for Jira to configure a Jira dashboard that tracks and visualizes the data sets for your executive summary.
Select the appropriate KPIs
Carefully selected KPIs help you accurately gauge your company’s performance. KPIs must be SMART: specific, measurable, achievable, relevant, and time-bound. They should also reflect the company’s priorities. The KPIs in your executive summary should provide up-to-date insights.
Be selective about which measures you include in your report. Summaries are brief, so there’s no need to describe every departmental KPI.
Keep your audience in mind
Your audience dictates the information you’ll include in an executive summary. Investors will want a different data set from the board of directors. Consider the objectives and interests of your readers to ensure you supply relevant information using effective presentation methods.
Be transparent
Even if you’re the only person responsible for writing the summary report, your whole team should understand the process. When you’re transparent about the undertaking, team members with a thorough understanding of your systems can offer input regarding which metrics to track.
Use multiple data sources
You may be tempted to exclusively secure data from significant sources, but a complete overview requires information from every part of your data stack. Enrich your content and provide a holistic view of the company’s status by including data from:
Customer Relationship Management (CRM) platform
Point of sale
Project management tools
Website analytics
Tell a story
Executive summaries center on facts and data, but they don’t need to be dry and dull. Whether you’re delivering the results of a marketing analysis or the financial projections of a new business idea, use your data to establish a compelling narrative. You’ll grab decision-makers’ attention and make your report easier to follow.
Use Tempo solutions to create your executive reports
Writing an engaging executive summary is challenging. Fortunately, Tempo does the heavy lifting to visualize your data. Custom Charts for Jira is intuitive, using a drag-and-drop interface to create customized graphs, charts, and diagrams that illustrate your results.
If you’re reporting on your project plan, outline your team’s progress with a boardroom-ready roadmap generated by Tempo Strategic Roadmaps. Both platforms are Jira-enabled and ready to be integrated into your current solution.
Sign up for a demo
Request Demo