Learn the secrets of drafting a compelling executive report that gives the C-suite valuable data and insights to support informed decisions.
Learn the essential elements of a CEO report, including topics, data sources, and formatting, with our comprehensive template.

A CEO report is essential for documenting a company’s overall health. It charts the organization’s progress toward goals, objectives, achievements, and outcomes.
The report includes data that senior leadership uses to evaluate its strategies and guide its decisions for the upcoming reporting period. The chief executive officer publishes the report as part of the monthly board meeting agenda and distributes it among delegates, key stakeholders, and employees.
Although CEO reports cover a lot of ground, they follow a standard format. Once you’ve drafted your first, you can use it as a template to speed up the creation of subsequent documents. Here’s what you need to know to get that first report under your belt.
A CEO report offers insight into an organization’s overall health, progress, and trajectory by reviewing its performance, key initiatives, and strategic outlook over the chosen period.
The report provides the board of directors, shareholders, and employees a high-level glimpse into the company’s current status, including:
Financial highlights
Operational updates
Key performance indicators (KPIs) and metrics
The document serves as a critical analytical tool, distilling past trends and real-time insights into a visually digestible and intuitive format using videos, graphics, and interactive charts. CEOs may distribute the report as a physical document or a digital file, depending on the preferences of the board of directors and the executive team.
CEO reports benefit the company by delivering:
Data to inform decision-making
Universal access to critical information
Improved relations and communication between the CEO, board members, and executive team
Increased employee engagement and confidence in company leaders
To answer questions and guide the decisions of the board of directors, the CEO report should communicate the following elements:
Offer a brief overview of central insights into the company’s performance for the relevant period.
Profile the company’s bottom line by including data from critical financial metrics, such as:
Gross profit margins
Production
Operating expenses
Monthly revenue
Customer lifetime value and acquisition costs
Include any significant news regarding:
Revenue and earned profits
HR metrics, including hiring, current team size, and employee morale
Product roadmap and updates
Feature launches
Marketing campaigns
Deliver a status update on the company’s strategic plans, corporate vision, and operating policies.
Provide background on topics currently blocking the company from attaining peak operational efficiency and results.
Outline the latest consumer trends, industry developments, and technological advancements that affect the company’s position within the marketplace and that of its competitors.
Discuss any changes in corporate leadership, business operations, or government regulations that impact business activities.
Provide an overview of the next steps, including plans to capitalize on development and growth opportunities (e.g., strategic adjustments to address shortfalls or re-align operations with long-term goals).
Your first CEO report may seem daunting, but you’ve worked your entire career for this responsibility, proving you have the know-how. An organized approach will ensure you cover all the bases.
CEO reports focus on one of two audiences: company employees or stakeholders and investors.
If the document targets staff, collaborate with HR to spotlight high-performing leaders within the team and discuss current and future hiring needs.
For reports addressing stakeholder interests, include information on the company’s finances and growth plans. Before publishing, consult with the CFO to ensure your report complies with regulatory requirements and safeguards sensitive information.
Summarize the organization’s activities and decisions for the reporting period. Provide a holistic view of the company’s current position by gathering data to outline specific outcomes, be they positive, negative, or neutral.
The bulk of your CEO report reviews significant developments and offers insights into the company’s future using up-to-date data. It may be tempting to gloss over company shortfalls, but such a decision risks damaging accountability and eroding trust.
Instead, be forthcoming and accountable regarding missed targets. Explain the reason you established these goals and why the outcomes fell short.
Follow up on the previous section with a plan to maintain successes and avoid repeating mistakes. Outline your action plan to progress toward milestones using practical steps and a realistic timeframe.
Bring all these elements together into a concise, detailed document that follows a logical progression. Ensure you maintain the same voice throughout. Include graphs, charts, and diagrams – with references – to illustrate your data and make it easy for stakeholders to understand and conduct further research.
As with any document, ask a direct report to proofread the copy before publication.
If you’re unsure how to structure your report, try the following template:
Company logo
Branded color scheme
Proprietary font for titles, headings, and subheadings
CEO Report: (Month/Quarter/Year)
Report date
Executive summary
Key performance indicators (KPIs)
Current revenue compared to the previous reporting period
Profit margins (gross versus net margins)
Expense breakdown
Output metrics or production levels
Quality control outcomes (defect rates or improvement measures)
Inventory management (turnover and stock levels)
Market share compared to competitors
New customer acquisition and market expansion
Customer churn rates and retention strategies
Productivity metrics or performance indicators
Survey results or feedback measuring employee engagement
Professional development strategies such as training initiatives, promotions, and retention rates
Staff highlights and achievements
Improvement opportunities and focus areas
Action plans
Future outlook
One of the best data sources for creating a CEO report is your team’s reporting tools. These platforms can provide invaluable insight into operational performance, productivity, and outcomes:
IT service management
Task management
Project management
Customer service management
As CEO, you’re responsible for the company’s big picture. You probably don’t work with these systems. Direct reports provide regular status updates that include this data, or you can find a tool to help you access the information independently.
One such reporting tool is Atlassian Confluence. Confluence integrates fully with Jira platforms, allowing you to create a reporting dashboard that gathers the KPIs, metrics, and other necessary data from these various sources into one location.
But native Confluence functionality only goes so far. To extend your executive dashboard, download Tempo’s Custom Jira Charts for Confluence. It offers more flexibility for filtering, visualizing, and reporting on company data.
Custom Charts not only facilitate data analysis but also convert data into graphs and charts. These visual representations highlight issue statuses across all Jira projects, identify at-risk issues, and display yearly sales revenue growth. By customizing and incorporating these data visualizations into your reports, you can clearly and effectively showcase your company's performance to readers.
Combine Custom Charts with Strategic Roadmaps to create roadmaps of your strategic and operational plans. Strategic Roadmaps helps capture stakeholder attention by illustrating priorities, milestones, and dependencies while charting progress toward company goals. You can even embed Strategic Roadmaps into your executive dashboard in Confluence.
With CEO reporting, you’ve got a lot of ground to cover. Roadmaps can be your secret weapon to optimize the process. Use the application to visualize what work you’ve completed and what’s left.
By leveraging the power of Tempo, you’ll handle CEO reporting like a boss.
Sign up for a demo
Request demo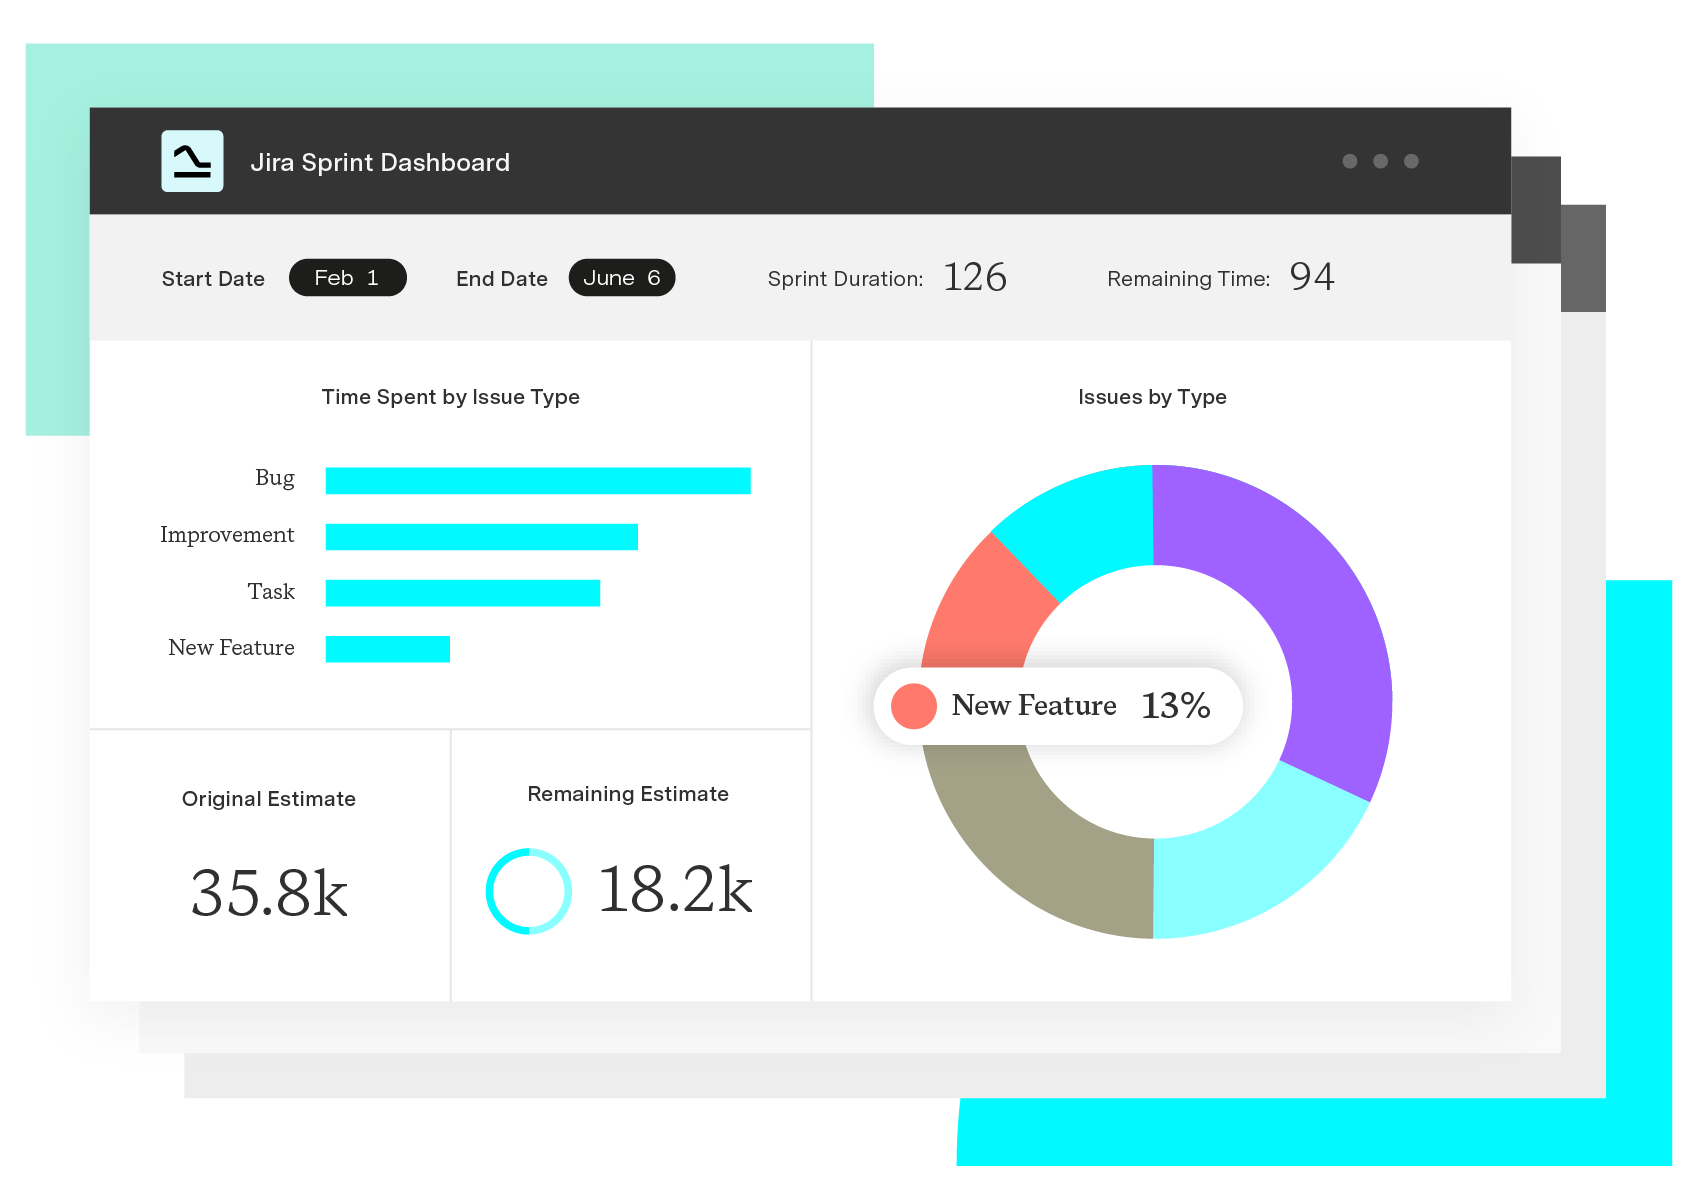
Custom Charts for Jira
Build charts and dashboards to evaluate delivery, capacity, and speed for all teams with Jira's most flexible custom reporting app
Start a Free TrialLearn the secrets of drafting a compelling executive report that gives the C-suite valuable data and insights to support informed decisions.

Learn how to write valuable project status reports that keep your team aligned with project goals and stakeholders informed.

Learn how to draft sound financial reports to track organizational performance and make sound business decisions that safeguard the company’s future.

Discover how operational data, such as sales transactions and system logs, empowers businesses to boost efficiency and effectively manage risk.

Learn how to write an effective project progress report with our step-by-step guide and actionable best practices.

Leverage performance measurement and analytics to improve organizational performance and make data-informed decisions about the company’s future.
Learn to conduct a needs assessment by following seven simple steps, and gain insights vital to creating an effective and realistic strategic plan.

How to understand, report, and share your ServiceNow data with powerful and customizable Power BI dashboard templates

Discover the importance of operational plans, their distinction from other planning approaches, and how to craft your own.