

Plan, balance, and forecast portfolio capacity with Tempo's Capacity Planner and Structure PPM – built for enterprise PMOs.
Connect delivery, capacity, and financial data in real time with Tempo's Custom Charts, Structure PPM, and BI Connectors.

CIOs are not short on data about their IT portfolio. They are short on a connected view of it. Delivery status lives in Jira, capacity lives in a spreadsheet, financials live in the ERP, and the executive dashboard is a slide rebuilt every Friday. By the time the picture is assembled, decisions have already been made on instinct. Integrated IT portfolio analysis is the antidote: A single, real-time view of how investment, capacity, and delivery track against strategy.
Integrated IT portfolio analysis brings delivery, capacity, financial, and strategic data together so IT leadership can see the portfolio as one system rather than a stack of disconnected reports. Instead of "how is this project going?" the question becomes "how is the portfolio paying off, and where should we double down or stop investing?"
The integration is the hard part. Most enterprises have the underlying data – work in Jira, time and effort in a tracking system, costs in finance, KPIs in BI tools. What they lack is the connective tissue that lets a PMO director, a CIO, and a CFO look at the same numbers and reach the same conclusion in the same meeting.
Done well, integrated portfolio analysis turns IT from a cost center reporting upward into a strategic function steering investment in real time.
The cost of fragmentation is concrete. Gartner projects that 70% of digital investments will fail to deliver their expected outcomes by 2025 without an SPM approach, and the 2023 State of Agile Report found nearly one in three respondents are unhappy with, reevaluating, or shifting off their current planning tool. The shared symptom is the inability to see the portfolio whole.
For CIOs and CTOs, integrated analysis is how you defend the IT budget to the CFO, prove the strategic ROI of the roadmap to the board, and pivot mid-year when a market shift or regulatory change rewrites priorities. For PMO directors, it is how you stop spending half of every quarter rebuilding the same status decks. For finance partners, it is how you tie spend to outcomes with audit-grade traceability.
The organizations that get this right do not have more data. They have shorter latency between delivery reality and executive view, and they trust the numbers enough to act on them.
One source of truth. Connect Jira delivery data, time, capacity, and cost in views your executives, PMO, and finance partners all share.
Real-time KPI tracking. Replace weekly status decks with dashboards that refresh as work progresses.
Custom views for every audience. Show executives strategic outcomes, PMOs program health, and finance the cost picture, all from the same underlying data.
BI tool integration. Pipe Jira and Tempo data into Power BI, Tableau, BigQuery, Looker Studio, or your existing SQL warehouse for enterprise analytics.
Audit-ready governance. Permissions, time records, and approval trails support the controls regulated industries require.
The reporting layer is Custom Charts for Jira. It turns Jira and Tempo data into customizable dashboards on Jira and Confluence pages – pie, bar, line, funnel, table, and tile visualizations – without requiring Jira admin expertise to build them. Business users build the views they need, and executives stop asking analysts for screenshots. Custom Charts pulls from native Jira fields, third-party app fields (Scriptrunner, Xray, Advanced Roadmaps, Insight), and Tempo data such as logged time, accounts, and Structure hierarchies.
As of early 2026, Custom Charts treats Structure PPM as a first-class data source. When configuring a chart, "Structure" is selectable from the Source dropdown alongside JQL and Filters, and you choose the specific hierarchy the chart should report against. The chart pulls the issues contained in that structure, respecting the dynamic Generators configured in Structure PPM – so the dashboard view stays consistent with the portfolio view leadership already trusts.
For Cloud customers, this closes a long-standing gap. Structure PPM Advanced on Cloud has not had a robust first-party dashboard gadget; the Custom Charts integration is now that gadget. It is tuned for Cloud performance, avoiding the loading timeouts that plague complex JQL-based dashboard gadgets, and it turns a multi-level Structure hierarchy into a 2D bar chart, tile chart, or pie chart on the main Jira dashboard. Custom Charts can also read many of the custom attributes and progress values calculated inside structures, so formula-driven metrics carry through into the visualization.
This is a true first-party integration across the Tempo portfolio, not a third-party connector. It came out of Tempo's acquisition of Old Street Solutions, the original creators of Custom Charts.
Beneath the reporting layer, Structure PPM organizes the underlying work into the hierarchies leadership uses to think about the portfolio – by program, by business capability, by strategic objective. Structure makes "the IT portfolio" a queryable object rather than a folder tree, and Custom Charts visualizes it.
For enterprise BI, Tempo's BI Connectors – Power BI, Tableau, BigQuery, Looker Studio, and SQL Connector for Jira – pipe Jira and Tempo data into the analytics platforms finance and central IT teams already run. Portfolio analysis no longer stops at Confluence; it extends into the same warehouse and BI environment that powers the rest of the business. (The BI Connectors come from Tempo's Alpha Serve acquisition.)
Together, Custom Charts and the BI Connectors form Tempo's Portfolio Collection, built for enterprises that need data-driven governance and reporting across multiple portfolios. Paired with Structure PPM, Capacity Planner, and Financial Manager, the same dashboards begin to answer harder questions: Not just "how is delivery tracking?" but "is the capacity of our highest-cost engineering teams aligned to our highest-priority strategic outcomes?"
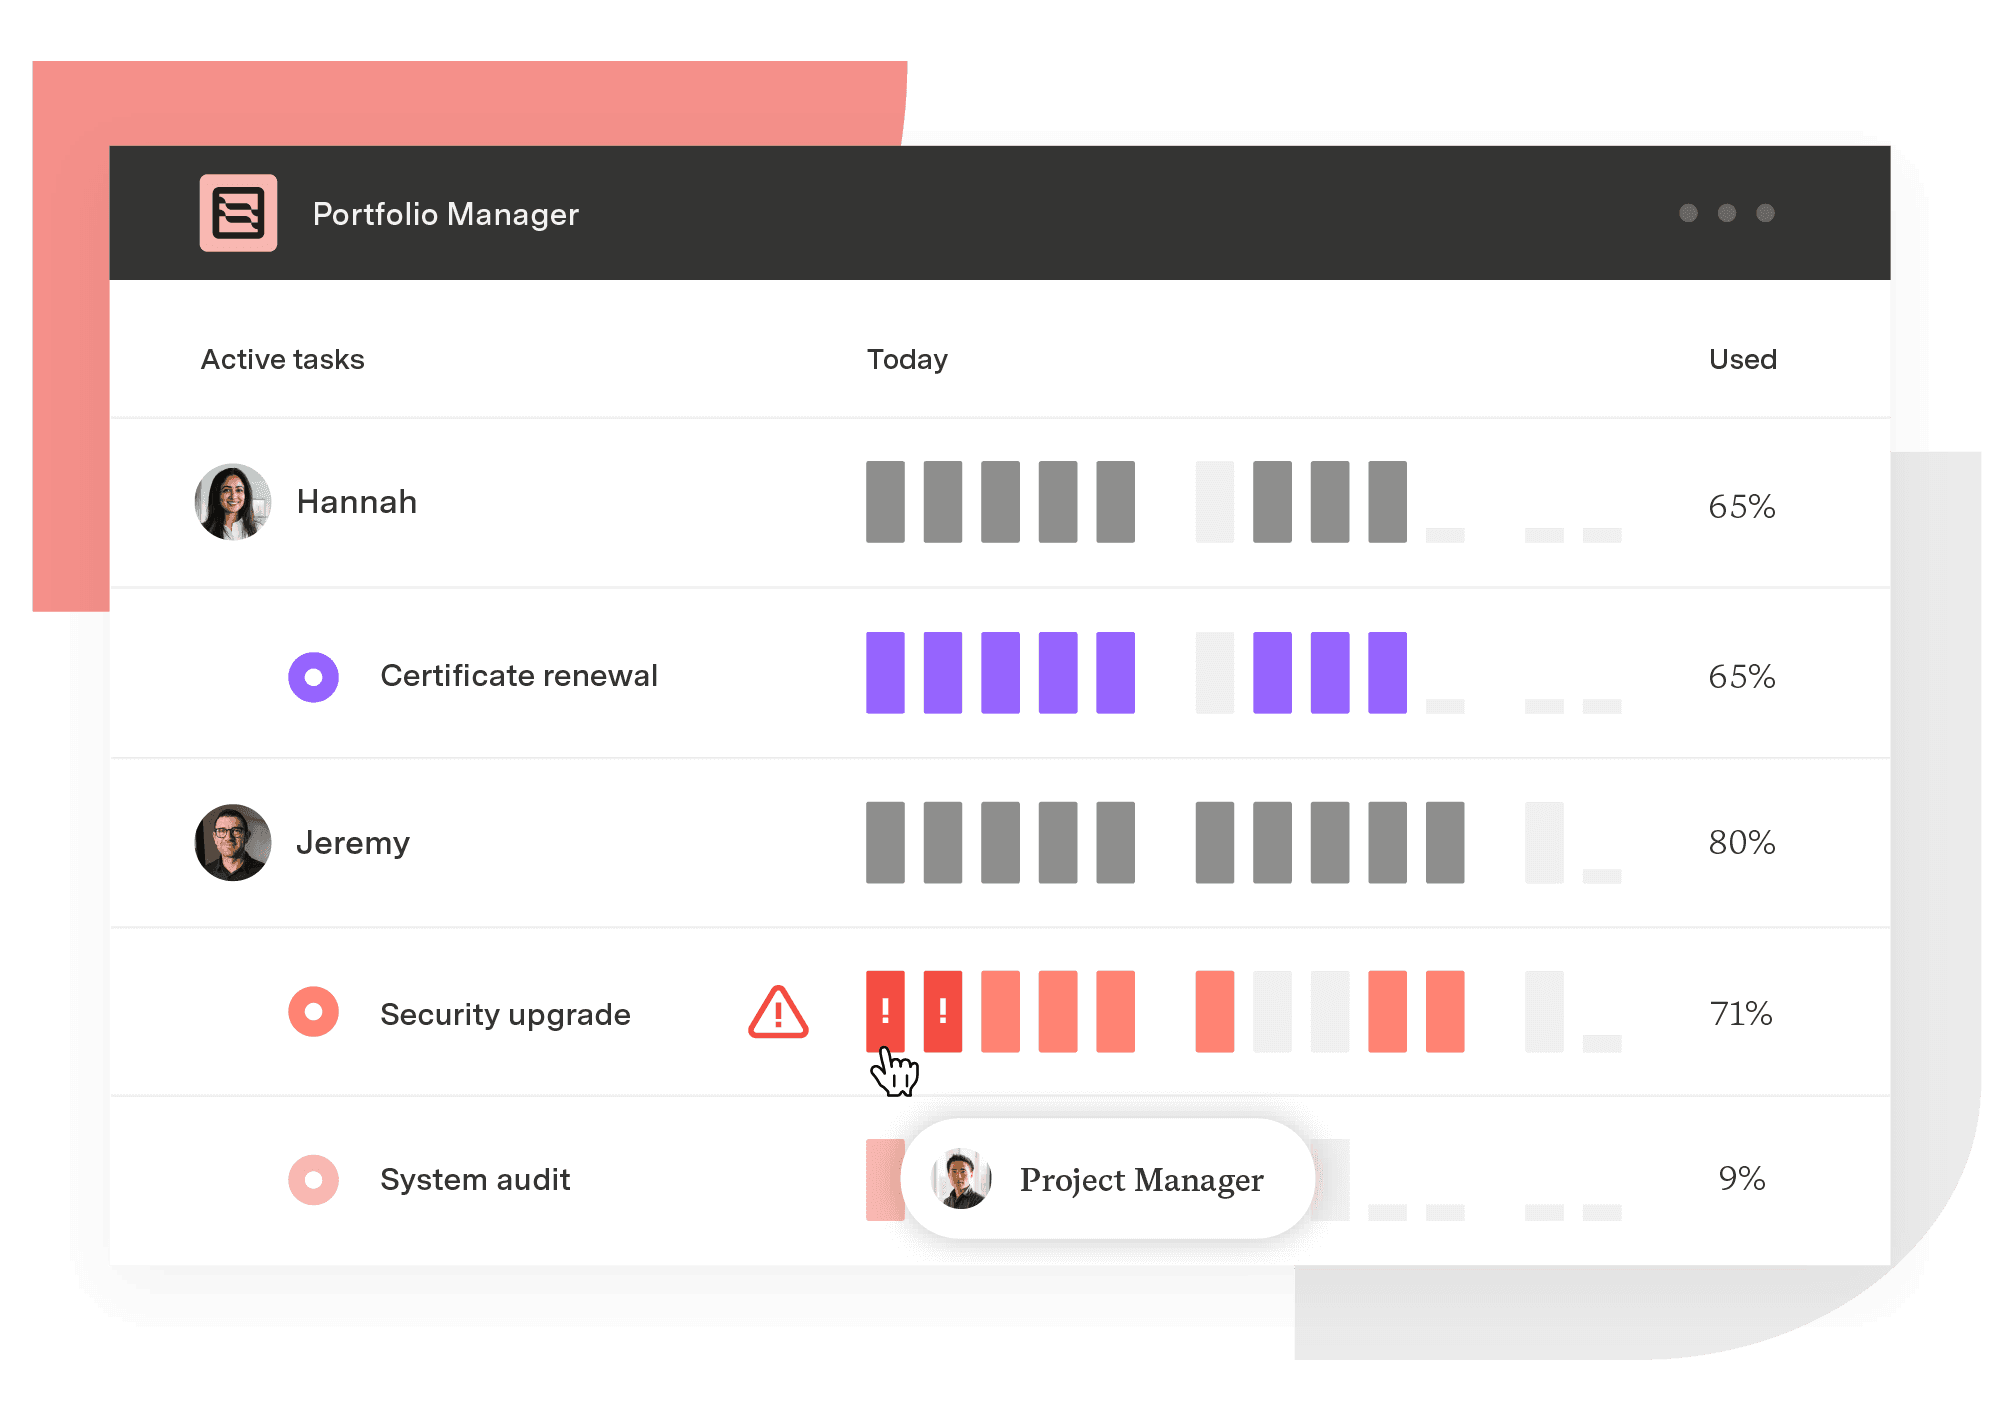
Portfolio Manager
The only project management solution that adapts to change and manages uncertainty to help teams plan, predict, and perform.
Start a Free TrialCouldn't find what you need?Go to our documentation
Tempo's BI Connectors – Power BI Connector, Tableau Connector, BigQuery Connector, Looker Studio Connector, and SQL Connector for Jira – move Jira and Tempo data into the analytics platforms enterprises already use. They install through the Atlassian Marketplace and integrate with existing data governance.
Yes. Custom Charts for Jira now supports Structure as a direct data source on Cloud, which serves as the first-party dashboard gadget for Structure PPM Advanced. Charts pull from a specific structure, respect its Generators, and render on the main Jira dashboard as 2D bar, tile, or pie visualizations – without the timeouts common to complex JQL-based gadgets.
The data foundation is Jira, but the analysis is not stuck there. Custom Charts surfaces views in Jira and Confluence; the BI Connectors push data into Power BI, Tableau, BigQuery, Looker Studio, and SQL warehouses, so portfolio analysis lives wherever your enterprise reporting lives.
That is the point of the architecture. Custom Charts and the BI Connectors draw from a single source – the work and time data captured natively in Jira through Structure PPM and Timesheets – so finance and IT views are built from the same records, with permissions controlling who sees what.
Plan, balance, and forecast portfolio capacity with Tempo's Capacity Planner and Structure PPM – built for enterprise PMOs.

Tempo is updating pricing for Cloud and Data Center apps on September 15, 2025. Learn what’s changing, why, and how to plan ahead.
Tempo's Structure PPM, Gantt Charts, and Timesheets close the gap between strategy and shipped outcomes at portfolio scale.

BigPicture can't answer your CFO's CapEx question. Compare Structure PPM, Jira Plans, BigGantt, EazyBI, and Jira native on financial governance.

Learn how Tempo amplifies Jira across capacity planning, time tracking, financial management, and reporting – all in one connected system.

See how Structure PPM brings overdue task tracking into Jira with real-time reporting, dashboards, and portfolio rollups built for delivery teams.

Plan sprints inside a longer schedule. Connect agile execution to portfolio delivery dates with Gantt Charts for Structure PPM.

How to move Tempo data from Jira to any business intelligence tool with a user-friendly interface, flexible configuration, and no technical skills.

Everything you need to know about ServiceNow and Tempo’s connectors, why you should connect these tools together, and the use cases.

















