

This ultimate guide to Jira reporting explains how to create a Jira dashboard that tells your team what they want to know, the right way.

A client asks for a live view of project status. A partner wants to see the roadmap. An executive wants numbers without logging into anything. Jira gives you two options: Make the dashboard and all spaces and items in it public and viewable by anyone, or give the person a Jira license just to look at a chart.
Neither fits most requests. You want something secure enough for real data, but simple enough that the recipient does not need an account.
This guide walks through every real way to share a Jira dashboard externally, when each one fits, and a decision framework so you stop guessing.
Jira was not built with outside viewers in mind. It was built for licensed users inside your instance, and that shows up in two structural walls the moment you try to share a dashboard beyond your team.
The first wall is that for your dashboards to display issues, the spaces and items also need to be shared with anonymous users. That means giving access not only to what you are displaying but also to any underlying data points you might not want people to see.
The second wall comes if you don’t want to enable anonymous access: Licensing gates viewing, not just editing. In most Jira setups, even read-only access needs a seat. A client who just wants to check on their project's status ends up needing the same access as someone building workflows and configuring automation rules.
None of this is a knock on Jira. It was built for internal teams, and it does that well. But once external stakeholders enter the picture, you are working around a gap rather than using a built-in feature. Worth naming up front, so the rest of this guide makes sense.
How it works: Jira admins can enable anonymous access at the instance or space level, which makes select dashboards and filters viewable by anyone with the link, no login required.
Best for: Fully public information. Open-source project trackers, public roadmaps, status pages for services people rely on.
Avoid for: Anything sensitive. Customer names, financial figures, internal timelines, or anything you would not want a competitor or a search engine to stumble across.
Recently, Jira introduced “guest users” who can get free access to a single space. They can see some information within it – but no elements outside that for context or extra information.
Step-by-step:
Check whether anonymous access is enabled under Jira Settings > System > General configuration.
If it is, an admin can set project-level permissions to allow anonymous browsing.
Build or select the dashboard, and confirm none of its gadgets pull from restricted projects.
Share the direct URL. Anyone with the link can view it, indefinitely, whether you meant them to or not.
How it works: Embed a Jira dashboard or filter as a macro inside a Confluence page, then share that page with the people who need it.
Best for: Internal-extranet style sharing, where recipients already work inside your Confluence instance, or where Confluence's guest access features cover your use case.
Limits: Recipients still need an Atlassian account, and in most setups, a Confluence license. Confluence does offer a guest view for select scenarios, but it comes with its own permission model to manage. For a client with no Atlassian footprint at all, this method adds friction rather than removing it.
Step-by-step:
Create or open the Confluence page meant for the audience in question.
Insert a Jira Issues macro or Jira Chart macro, then point it at the relevant filter, board, or project.
Set page-level permissions to restrict viewing to the intended group or space.
If external guest access is configured, invite the recipient through that flow instead of a standard Confluence invite.
This works well when your audience already lives inside Confluence for other reasons. It works less well the moment someone outside your Atlassian ecosystem needs a look.
How it works: Screenshot the dashboard, drop it into a slide deck or PDF, and send it.
Best for: One-time updates, executive readouts, client reports, and audit snapshots. Anywhere you need to hand someone a fixed view of the data as it looked on a specific date.
Avoid for: Live reporting, recurring stakeholder access, or any situation where the recipient needs to drill down, filter, or check whether the numbers have moved since Tuesday.
This method is handy for a quick board update or a compliance snapshot that needs to match a point in time. All the things that do not want a live dashboard changing under the reader's feet.
Where it falls apart is recurring access. Exporting the same chart every week for the same client is a manual job that a link could do automatically. It works for static reporting. It does not scale, and it is never current past the moment you hit export.
How it works: A dedicated, secure link renders a live Jira dashboard outside your instance, no login required. Admins control access, via an open link, a passcode, or both, and the page stays off search engine indexes.
Best for: Nearly every team sharing a Jira dashboard external link with someone outside their instance. Customers checking project status. Partners tracking a joint initiative. Executives who want numbers without a Jira seat.
The pattern is simple: Build the dashboard once inside Jira, generate a secure link, optionally lock it with an access code, and send it. The recipient sees a live, read-only view. They cannot edit anything. You can revoke or update the link anytime, and none of it shows up in a Google search.
Have an admin enable external sharing under the shared dashboard settings, and decide whether an access code is required.
Build the dashboard using Custom Charts gadgets, pulling in the status, workload, or priority breakdowns your audience actually cares about.
Generate the external share link from the dashboard's sharing options.
If using a passcode, set the requirements (length, character types) and share the code with your recipient through a separate channel, such as email.
Send the link. The recipient views a live, read-only dashboard, with no Jira account and no indexing risk.
Revisit access periodically, or as soon as a project or client relationship ends, and revoke the link.
For a client-facing case study readout, a partner dashboard, or an executive who wants numbers on demand, this is the method that fits without asking anyone to compromise on security or convenience.
Use this table to match your audience and your data to the right method before you build anything.
Your audience is… | And the data is… | Use… |
Open public (anyone on the internet) | Non-sensitive | Native public sharing |
Confluence-licensed colleagues | Internal | Confluence embed or Custom Charts |
Executives, clients, external partners | Sensitive or governed | Custom Charts via passcode |
Two questions do most of the work here: Who is looking, and what happens if the wrong person sees it. Fully public data for an anonymous audience is the one case where native sharing is fine, since there is nothing to protect. Everything else involves some access control, which is where licensing or a governed external link takes over.
Frequency matters, too. A one-time export is fine as a screenshot. Anything updated and re-sent on a recurring basis needs a live link.
If your answer landed on the last row, the next section walks through exactly how that works.
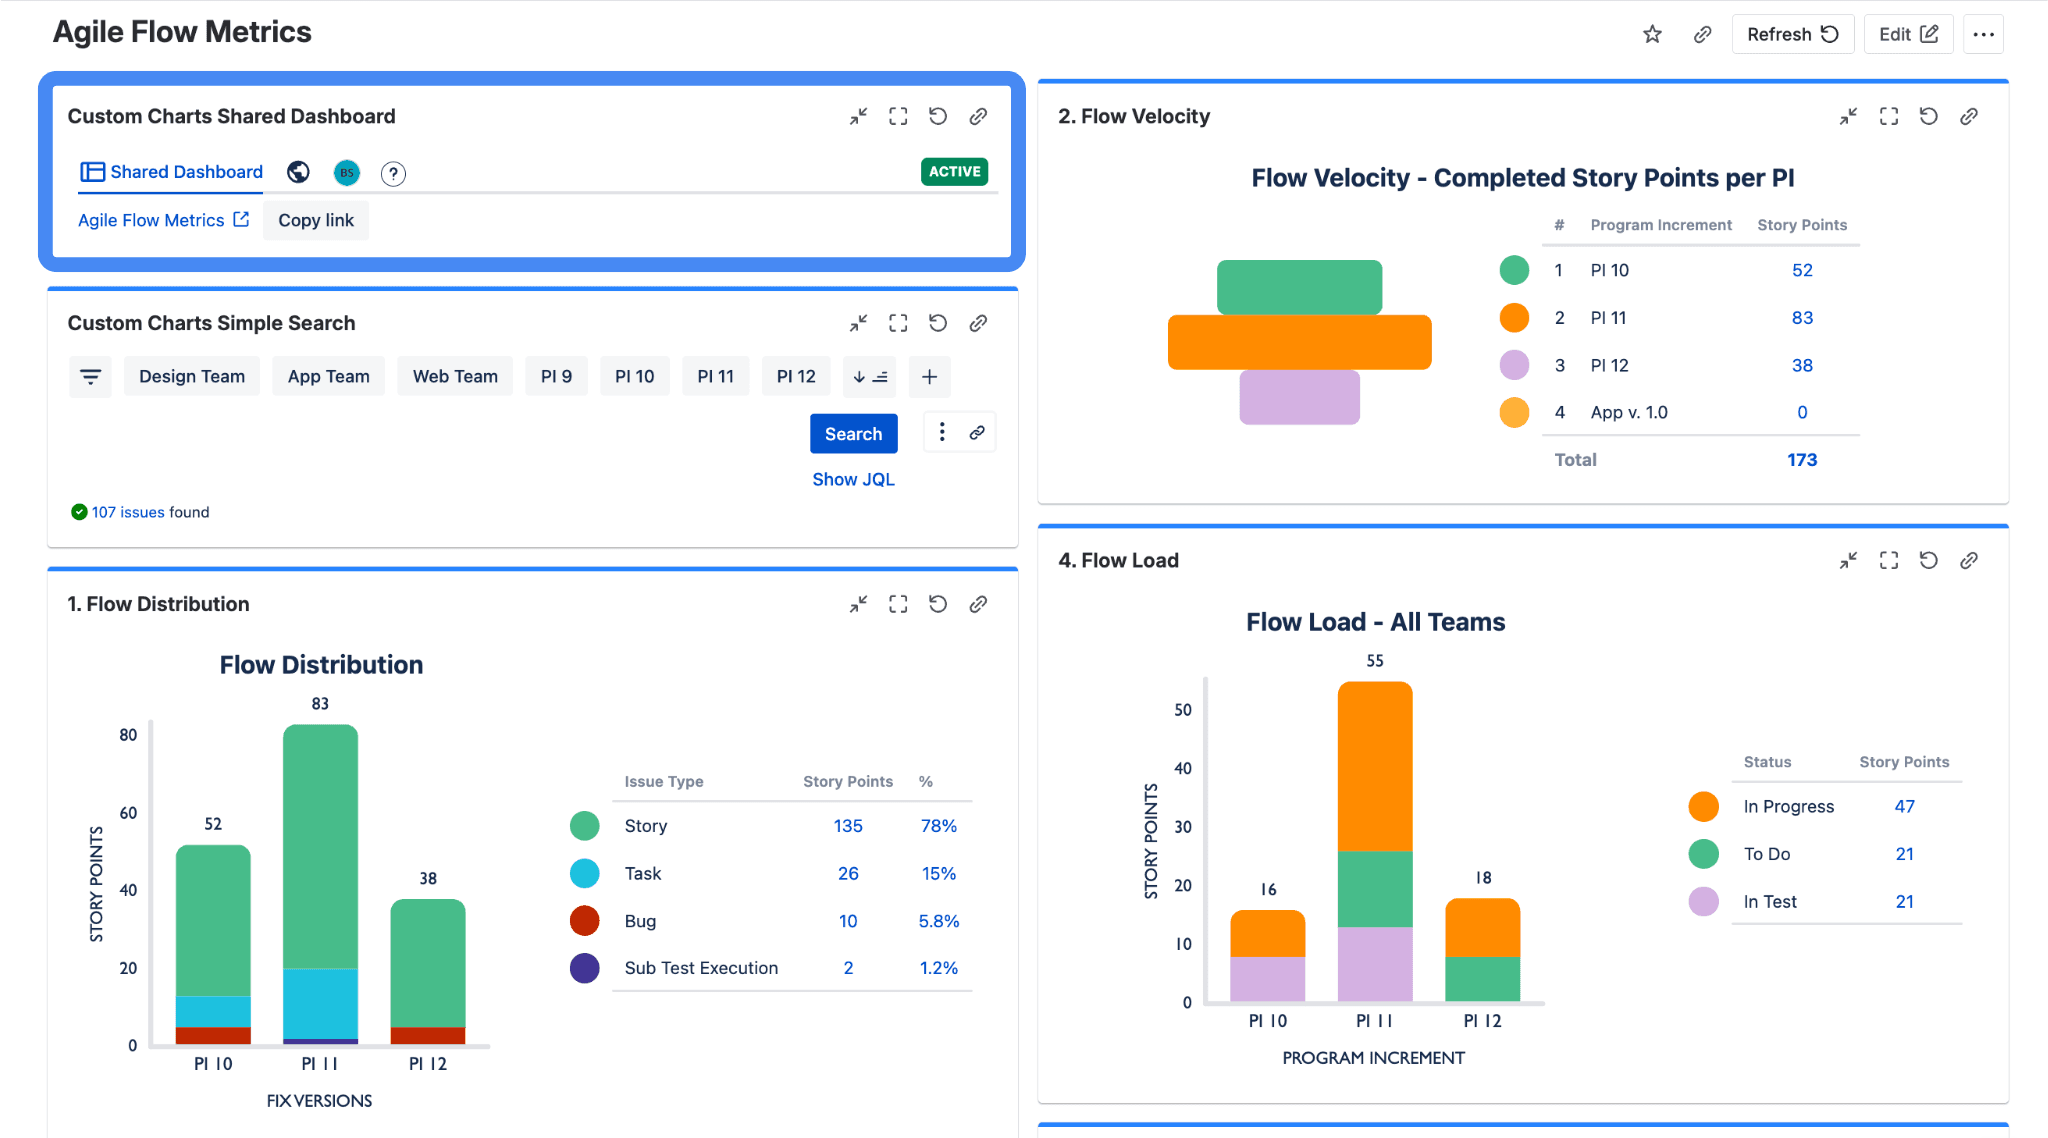
Most teams that need to share a Jira dashboard with customers, partners, or leadership end up here – so how do you do it?
Setup starts with an admin turning on external sharing for shared dashboard gadgets, and choosing whether to require an access code. From there, anyone building a dashboard can generate a link for it directly, without going back to an admin each time.
A few things set this apart from just posting a public link. One thing is that access can sit behind a passcode, so the link alone is not enough to get in. Additionally, the underlying data stays live, so a client checking their project status on Friday sees the same numbers your team sees internally, not a snapshot from three weeks ago.
Governance stays with your admins throughout. They decide which dashboards can go external, whether a code is required, and they can turn a link off the moment a project wraps. Nobody has to remember to revoke a Confluence seat or clean up a shared folder. The link either works or it does not.
This is also where Custom Charts earns its keep beyond the sharing mechanism itself. The dashboards you expose externally are built with Custom Charts gadgets, so you are not limited to whatever comes out of the box.
Pie charts for status mix, bar charts for workload by assignee, tables for a detailed breakdown, all buildable without JQL and without asking an admin to configure something custom. The chart a client sees externally is the chart your team built for internal use, wrapped in a secure, read-only link.
Take a look at Custom Charts for Jira to see the full gadget library this runs on.
Can I share a Jira dashboard with someone who doesn't have a Jira license?
Yes. Public shared dashboards can go to anyone, whether or not they have access to your Jira instance, or any Jira instance at all.
How do I share a Jira dashboard with a password?
Enable "Anyone with an access code" in your admin settings first. From there, set requirements for the code, such as minimum length or special characters. Once enabled, the access code option appears on your existing shared dashboard gadgets.
Can external users edit a shared Jira dashboard?
No. External viewers can see the dashboard and everything you choose to include on it, but they cannot edit or change anything.
What's the difference between sharing in Confluence and sharing externally?
Confluence embedding is the right call when a chart needs to live inside a written page, alongside a report, a wiki doc, or other narrative content. Public shared dashboards are built for the opposite case: a standalone destination that is just the data, with nothing else around it.
Native sharing, Confluence embeds, and static exports each solve a narrow slice of the problem. Custom Charts covers the rest, with live data, no license requirement, and access controls your admins actually manage. Take a look at Custom Charts for Jira and start a free trial to build your first external dashboard.
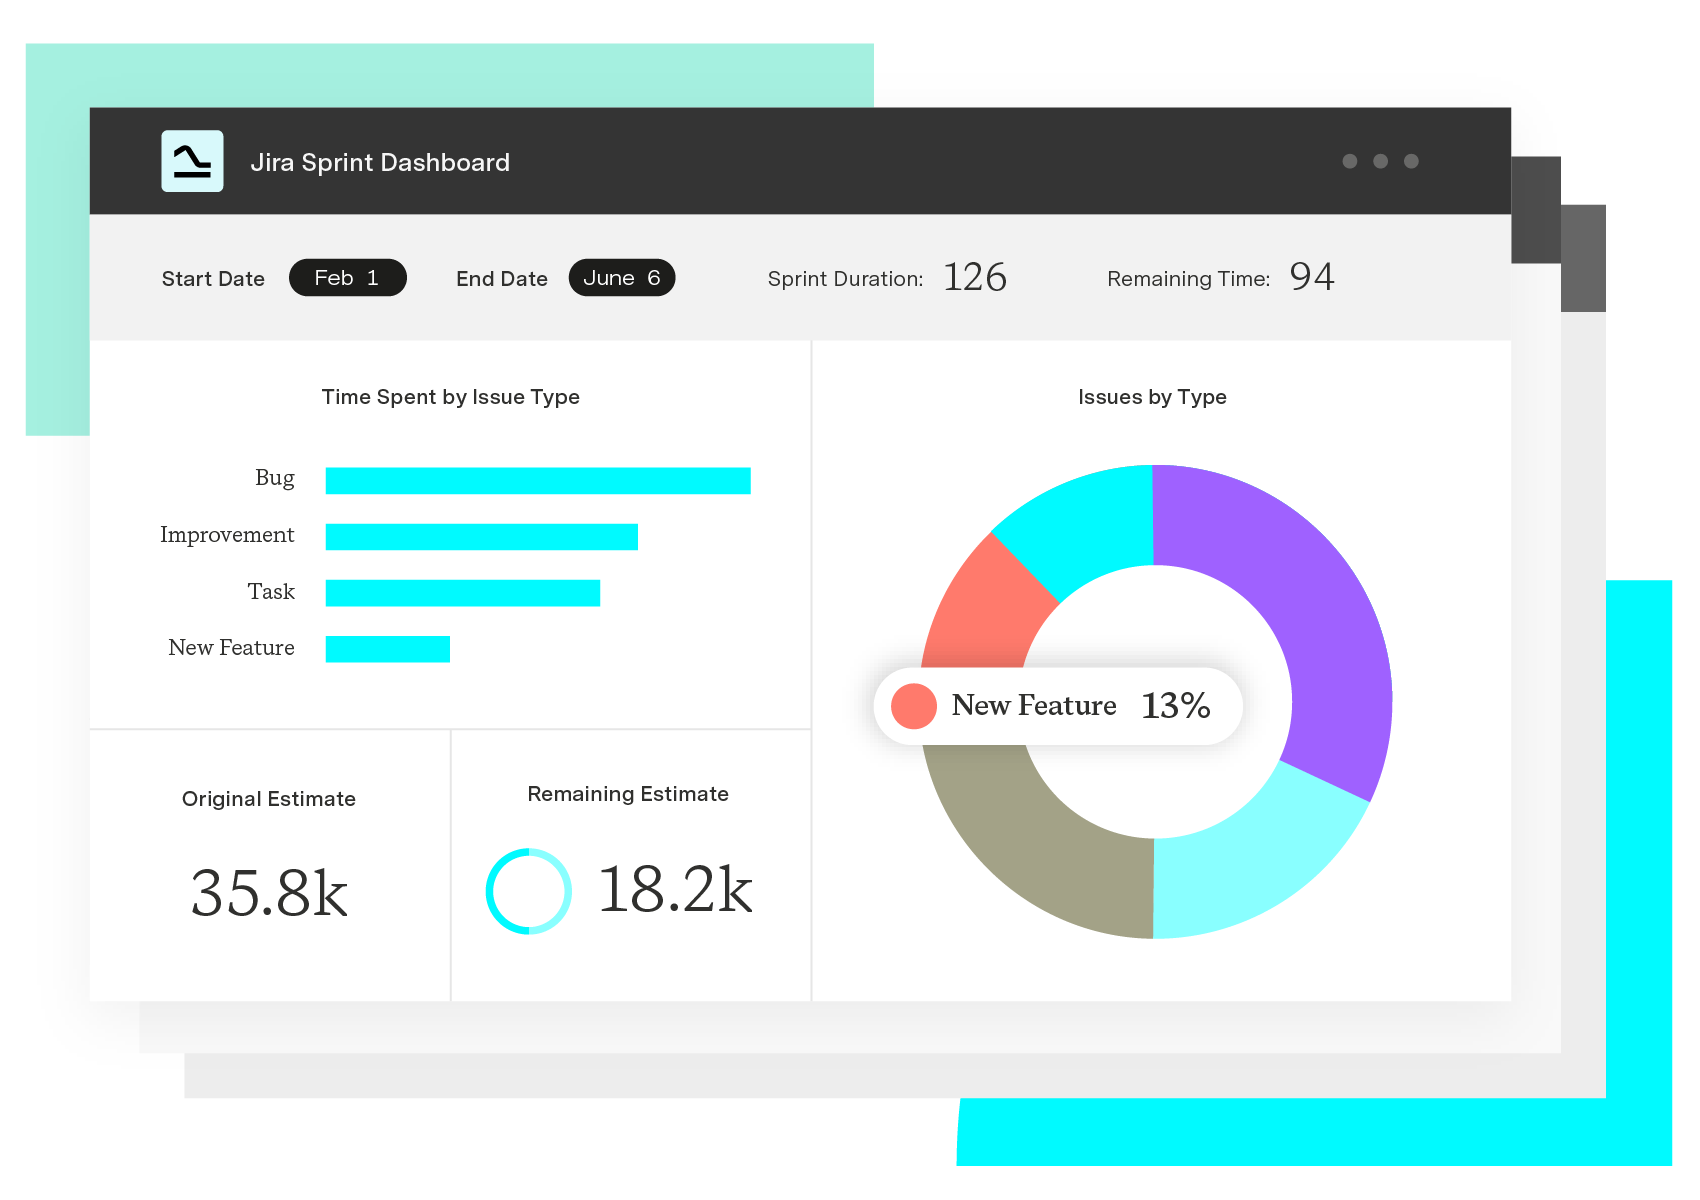
Custom Charts for Jira
Build charts and dashboards to evaluate delivery, capacity, and speed for all teams with Jira's most flexible custom reporting app
Start a Free TrialThis ultimate guide to Jira reporting explains how to create a Jira dashboard that tells your team what they want to know, the right way.

Confluence isn’t just for words. It’s for pictures too. Here’s a useful guide to the best apps for making and sharing Confluence diagrams and charts.

We look at Dashboard Hub's strengths and weaknesses and explain why Custom Charts for Jira is the superior dashboard reporting app.

Custom Charts dashboards are now more shareable to anyone – in JSM portal or internally like a wallboard.

We know some Jira users aren’t clear on the difference between Jira reports and Jira gadgets (or which are better). So let’s walk through it.

When you can't see your portfolio clearly, the consequences ripple through every level of the organization.

Now you can make detailed reports on the status and progress of your custom structures on a Jira dashboard.
So you know what an information radiator is, how it boosts Scrum team transparency and productivity, and how to create one in Jira.
You'll be glad to hear startups and small businesses with 10 or less users get a free Jira license for everyone!


















