How to build great portfolio management dashboards
Portfolio management has never been more complex. We're managing more projects, with more stakeholders, across more distributed teams. Yet many organizations still rely on static reports and slide decks to make critical investment decisions.
The result? Leaders make choices based on outdated information, teams work on misaligned priorities, and valuable opportunities slip through the cracks.
Great portfolio dashboards change this dynamic entirely. They transform how you see, understand, and act on your most important work.
Limitations of poor portfolio visibility
When you can't see your portfolio clearly, the consequences ripple through every level of the organization.

Strategic misalignment becomes the norm. Without real-time visibility into how projects connect to business objectives, teams spend weeks or months working toward goals that leadership has already shifted away from.
Resource conflicts create bottlenecks. People get committed to multiple high-priority projects, then we wonder why nothing gets delivered on time. Poor visibility means you can't balance demand against capacity.
Risks hide until they become crises. By the time problems surface in quarterly reviews, the window to course-correct effectively has already closed.
Decision-making slows to a crawl. Leaders wait for reports to be compiled and meetings to be scheduled while opportunities move to competitors who can act faster.
The hidden cost isn't just the projects that fail – it's the strategic opportunities you never pursue because there’s no way to confidently assess current portfolio health.
"Once you have determined how many projects you can support, and what mix of projects you need to support your strategy, similar projects must compete against other similar projects for budget and staff for the resources dedicated to that category of project." - Robert Cooper
Why traditional reporting approaches fall short
Most organizations built their portfolio reporting around tools and processes designed for simpler times. These approaches worked when projects were more predictable and teams were collocated.
Static reports reflect yesterday's reality. Monthly or quarterly reports capture a moment in time, but portfolio dynamics change weekly or even daily. Decisions based on stale data often make problems worse.
Slide decks hide more than they reveal. Presentations look polished, but they filter information through multiple layers of interpretation. Critical details get lost in translation.
Siloed tools fragment the complete picture. Financial data lives in one system, project status in another, and resource allocation in a third. No single stakeholder can see how all the pieces connect.
One-size-fits-all reports satisfy no one. Executives need strategic insights, PMOs need operational metrics, and teams need workflow data. Generic reports fail to serve any audience well.
These traditional approaches weren't designed for today's portfolio complexity. We need a fundamentally different approach.
Dashboards as strategic decision engines
The most successful organizations treat dashboards not as reporting tools, but as decision engines that drive better outcomes. A 2024 report by PwC Switzerland found that effective portfolio management can reduce project spend by 20-30% while improving stakeholder satisfaction and leadership commitment.
Real-time visibility enables proactive management. When you can see problems forming, you can address them before they derail entire initiatives. Early warning signals let you shift resources or adjust scope while you still have options.
Shared visibility creates organizational alignment. When everyone sees the same data, conversations shift from debating what's happening to deciding what to do about it. Alignment happens naturally when information is transparent.
Predictive insights support confident planning. Advanced dashboards show current status and help you understand where we're heading. Trend analysis and predictive models turn data into foresight.
Customized views serve specific decision needs. Executives see strategic alignment and financial performance. PMOs see resource utilization and delivery predictability. Teams see sprint progress and quality metrics.
The key insight is that dashboards should adapt to how you make decisions, not force you to change how you work.
Ready to turn your portfolio management dashboards into a strategic decision engine?
Download the guideWhat makes portfolio dashboards essential now
Several converging trends make portfolio dashboards more critical than ever.
Accelerating business change demands faster planning cycles. Organizations that once planned annually now adjust quarterly or monthly. Traditional reporting cycles can't keep pace with this velocity.
Distributed teams need shared visibility. When teams work across time zones and locations, you can't rely on hallway conversations to stay aligned. Dashboards become your shared source of truth.
Stakeholder expectations have evolved. Board members and executives expect Netflix-quality user experiences in their business tools. Clunky reports that require training to interpret no longer meet the standard.
Data volume has exploded beyond human processing capacity. We generate more project data in a week than we used to create in a quarter. Only intelligent dashboards can surface the signals within this noise.
Investment decisions carry higher stakes. In competitive markets, choosing the wrong portfolio mix means missing targets and losing market position to faster-moving competitors.
These forces aren't temporary disruptions. They represent the new normal for portfolio management.
The competitive advantage of portfolio clarity
Organizations with superior portfolio visibility consistently outperform those that operate with limited insights. More than 25% of professionals found that PPM solutions improve increase innovation, improve operational efficiency, boost employee productivity, drive up customer satisfaction, and shorten time to market for new products and services, according to a 2024 IDC report commissioned by SmartSheet.
They make faster, more confident decisions. When leaders can see portfolio health in real-time, they respond to opportunities and challenges while competitors are still gathering information.
They align resources to strategic priorities more effectively. Clear visibility into capacity and demand helps these organizations avoid resource conflicts that delay critical initiatives.
They identify and address risks before they become crises. Early warning systems built into their dashboards help them course-correct while options still exist.
They communicate portfolio status more effectively to stakeholders. Visual dashboards replace lengthy status meetings with focused discussions about decisions and actions.
They adapt their portfolios faster as market conditions change. Real-time insights enable agile portfolio management that keeps pace with business evolution.
The organizations that master portfolio dashboards create sustainable competitive advantages.
The anatomy of effective portfolio dashboards
Great portfolio dashboards share common characteristics that separate them from mere reporting tools.
They surface actionable insights, not just data. Raw metrics tell you what happened. Insights tell you what it means and what to do next.
They provide context for every metric. Numbers without context are meaningless. Good dashboards show targets, trends, and comparisons that help stakeholders interpret performance correctly.
They enable drill-down exploration. Executive summaries get attention, but stakeholders need the ability to explore details when something looks concerning. Progressive disclosure keeps interfaces clean while maintaining depth.
They update in real-time or near-real-time. Stale dashboards become decorations. Useful dashboards reflect current reality and help stakeholders make decisions with confidence.
They connect operational metrics to strategic outcomes. The best dashboards help users understand how daily work contributes to quarterly objectives and annual goals. This connection drives better prioritization decisions.
Building dashboards that drive decisions
Creating effective portfolio dashboards requires a structured approach that puts decision-making at the center.
Start with decisions, not data. Before choosing metrics or designing layouts, identify the specific decisions each stakeholder group needs to make. Work backward from decisions to determine required insights.
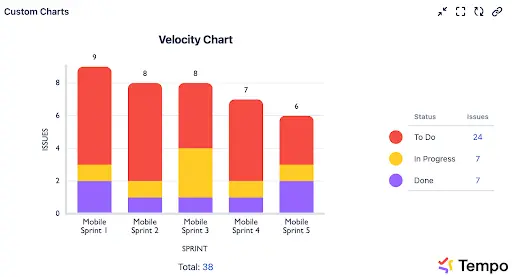
Choose leading indicators over lagging metrics. Delivery dates and budget variances tell you what already happened. Team velocity and risk trends help you predict what's coming next. Predictive metrics enable proactive management.
Design for your audience's mental models. Executives think in terms of strategic themes and financial returns. PMOs think about resource allocation and delivery confidence. Teams think about sprint goals and workflow efficiency.
Integrate data across systems. Portfolio insights require combining project data, financial information, and resource metrics. Dashboards that pull from multiple sources provide more complete pictures than single-system reports.
Build in feedback loops for continuous improvement. The best dashboards evolve based on user behavior and changing needs. Regular review sessions help identify what's working and what needs adjustment.
How Tempo's Portfolio Collection fits this vision
Tempo built the Portfolio Collection specifically to address the challenges outlined here.
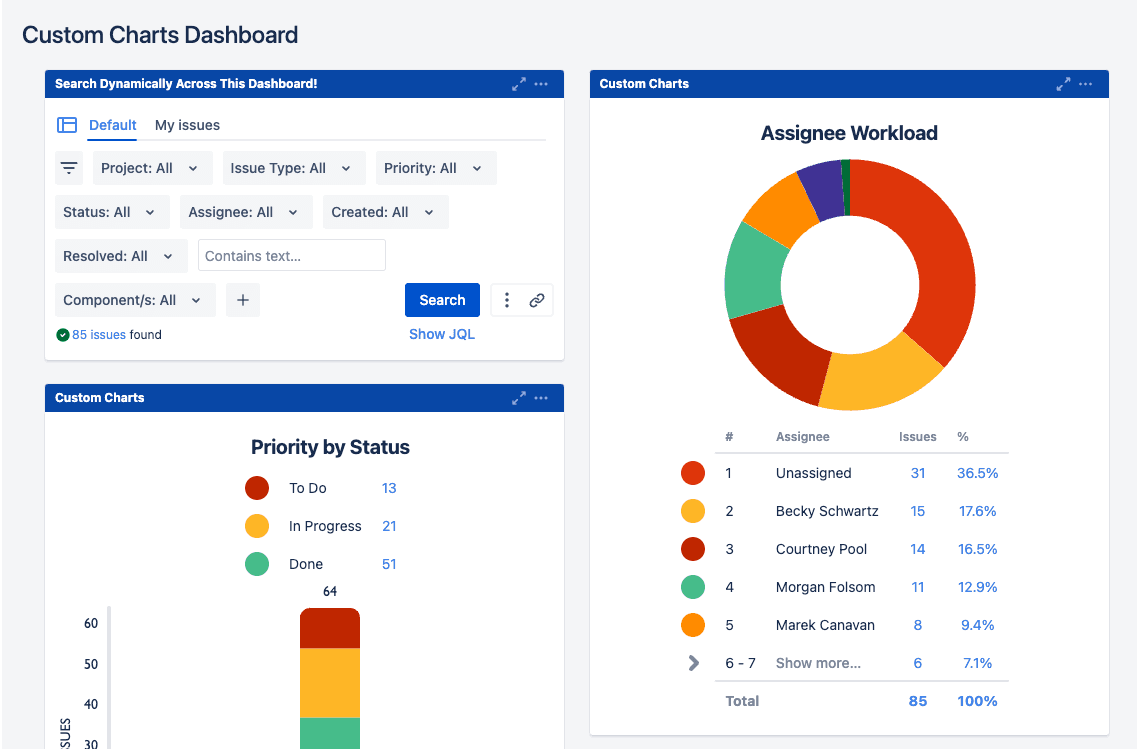
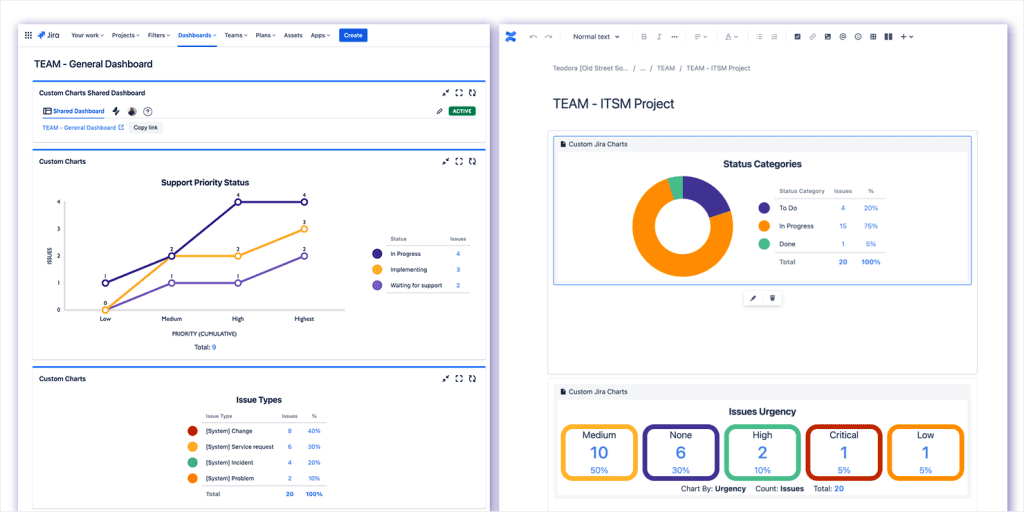
Custom Charts transforms Jira data into strategic insights. Instead of forcing you to export data and build charts elsewhere, Custom Charts lets you create comprehensive visualizations directly within Jira and Confluence – no technical expertise required.
Native Atlassian integration eliminates data silos. Our tools pull real-time information from the systems your teams already use, creating unified views without requiring data migration or system changes.
Flexible design supports audience-specific needs. Whether you need executive scorecards, PMO operational dashboards, or team performance metrics, our tools adapt to your requirements rather than forcing standardized approaches.
Enterprise-ready architecture scales with your portfolio. Our solutions handle everything from small team dashboards to enterprise-wide portfolio reporting, maintaining performance as your needs grow.
BI platform connectivity extends insights beyond Atlassian. Tempo BI Connectors let you incorporate Jira data into existing analytics platforms like Power BI and Tableau, extending the value of current tools.
“With Tempo’s Portfolio Collection, you get tailored insights built on real-time Jira data – with no-code, enterprise dashboards that are effortless for non-technical users to build.” - Nigel Budd, UK Agile Practice Lead at Eficode
Getting started with better portfolio dashboards
Building effective portfolio dashboards doesn't require starting from scratch or replacing existing systems.
Begin with your most critical decision points. Identify the portfolio decisions that have the highest impact on your organization's success. Focus initial dashboard development on supporting these choices.
Start small and expand gradually. Build dashboards for one stakeholder group or portfolio area first. Learn what works, then apply those insights to broader implementations.
Involve stakeholders in design decisions. The people who will use dashboards daily should influence their structure and content. Regular feedback ensures dashboards serve real needs rather than theoretical requirements.
Leverage existing data sources. Most organizations already capture the information needed for great dashboards. The challenge is usually connection and visualization, not data collection.
Plan for evolution and improvement. Treat dashboards as living systems that grow and improve over time. Build processes for regular review and enhancement into your implementation approach.
The path forward
Portfolio management dashboards aren't just nice-to-have reporting upgrades. They're essential infrastructure for modern portfolio governance.
The organizations that recognize this reality and act on it will pull ahead of competitors still relying on static reports and quarterly reviews. They'll make better decisions faster, align their resources more effectively, and adapt their portfolios as market conditions evolve.
The question isn't whether your organization needs better portfolio dashboards. The question is whether you'll build this capability before your competitors do.
Ready to transform your portfolio visibility? Explore how Tempo's Portfolio Collection can help you create the dashboards your organization needs to thrive.
Get real-time Jira insights for portfolio governance and confident decisions.
Try the Portfolio Collection