It's Atlassian vs Tempo! Time to compare the native reporting capabilities of Jira with our custom reporting app, Custom Charts for Jira.

We are excited to share that one of our most powerful gadgets is now available across all platforms, Cloud, Server, and Data Center: Issue List!
Issue List is a gadget and macro that comes with Custom Charts for Jira and Custom Jira Charts for Confluence. It allows users to generate a list of Jira issues on a Jira dashboard or Confluence page. It’s very similar to the out-of-the-box Filter Results gadget, but has some additional benefits, including:
The ability to dynamically filter Issue list using our Simple Search gadget or macro
Multiple options to choose from as the Source of Issue List, not just Saved Filters
In this video, you will learn how to effectively use Issue List with the Simple Search gadget.
Issue List is great for users who are looking to display a variety of information about their Jira issues all in one spot. Instead of leaving the dashboard and building the query using the Jira issue search, teams can see what’s most valuable to them in an easy-to-read list on their dashboard. This list sets alongside the rest of your reporting, saving everyone the time and effort of going to multiple places to view their data.
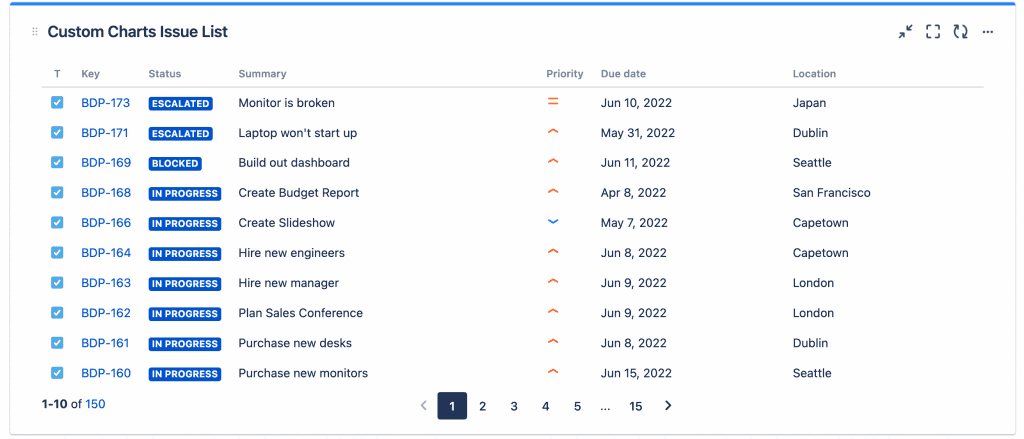
Ready to use the Issue List? Follow the steps below!
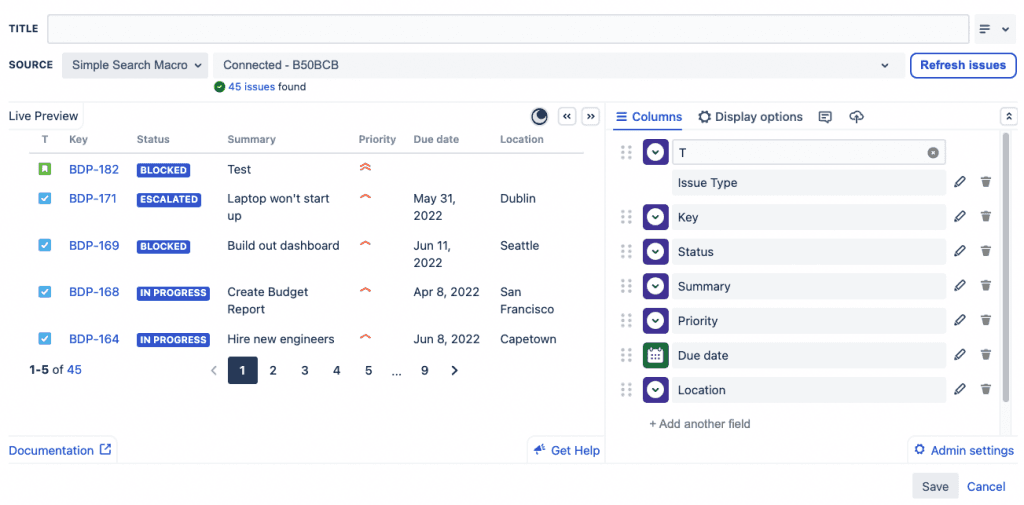
While editing your Jira dashboard or Confluence page, add the Custom Charts Issue List gadget or macro. Once you add it, the Issue List will automatically be in edit mode. Adjust the Source of the list and the Columns to display in the list.
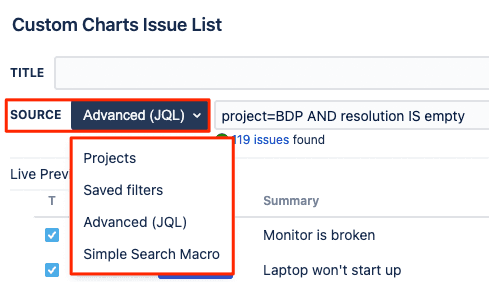
First, you’ll set the Source. Decide which Jira issues appear in the Issue List by selecting projects, existing Saved Filters, writing your own Jira Query Language (JQL), or connecting to Simple Search (just like Custom Charts!).
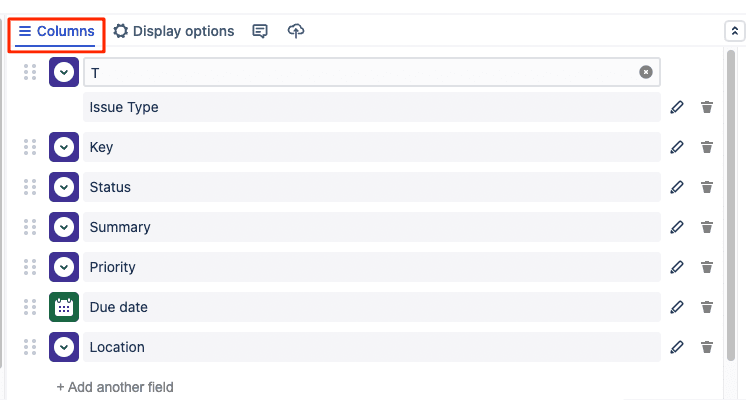
Next, you can decide on the Columns you want to display in the Issue List. Use the right side of the gadget to control the fields that appear for each Jira issue. Fields will appear as separate columns on the Issue List (just like in the Issue Navigator in Jira). A few fields are selected by default, but you can add, remove, and rename the fields by using the icons in this panel!
Custom Charts for Jira is the most powerful and effective for reporting when users add all of our gadgets and macros to a dashboard or page. See the example below of a Jira dashboard with the Simple Search, Issue List, and Custom Charts gadgets all together!
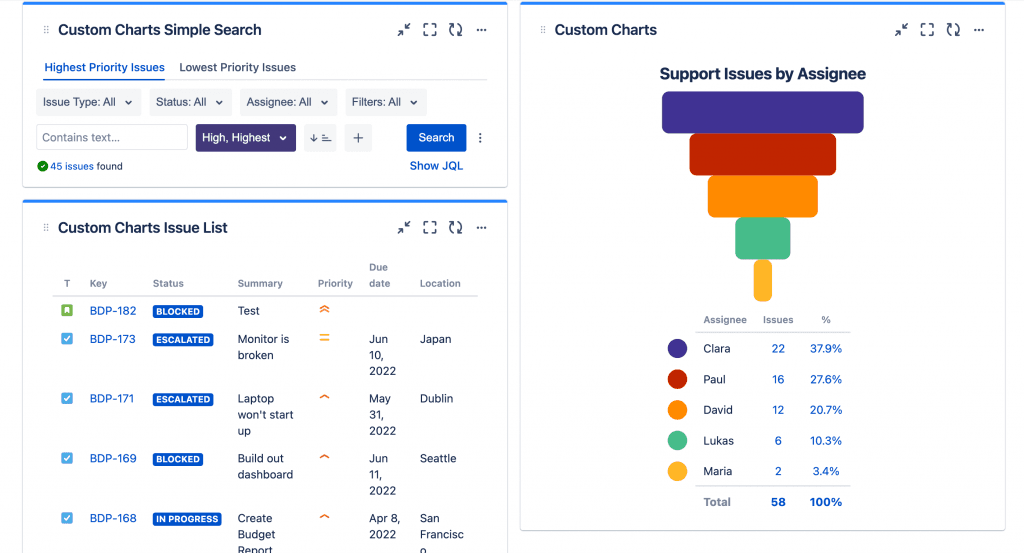
Click here to navigate to our documentation. We’ll be adding more and more features to the Issue List in the future.
Sign up for a demo
Request Demo
Custom Charts for Jira
Build charts and dashboards to evaluate delivery, capacity, and speed for all teams with Jira's most flexible custom reporting app
Start a Free TrialIt's Atlassian vs Tempo! Time to compare the native reporting capabilities of Jira with our custom reporting app, Custom Charts for Jira.

Search and filter Jira data without JQL. The Custom Charts simple search gadget lets any team member self-serve reports from a dashboard.

Seeking deeper insights from your Jira data? Compare Rich Filters for Jira Dashboard and Custom Charts for Jira to find the best product for you.

How to easily tailor your Custom Charts for Jira & Confluence to different audiences using the accompanying gadget/macro, Simple Search.

See how Custom Charts for Jira lets you build cross-project dashboards, story-point breakdowns, and control charts that native Jira reports can't.

Custom Charts dashboards are now more shareable to anyone – in JSM portal or internally like a wallboard.

Custom Charts templates make it easier to onboard new teams to Jira and get them up and running with ready-made charts and dashboards.
Our Custom Charts/Assets for Jira integration lets you report on asset data on JSM dashboards, boosting the effectiveness of your ITSM team.