Project tracking and portfolio governance aren't the same problem. We review eight tools for PMOs governing portfolios in Jira.

ServiceNow is one of the most powerful cloud-based IT tools for any industry that helps companies to automate their workflow and solve enterprise issues. So why not use it as a source for data analysis and further decision-making? What you need for this is to perform a Power BI ServiceNow integration.
In this article, we will provide general information about the ServiceNow and Power BI platforms, explain why it is so useful to connect these tools together and show how to implement the integration easily with the Power BI ServiceNow connector. Finally, we will provide a few examples of effective app use.


ServiceNow was launched in 2004 as a comprehensive tool for IT teams to help them deal with their main managerial tasks. But since then it has become one of the most powerful platforms allowing big software developers to solve a number of their everyday issues.
Today ServiceNow includes products and services that are focused on 5 major areas including IT, Security, Customer Service, HR Service Delivery, and Business Applications. They help organizations to streamline their operations, automate routine tasks, and improve general operational efficiency.
What is most useful with this tool is that it can be customized to the specific needs of the team. You can easily create a service model corresponding to your business needs and it will automatically manage daily operations and solve some more specific issues. It is a cloud-based platform which means all the team members can access it from any location.

Gone are the days when the data was collected and calculated by hand, moreover, comprehensive business intelligence tools came to replace the number of different tools that were used by analytics in complex to get necessary insights.
And these BI platforms have two main functions. First, they integrate all the data sources the company has. And, second, they allow studying and visualizing all the information in an easy and intuitive way.
Microsoft Power BI is one of the most known worldwide solutions of this type. Today, it is a self-service analytics platform of enterprise scale with hundreds of data visualizations and built-in AI capabilities. Power BI incorporates many useful integrations that allow businesses to customize their data processing in accordance with their needs. They include, for example, Excel integration and different data connectors. The platform also has very strict data security solutions in place to protect your data from leakages and unauthorized use.

Now, when we can understand how ServiceNow and Power BI help different sizes of businesses in their everyday routine separately, we may assume how these tools will improve the company’s effectiveness when used together. Below are a few benefits that are included, but not limited to, what you will receive after you connect ServiceNow to Power BI.
To make informed decisions, you may consider all the factors, processes, and details. That’s why it is crucial to use as much data as possible on the matter of interest. As long as ServiceNow contains loads of operational information and Power BI allows structuring it and processing in the most suitable way as well as combining it with useful insights from different sources into a single. ServiceNow integration with Power BI will not only streamline the data analyses but also help to decrease operational costs and optimize in-company processes.
As it was already mentioned, ServiceNow itself contains a lot of useful and insightful information as the platform is used by companies to solve almost all of their business issues. Different data sets exported from the tool may be further used for building various data models and reporting. And Microsoft Power BI is one of the best solutions for these tasks.
The best way to make sense of data is to visualize it. With charts and graphs, it is easier to present complex ServiceNow data in a way that anyone, the team member or customer, can get a clear idea of trends and, consequently, make data-driven decisions to improve business performance.
Power BI is a powerful tool with a big set of available visualization features, like area charts, bar and column charts, combo and doughnut charts, funnel and pie charts, maps and treemaps. Therefore, the integration of Power BI and ServiceNow opens unlimited possibilities for crucial data visualization.

The plugin not only tightly binds Power BI and ServiceNow but also contains a number of features that makes the data export easier and more effective.
They include the following:
Intuitive interface and functionality that does not require coding or other special skills.
Advanced filtering options to narrow the data for export and get only the most relevant information.
Built-in Power BI ServiceNow dashboard templates with pre-configured data sources that are easy to export to Power BI and customize them according to your requirements.
Smart architecture which allows exporting big data volumes without performance impact on your ServiceNow instance.
Ability to configure Incremental refresh to refresh only the new or updated data, rather than refreshing the entire dataset, saving you significant time and resources.
Confirmed app scalability and high performance.
Possibility to manage user roles for only authoritative data access and enhanced data security.
Data safety as Power BI Connector for ServiceNow does not collect, store or share any customer data. In the next sections, we will guide you on how to link ServiceNow to Power BI with a connector and utilize your valuable data productively.
[VIDEO]
The good news is that you do not need additional resources or a lot of time to establish a Power BI integration with ServiceNow. All you need is a plugin like our ServiceNow Power BI connector. It is a standalone app that does not have any pre-requisite requirements to function, just the system admin role to install.
You can find the Power BI Connector plugin on the official ServiceNow Store. It is not necessary to buy a product right away, first try it for free to make sure you need it.
Start Power BI Connector for ServiceNow FREE trial now!
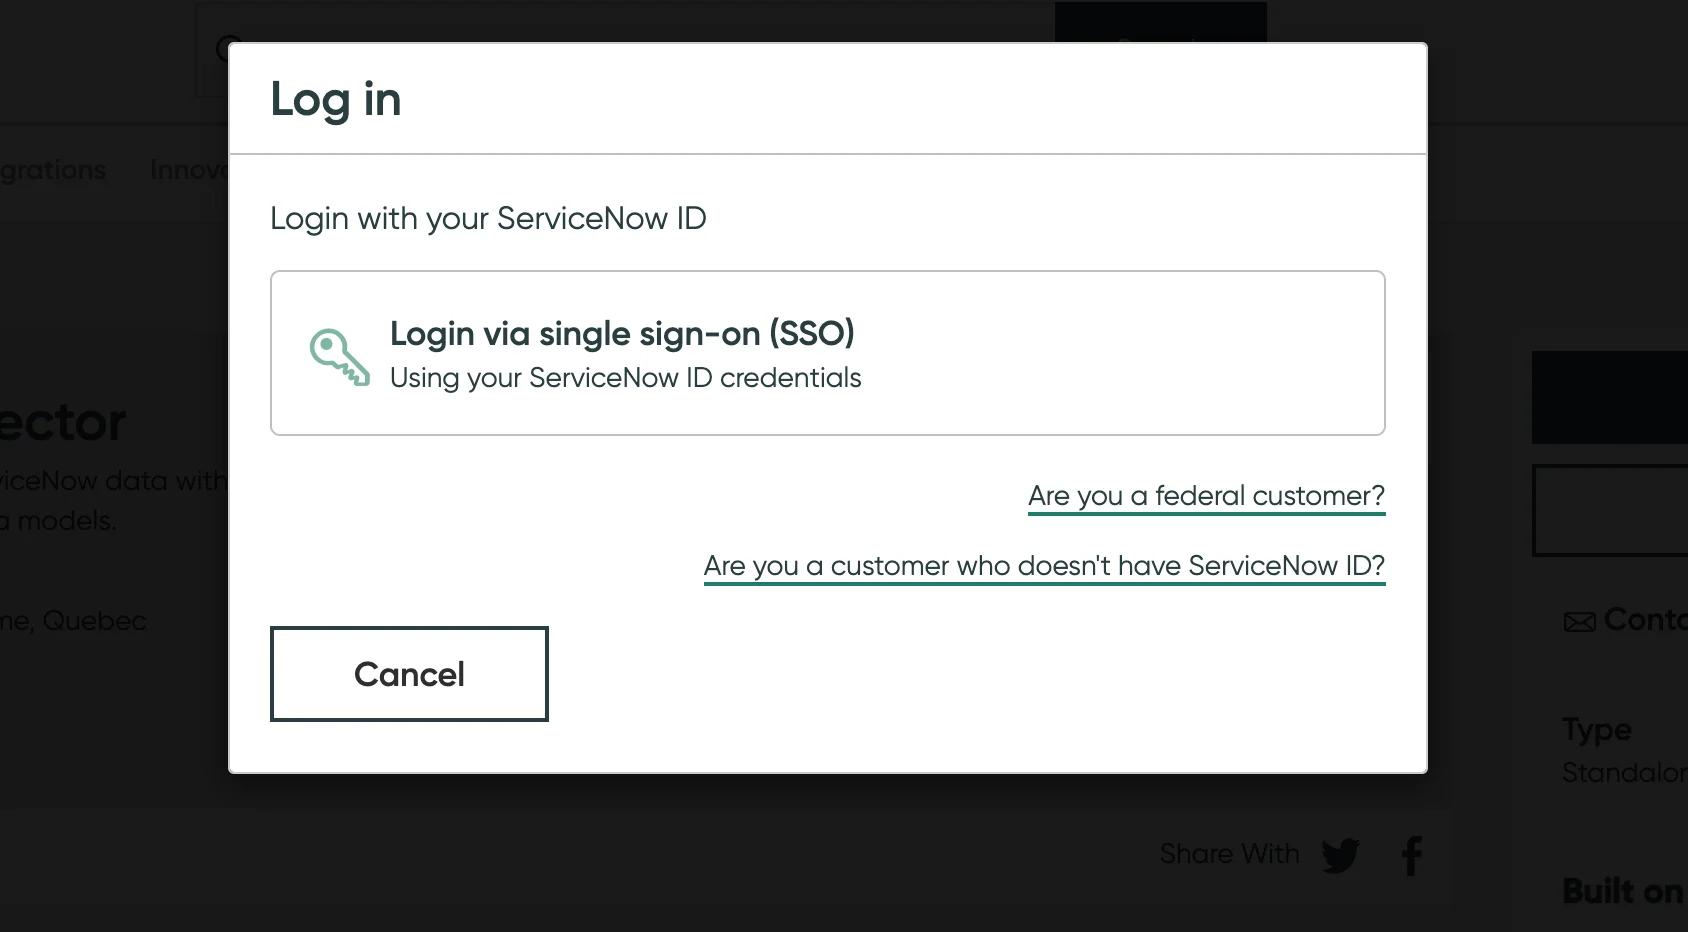
1. Click the Try button in the right upper corner and log in with your ServiceNow credentials. The trial is only available for installation on your sub-production instances. If you are not registered in the system, ask your ServiceNow admin to install the trial for you.
As it was already mentioned, ServiceNow itself contains a lot of useful and insightful information as the platform is used by companies to solve almost all of their business issues. Different data sets exported from the tool may be further used for building various data models and reporting. And Microsoft Power BI is one of the best solutions for these tasks.
You will be asked to accept the Terms of Use. After giving your consent, you can proceed by hitting the Try button. 2. Navigate to any of your ServiceNow sub-production instances and follow the path System Applications > All Available Applications > All.
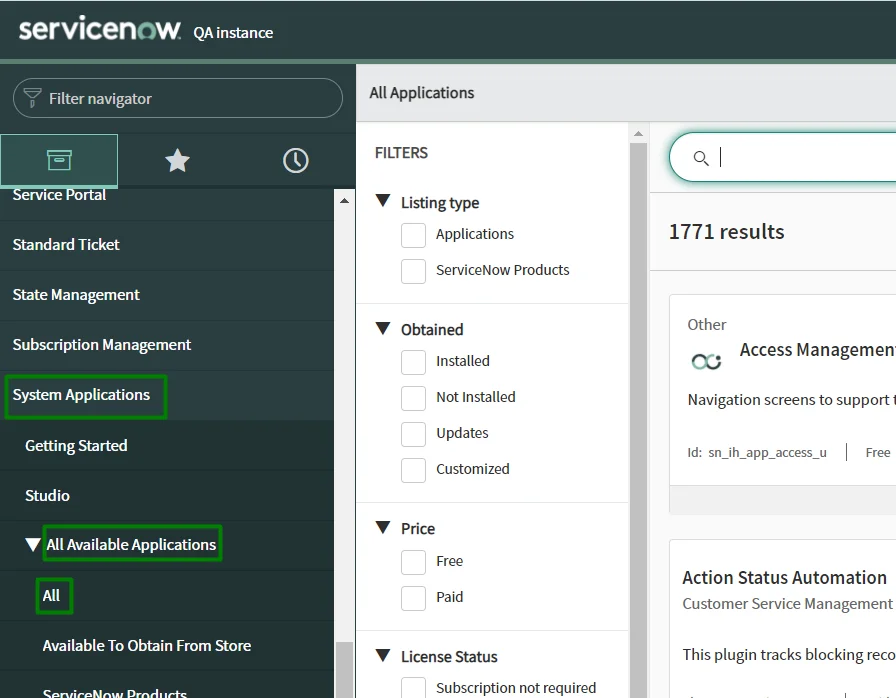
In the search bar, look for the Power BI Connector for ServiceNow application. You can also use the filter to find it.
3. Then click the Install button, and the automated installation will start immediately.
If you are happy with the product after the trial or are initially sure that the solution will satisfy all your business needs, you can buy the full version on the same ServiceNow Store. The installation process is almost the same except for the purchase option.
Buy Power BI Connector for ServiceNow and see it in action!
The best way to make sense of data is to visualize it. With charts and graphs, it is easier to present complex ServiceNow data in a way that anyone, the team member or customer, can get a clear idea of trends and, consequently, make data-driven decisions to improve business performance.
Power BI is a powerful tool with a big set of available visualization features, like area charts, bar and column charts, combo and doughnut charts, funnel and pie charts, maps and treemaps. Therefore, the integration of Power BI and ServiceNow opens unlimited possibilities for crucial data visualization.
After clicking the Buy button, you will see information about the total cost of the app and payment options. You can pay by Credit Card or Purchase Order. More detailed information about pricing and purchasing you can read here. After selecting the suitable option, just follow the instructions that appear on the screen.
ServiceNow System Administrators have the right to use Power BI Connector in full by default, but they can also assign roles to other users to grant them definite permissions while they work with the app.
Here is an instruction on how to assign Power BI roles to users.
1. On the Users table screen, find the persons you’d like to assign the Power BI Connector roles to and click on their User ID to open their profiles for editing.
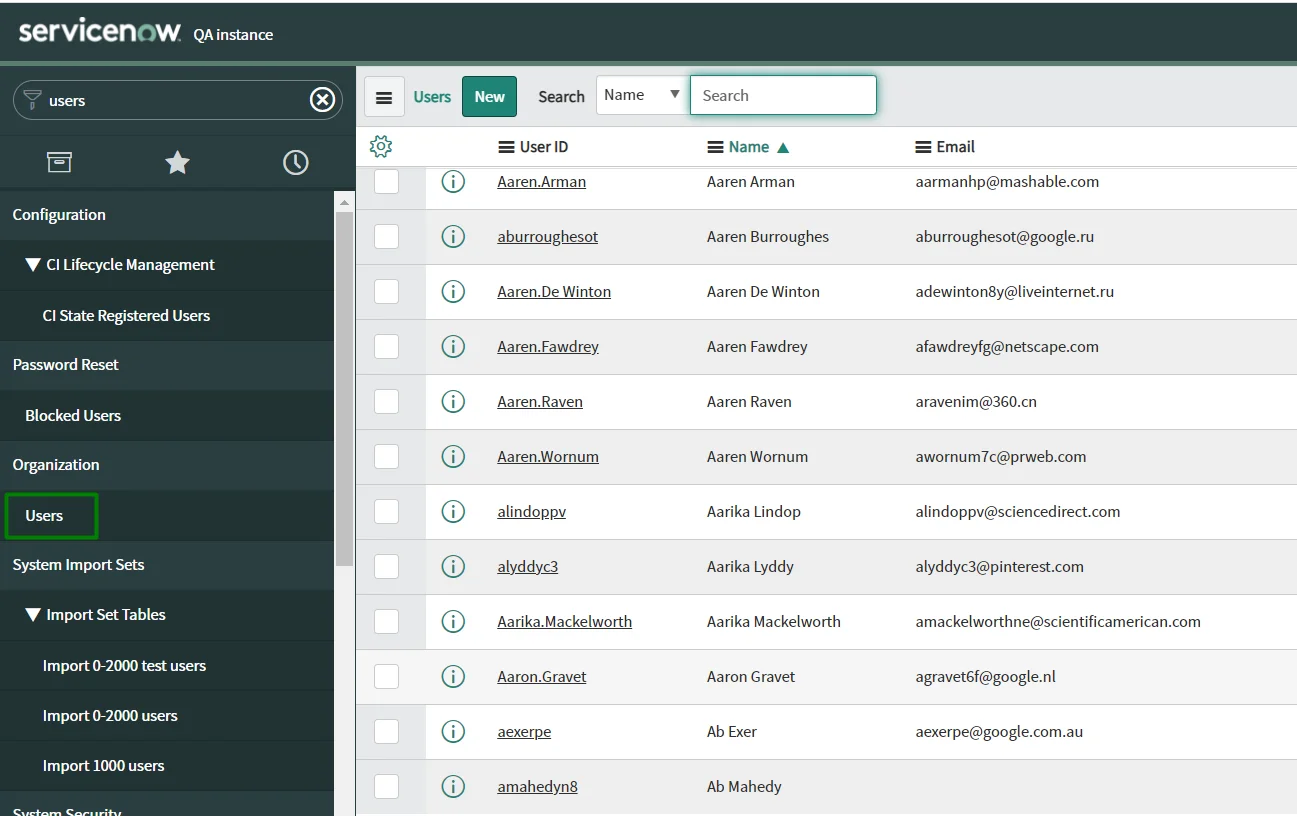
2. Find the Roles tab and switch to it. Then click the Edit button.
3. Enter 'x' in the Collection search field to find three roles offered for Power BI Connector users.
4. Assign appropriate roles to the users by placing them in the Roles list from the Collection. When done, click Save. Then click Update the user.
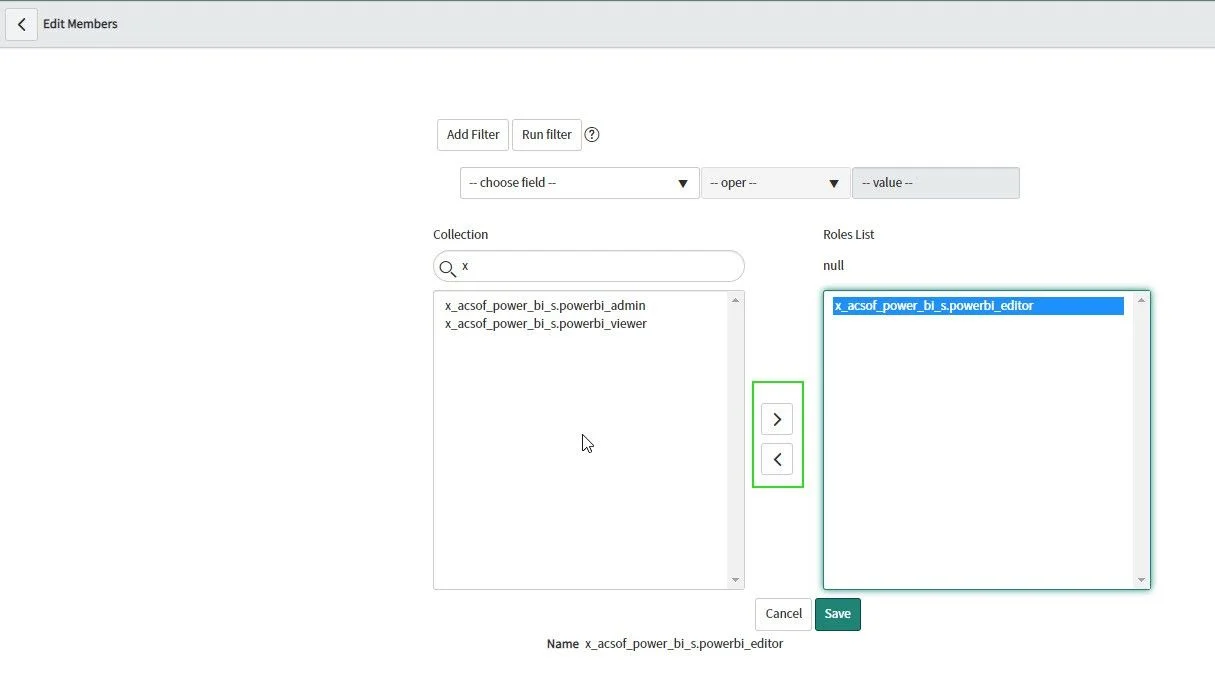
5. The roles assigned grant users the permission to Read, Write, Create or Delete Data sources at:
Platform UI Instance-Name.service-now.com/
Service Portal main page Instance-Name.service-now.com/sp
Power BI Connector page Instance-Name.service-now.com/pbi_connector
Here you can find more detailed information on assigning roles.
Only users who were granted a PBI ADMIN or a PBI EDITOR role can create data sources in ServiceNow.
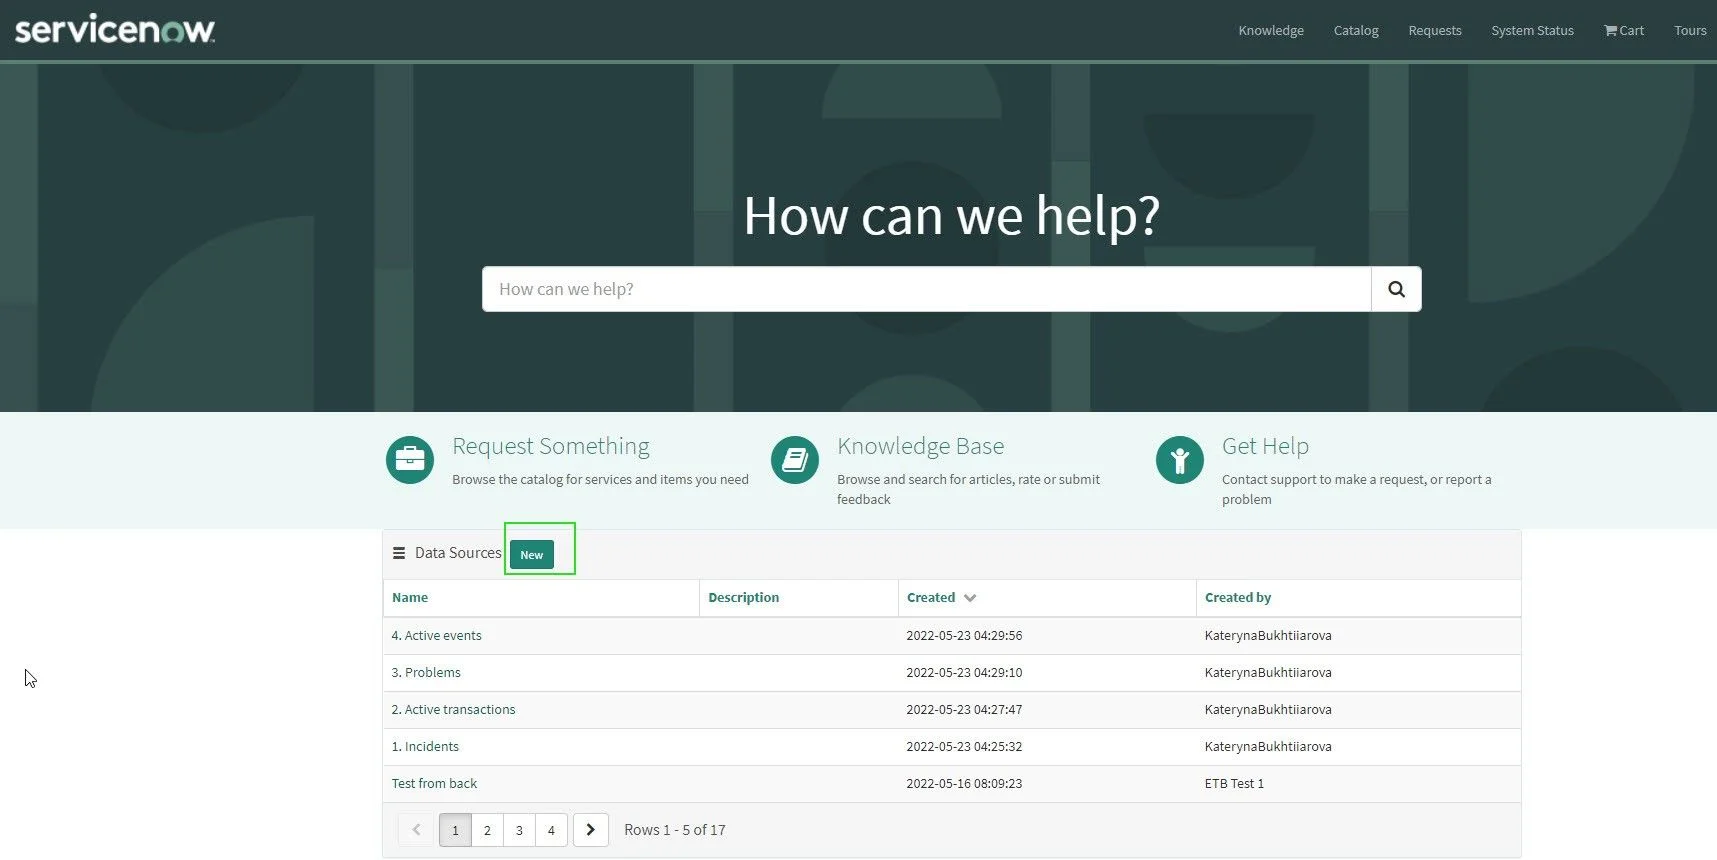
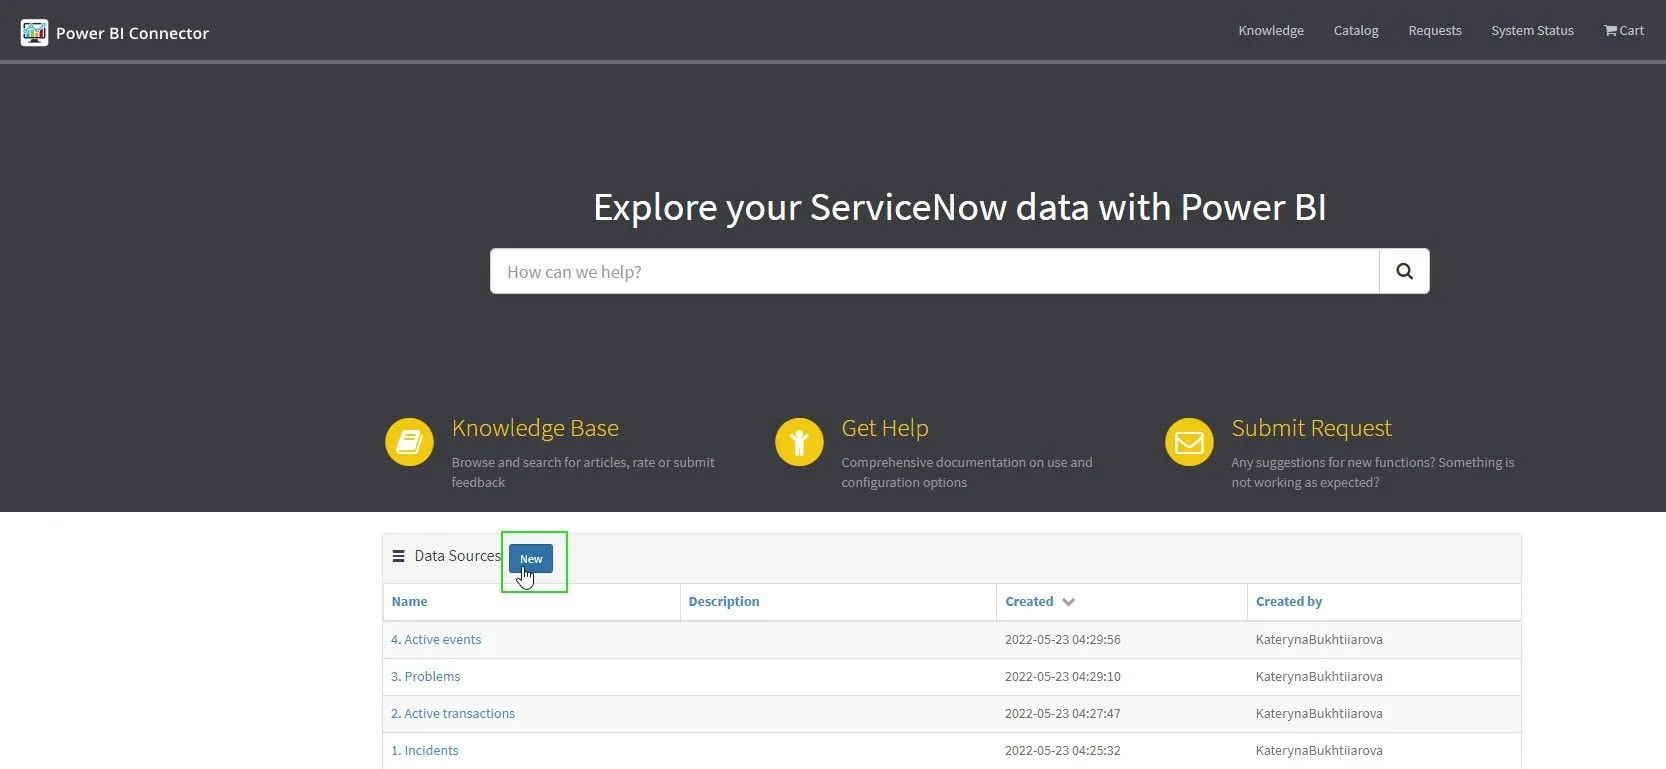
To start a new data source, one should either go to the Service Portal Instance-Name.service-now.com/sp: and scroll down to the Data Sources table or navigate to Power BI Connector pageInstance-Name.service-now.com/pbi_connector: and in both cases click the New button.
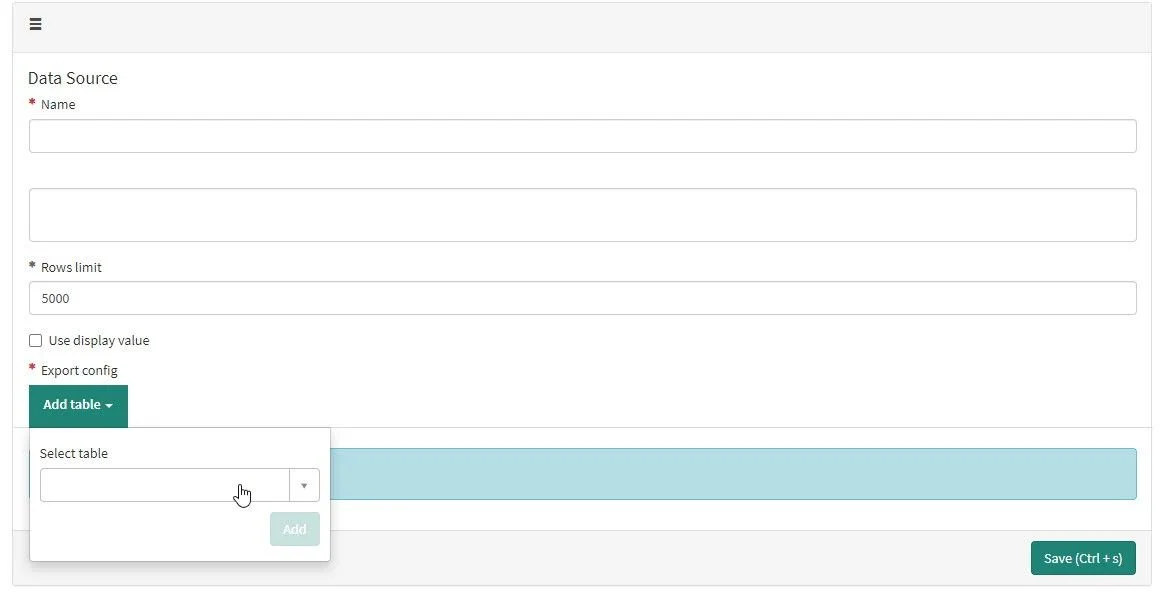
The screen will appear asking to fill in the details, including Data Source name, Description, Set Rows limit, and Add table (to configure data to be exported).
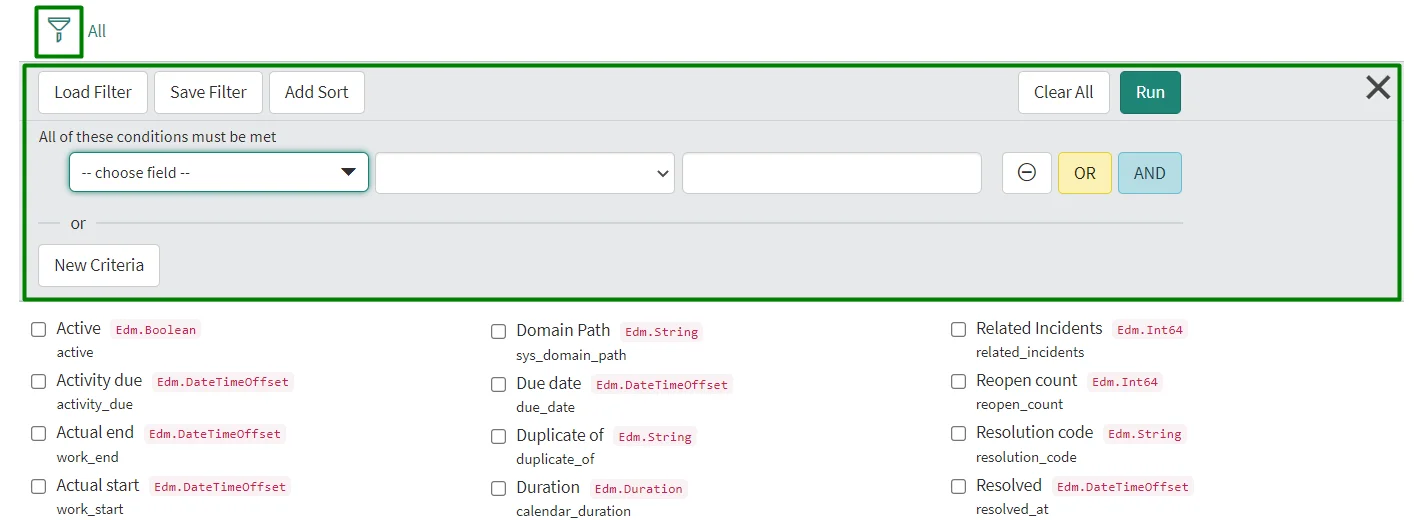
You can find the needed tables by using filters or a search box. You can also select fields to be included in your reports.
After entering all corresponding information, click Save.
You can find suitable data sources on the same pages as in Step 3.
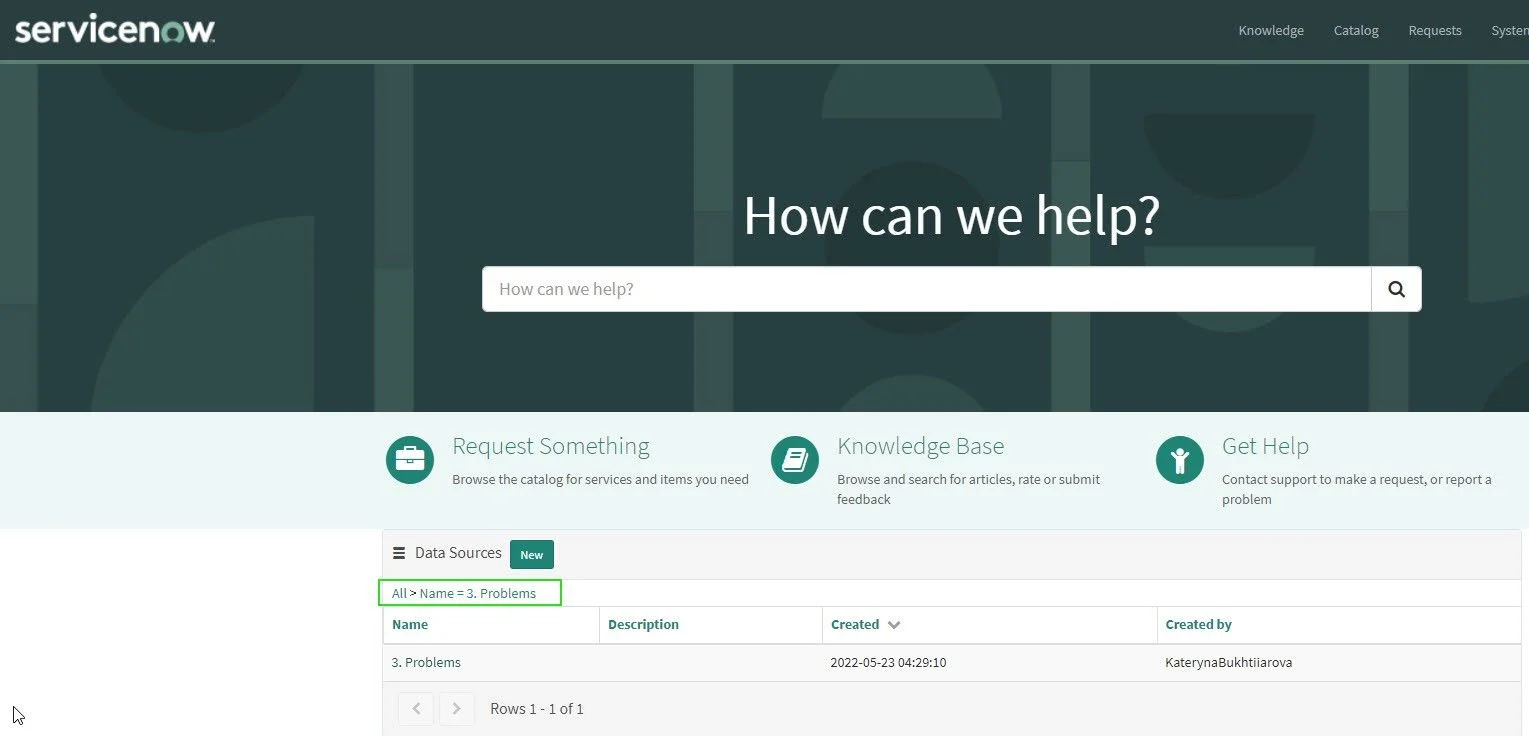
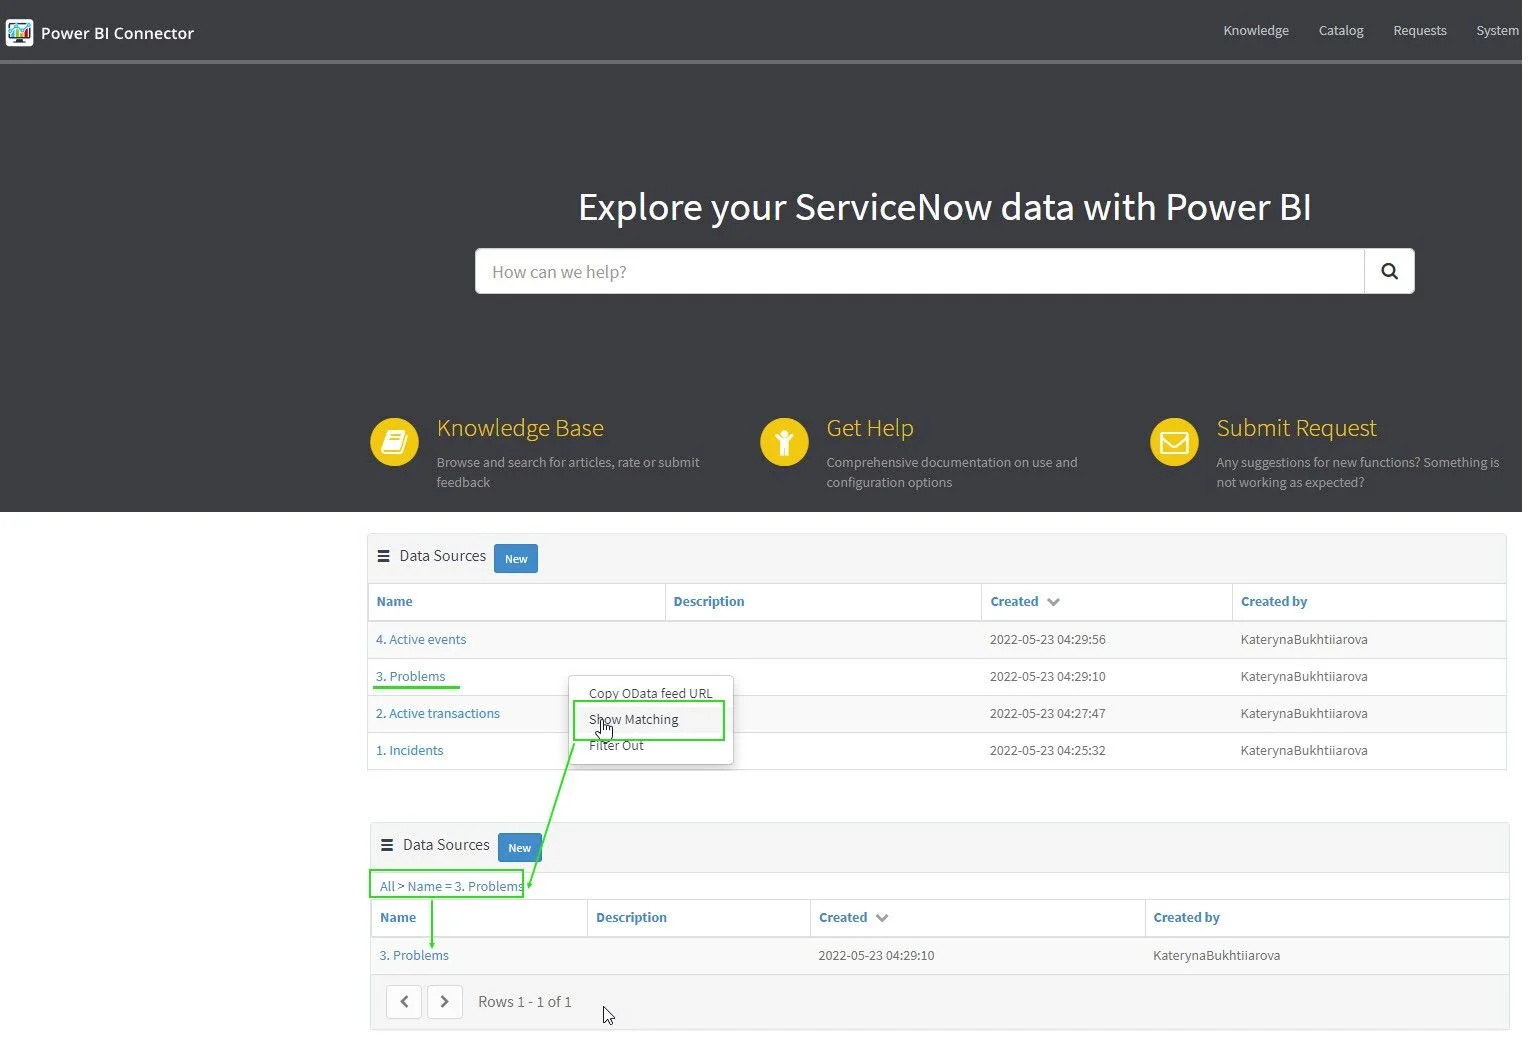
To open the menu, just click on the data source with the right button of your mouse and select Copy OData feed URL.
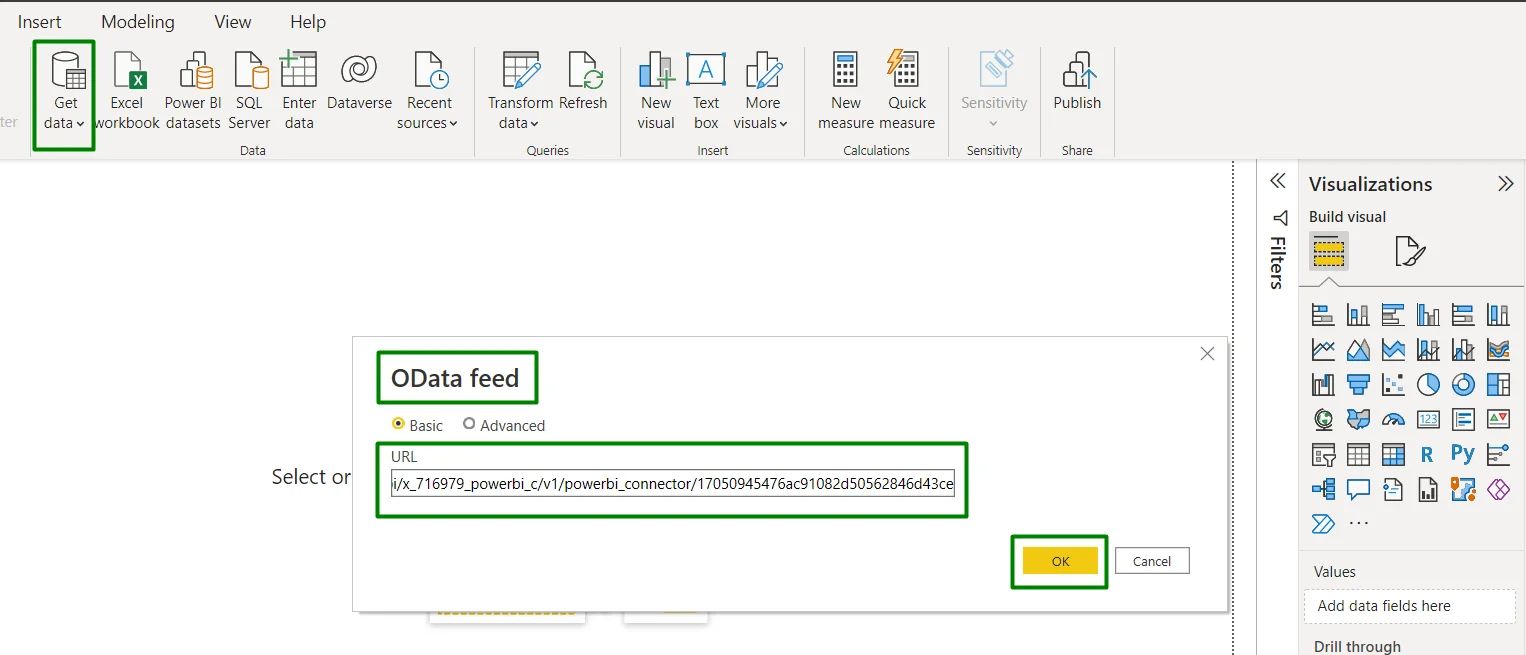
Proceed with the Power BI Desktop. Click Get Data and select OData feed. Insert copied URL in the corresponding field and hit the OK button.
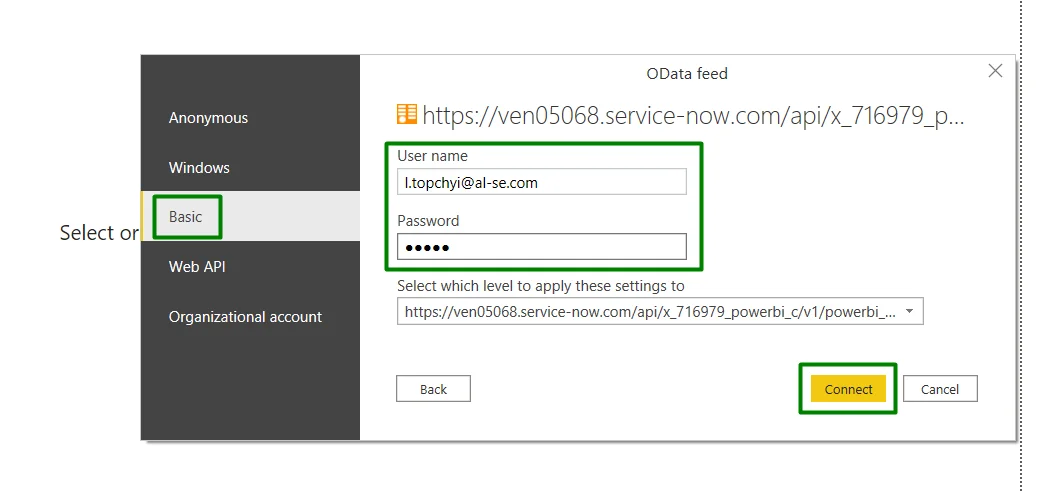
The new window will open where you should switch to Basic authentication and enter your ServiceNow credentials. Then click Connect.
Use Navigator preview to choose tables for export by checking corresponding checkboxes. Finally, click Load.
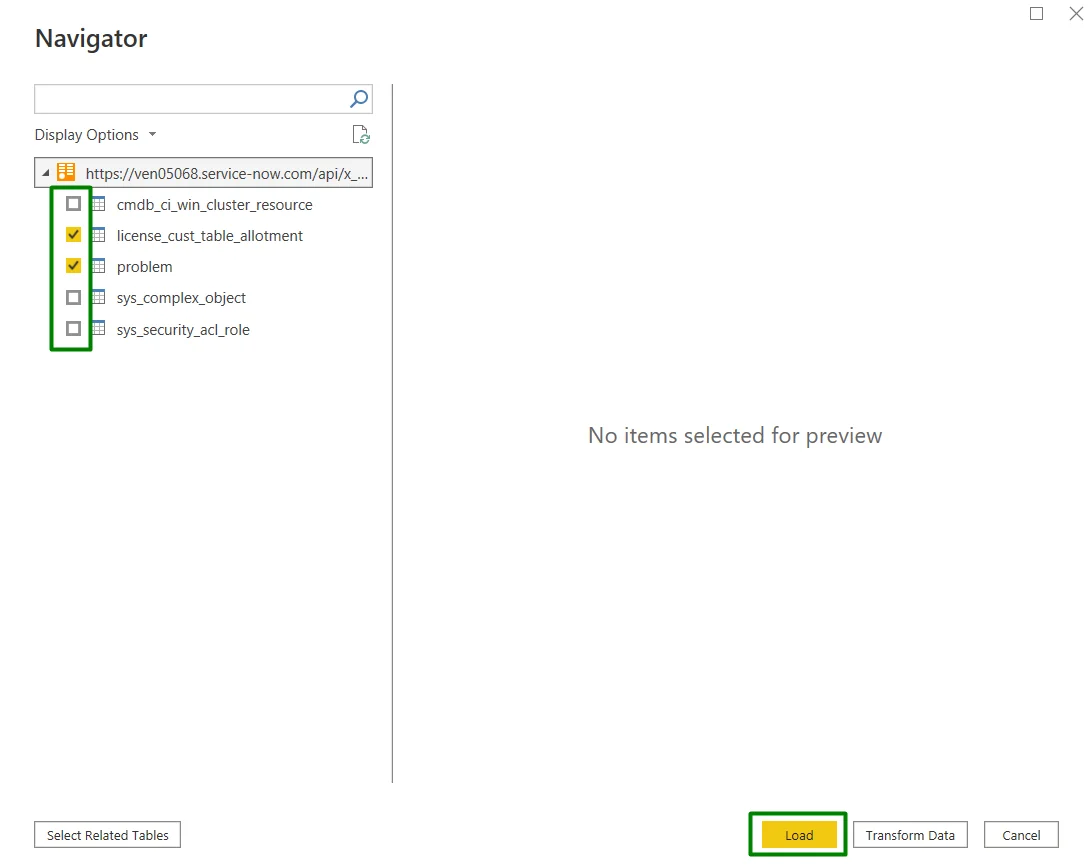
When the import is completed, the user will be able to build dashboards and further use the newly received ServiceNow data in Power BI.

Now let us show you some specific ways how businesses may benefit from the Power BI and ServiceNow integration.
As far as IT and other departments use ServiceNow to manage their workflow and supervise any other company operations, it is a good idea to use that data for measuring KPIs. As Power BI connector allows to continuously update the data, business owners and C-level management can easily track the company’s performance, get a clear understanding of what is going on in any department, and see all the positive changes as well as downward tendencies.
Whether you have a data analysis role inside your company or that function is carried out by the employee(s) having no coding skills, Power BI has the data processing solutions suitable for different scenarios and uses cases.
You can simply combine ServiceNow with other data sources like CRM, ERP, Jira, etc., and data analysts or anyone with this responsibility will be able to prepare integrated reports on a scheduled basis, build customized data models and perform thorough analysis across all business functions.
With this new possibility to prepare comprehensive reports and data models, managers will be able to quickly notice your business’s strengths and weaknesses, and further use this information to make better-informed decisions. The insightful information you will get with the Power BI connector will allow you to succeed and be more competitive in the market.
There is no necessity to name all the reasons why companies today need to be more tech-savvy. It is quite clear that even if you have a perfect team of professionals, sometimes, you need some special instruments to transform the workplace into a more productive environment. Newer and more enhanced technologies help you not only to save time and money but also to be competitive and succeed in your field of business.
Our new app — Power BI Connector — is one of those tools that can dramatically improve the effectiveness of the teams that use ServiceNow daily. By integrating Microsoft’s BI platform with this tool, you can easily export only the required data from ServiceNow to Power BI, combine it with other data sources, build comprehensive customized data analysis models, track productivity and use the received insights for strategic planning and business development.
What is more, the app is easy to use for people who have no special knowledge, it does not require additional resources to install and maintain. Power BI Connector allows exporting huge amounts of data without introducing excessive workload on the system and is safe to use, as it does not store any transmitted data.
Power BI Connector for ServiceNow
Connect ServiceNow to Microsoft Power BI for advanced insights and streamlined integration, enabling comprehensive data analysis and improved decision-making.
Start a Free TrialProject tracking and portfolio governance aren't the same problem. We review eight tools for PMOs governing portfolios in Jira.

Streamline your project management workload and get ahead on the planning process by adding these 5 top resource planning templates to your toolbox.

Get your discount for Tempo Collections – a curated bundles of award-winning apps designed to help you scale step by step on your SPM journey.

4 steps to organize this year’s goals | Planning intelligence & resource management software for smart projects.

Boost performance and time management with insightful productivity quotes that inspire action, and well-being. Discover how to use quotes for success.

Explore the four main communication styles, identify your own, and learn how to improve team collaboration – even when styles differ.

Rewind and Tempo talk about why you need to build a safety net in your systems before working with AI in Jira

Microsoft Project Online is retiring in 2026. Explore the transition timeline, risks of staying, and enterprise-grade migration options for PMOs.

What are operating expenses? How does tracking them improve a company’s bottom line? Here are the basics for understanding this type of expenditure.