Using Tempo Planner to streamline the management of teams and resources to find available team members and maximize your resource utilization.

Alpha Serve, in collaboration with our esteemed US subsidiary acSoft Inc, is pleased to announce the release of our latest feature - Power BI Dashboard Templates in Power BI Connector for ServiceNow. Pre-built Power BI Dashboard Templates for ServiceNow are now available in Power BI Connector for ServiceNow version 1.5.2.
With this release, the Alpha Serve team aims to empower our clients with all the necessary tools to make informed conclusions based on accurate and up-to-date data quickly and efficiently and drive improved performance.

The Power BI dashboard templates for ServiceNow, now accessible via our Power BI Connector for ServiceNow, represent a significant milestone in developing intuitive reporting solutions that cater to the growing demand for better reporting capabilities within ServiceNow. By concentrating on feedback-driven growth and development, our team managed to come up with Power BI templates that respond to the demands of our clients and offer users a time- and effort-saving reporting solution.
Power BI Dashboard Templates for ServiceNow simplify data visualization by providing downloadable files that users can import into Power BI to visualize their ServiceNow data effortlessly. The templates come with pre-configured data sources, tables, and fields, eliminating users needing to spend hours configuring the required report elements. It allows users to create ServiceNow reports in Power BI in just a few clicks, reducing the time it takes to produce reports and enabling users to focus on analyzing their data.
Power BI Dashboard Templates offer analytical instruments for acquiring facts about various IT service management processes such as incident management, problem management, problem requests, change management, and configuration item management. These dashboards offer a centralized view of the status of each process, providing metrics such as the number of incidents, their priority, urgency, impact, status, time taken to resolve them, and more.
Through the analysis of metrics over some time, teams can pinpoint areas that require improvement. It allows them to make decisions based on information concerning real-time statistics to optimize their IT service management processes and superior the quality of service provided to end-users.
Alpha Serve has responded to user suggestions and determined a trend toward customized reporting in ServiceNow by creating five Power BI Dashboard Templates. This decision was made following ServiceNow users' increasing demand for customized reporting options. The templates offered aim to address the essential aspects of IT service management within the framework of ServiceNow. The goal is to provide a consolidated perspective of performance indicators and patterns.
Let's take a closer look at the 5 Power BI dashboard templates for ServiceNow:
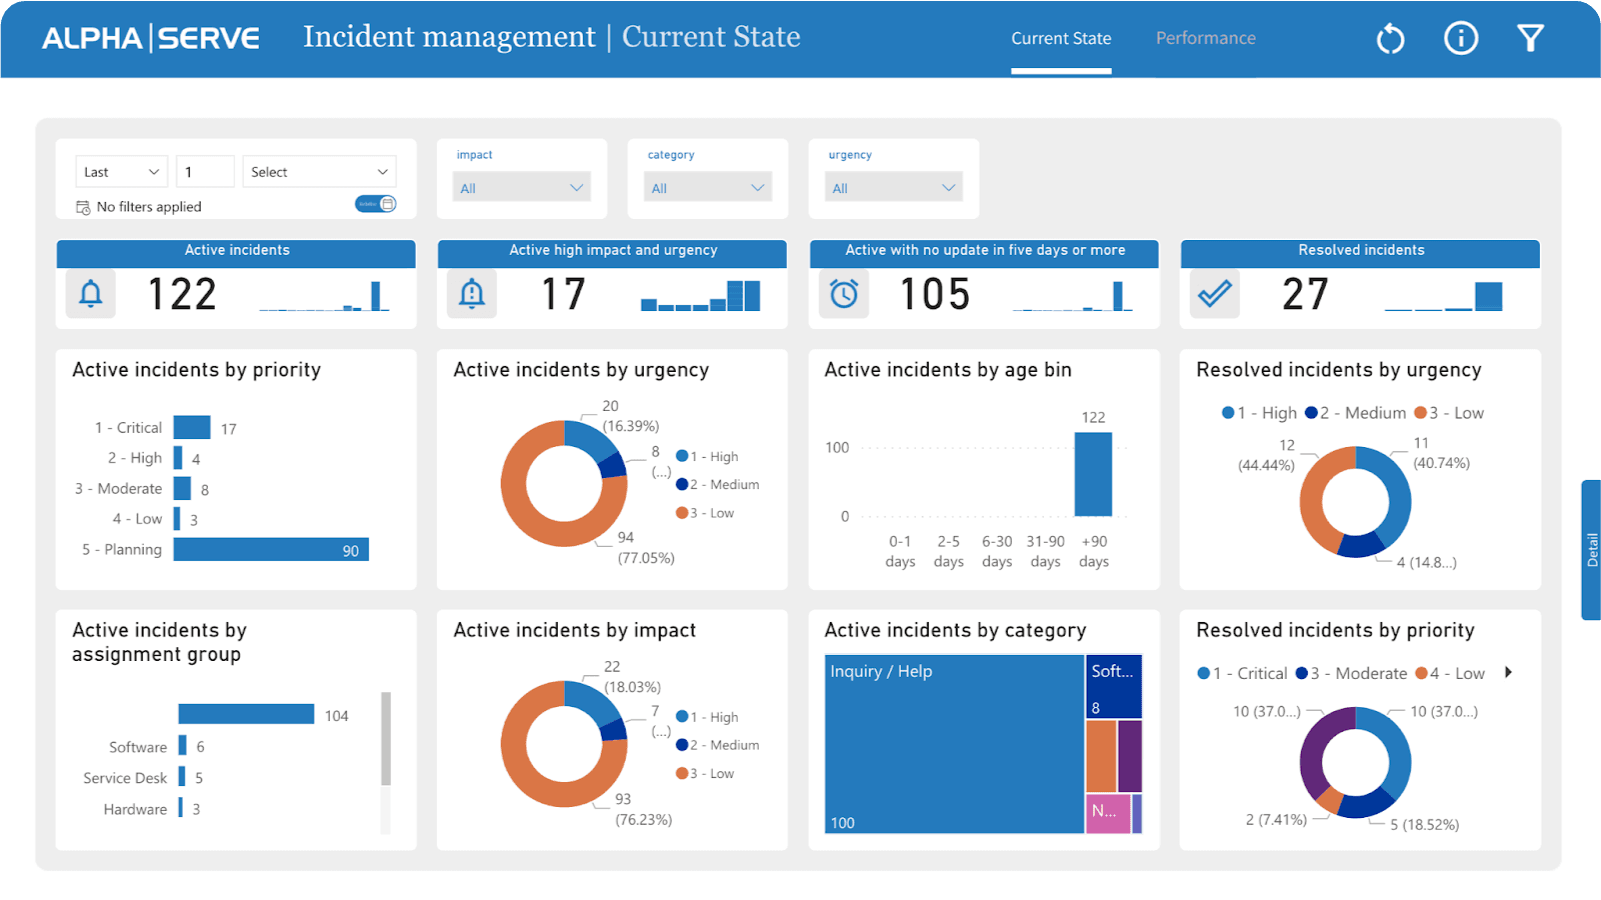
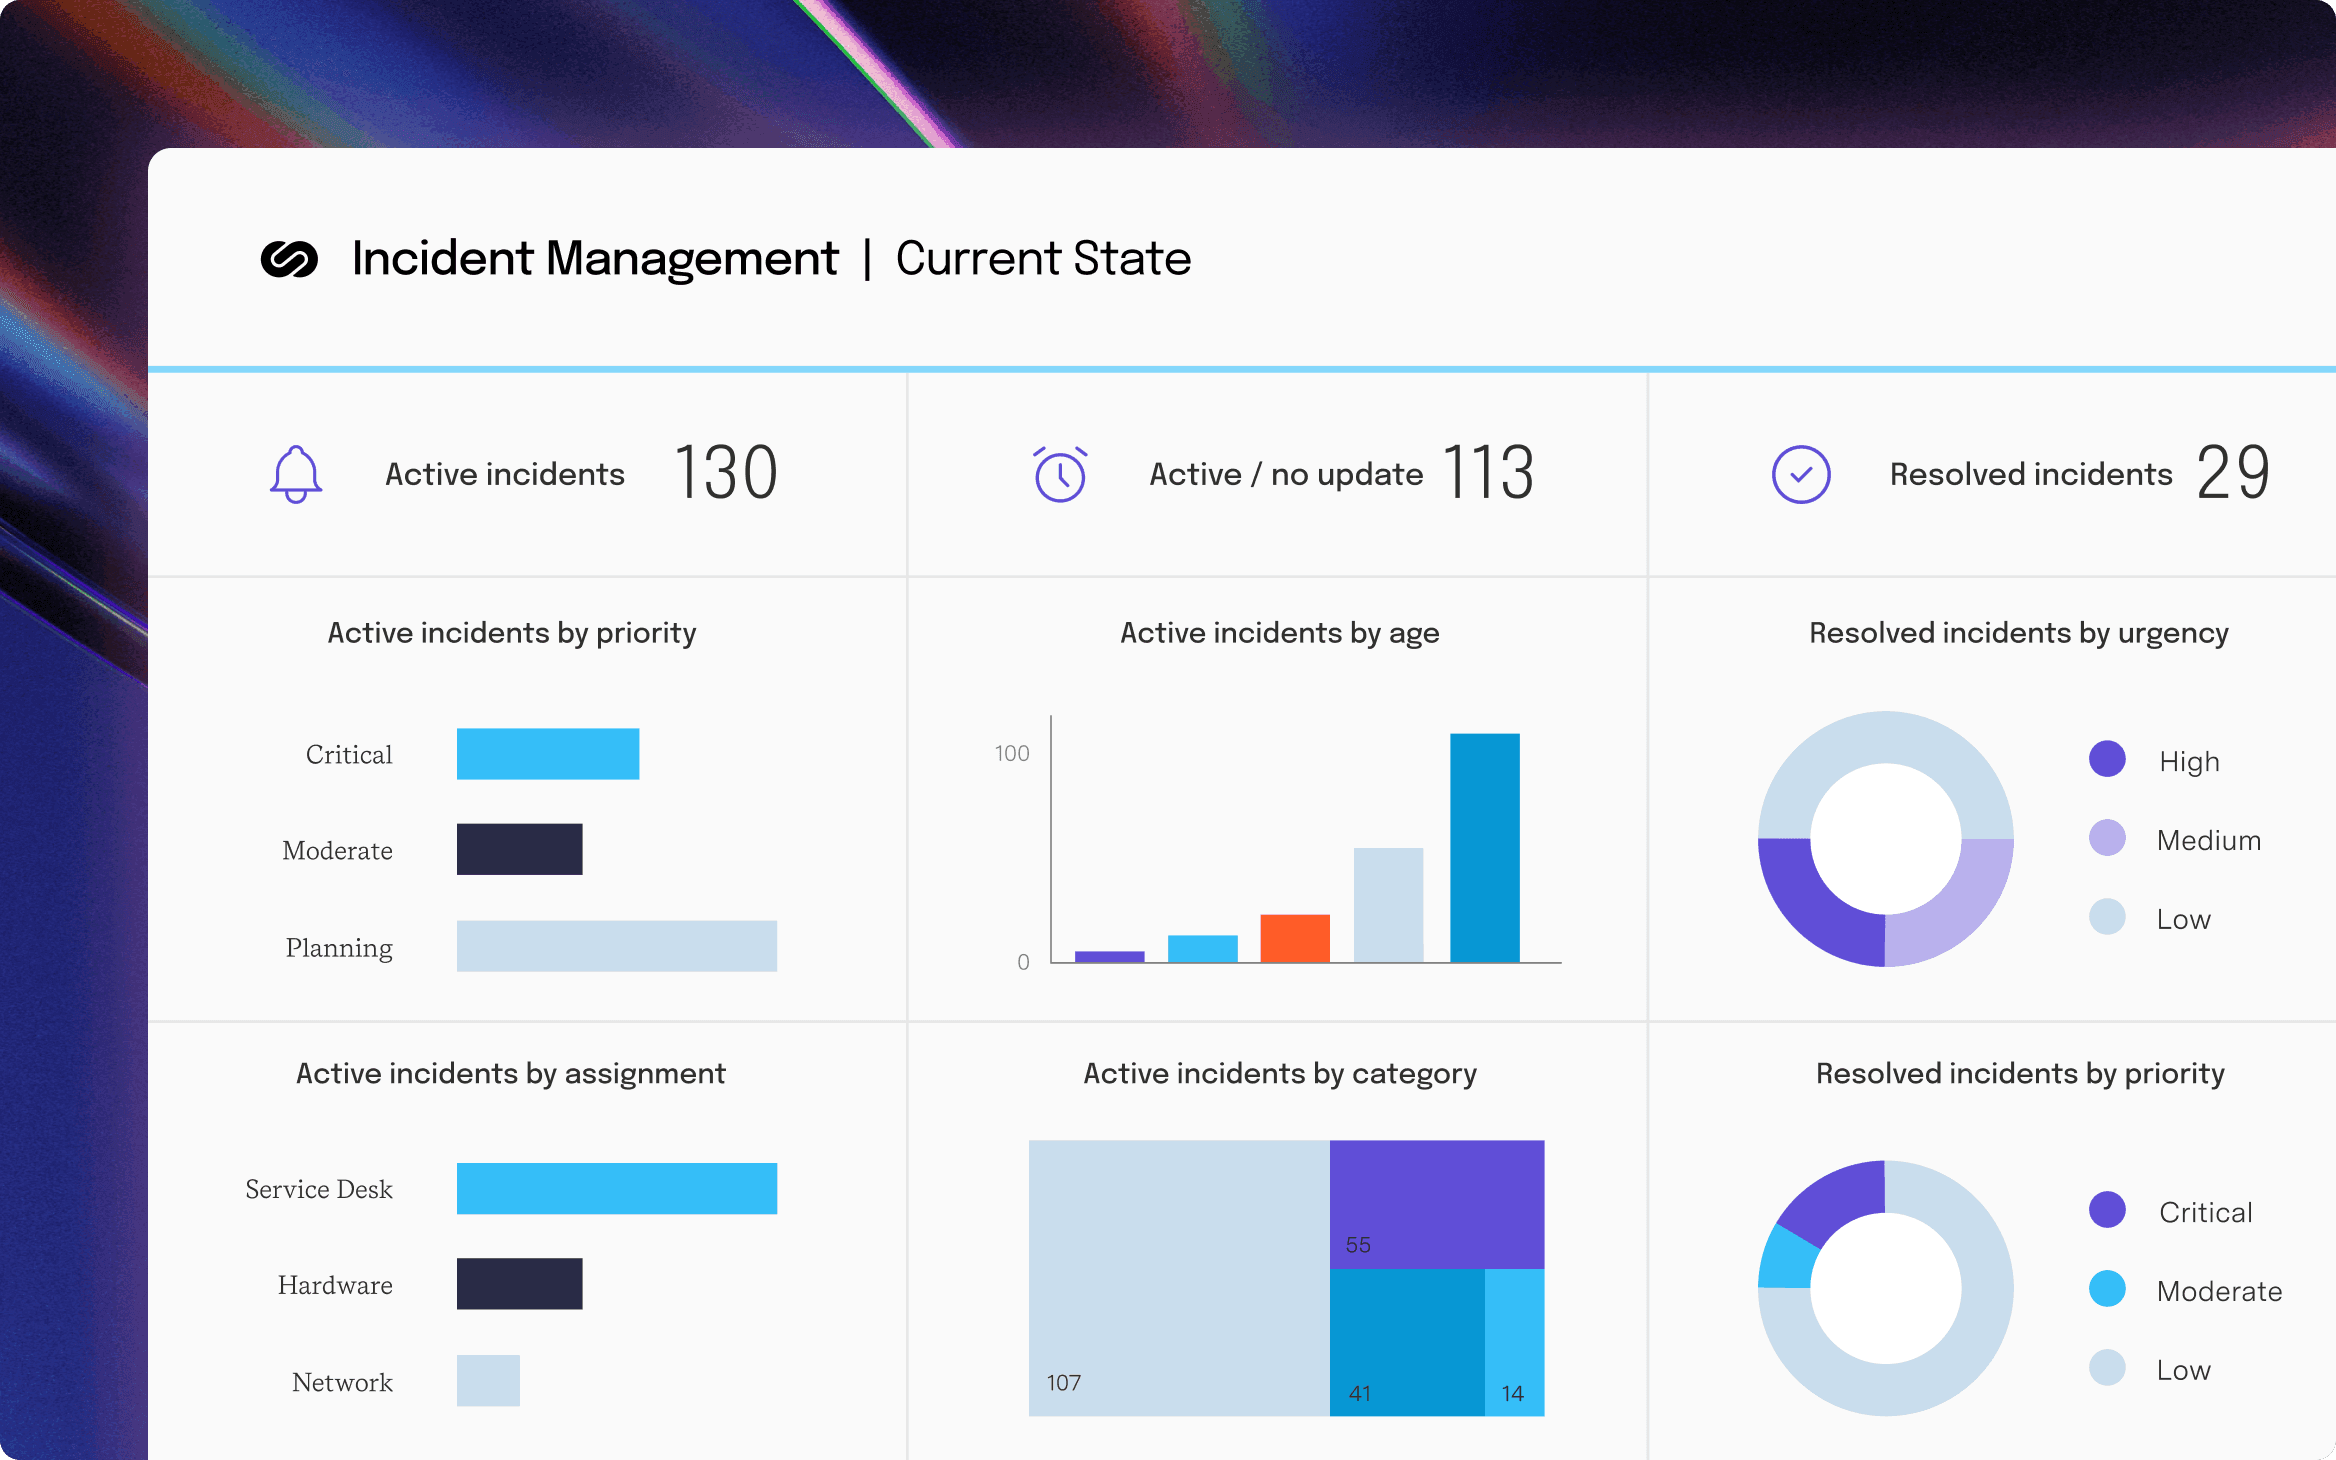
The ServiceNow Incident Management Dashboard shows all incidents, their priority, urgency, status, and resolution time, allowing IT staff to spot trends and bottlenecks to enhance the process. The dashboard has tabs for Current State and Performance reporting. It displays graphs and tables that show incident patterns, including the number of events raised each day by priority or urgency and the average resolution time.
Incident Management Dashboard also helps teams discover improvement areas and take steps like educating IT personnel, introducing new incident management tools and technologies, or changing incident management protocols.
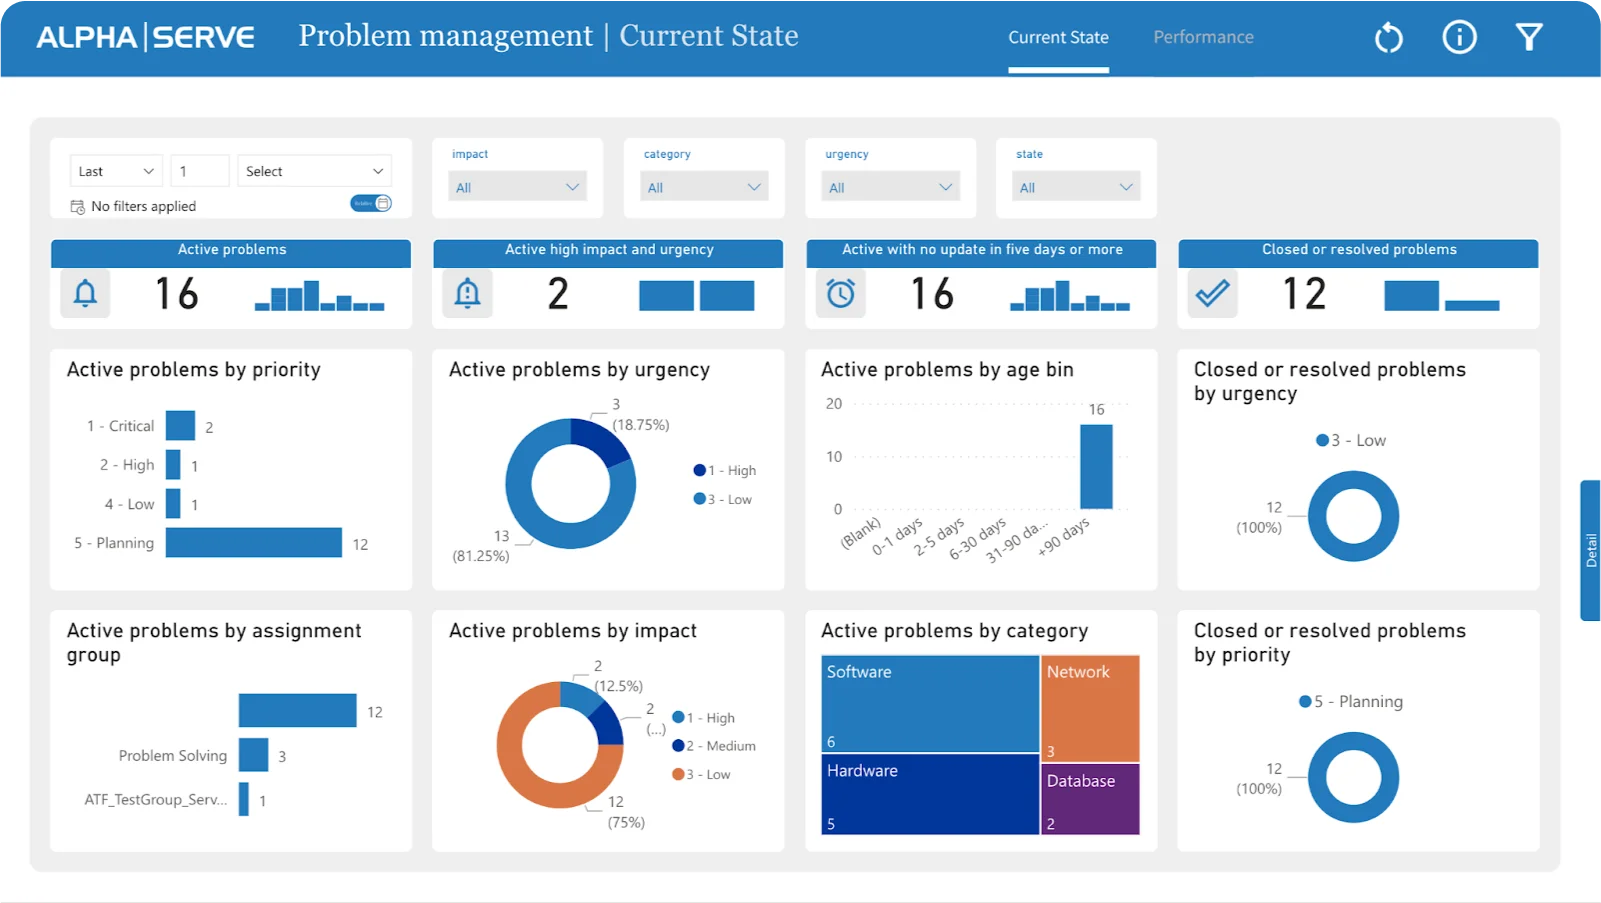
ServiceNow Problem Management Dashboards show problem statuses over time. This dashboard lets IT teams watch real-time problem resolution progress and analyze their management process using trend analysis elements, including graphs and charts that track daily detected problems and average resolution time. It organizes issues by priority, impact, urgency, status, and resolution time.
IT teams can monitor these KPIs to assess their problem-management process, find areas for improvement, streamline workflows, and prioritize tasks for better problem-solving.
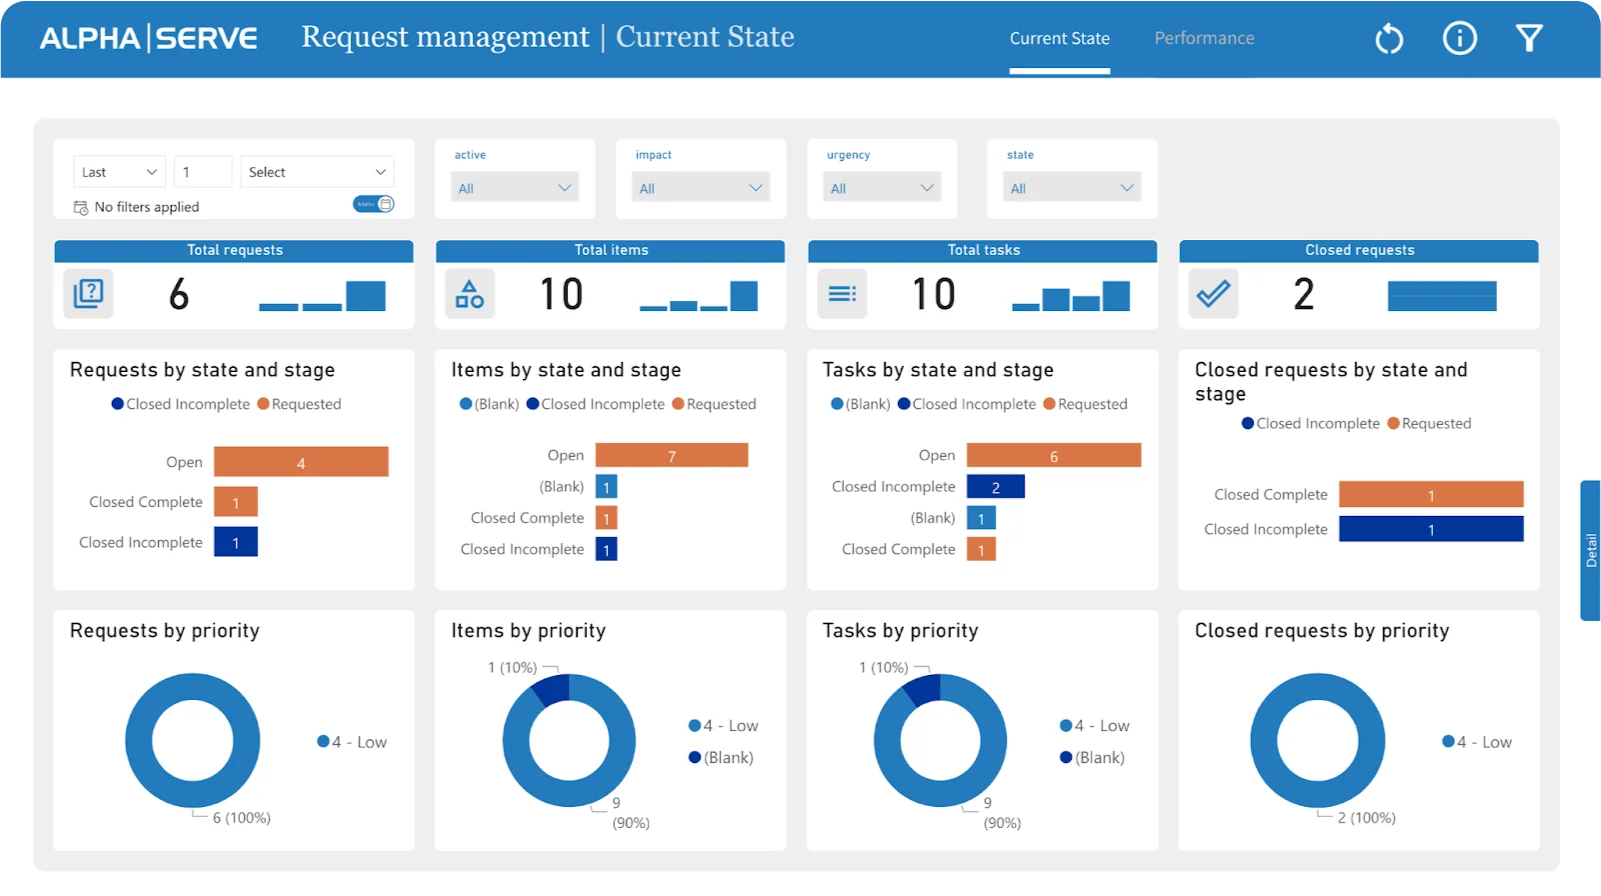
ServiceNow request management reports evaluate end-user service request fulfillment. These reports offer KPIs and metrics to measure process performance. Current state reports include request metrics, linked items, and tasks. It can be viewed by priority, state, and stage to assess request handling and find improvement areas.
ServiceNow request management reports help firms improve customer service, request management, and operational efficiency.
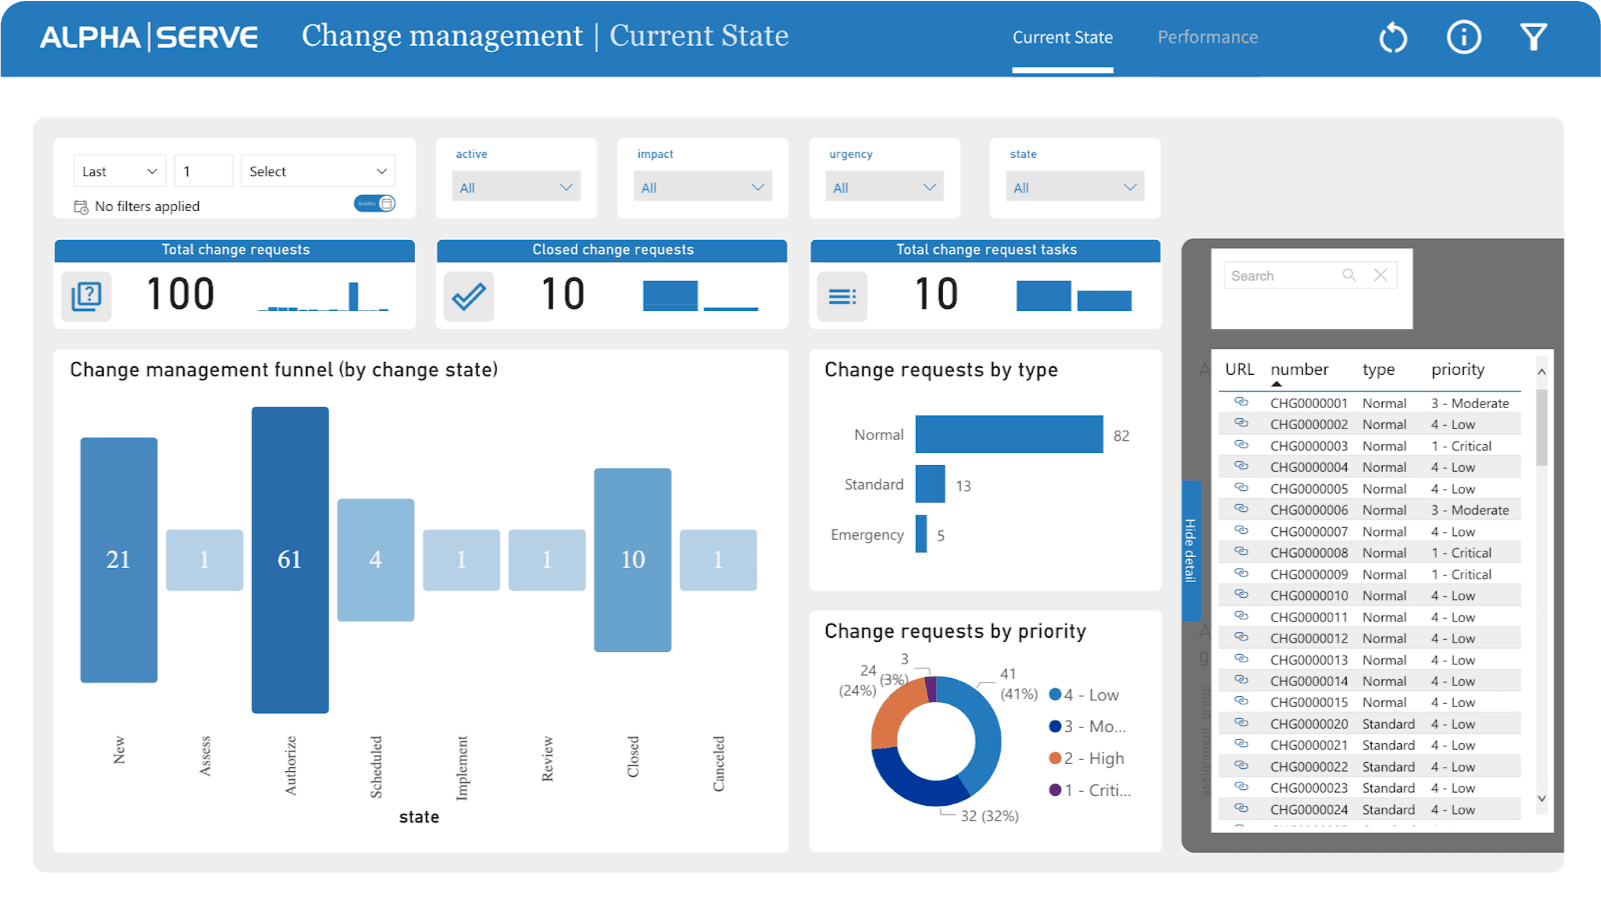
Users may rapidly access and manage changes in ServiceNow using the Change Management Dashboard. It displays all change requests, their status, priority, and impact in one place. A change management funnel template on the dashboard helps users track changes from request to review.
Alpha Serve's report template measures change management effectiveness with indicators like change priority and urgency, average closure time, and accumulated open requests by priority.
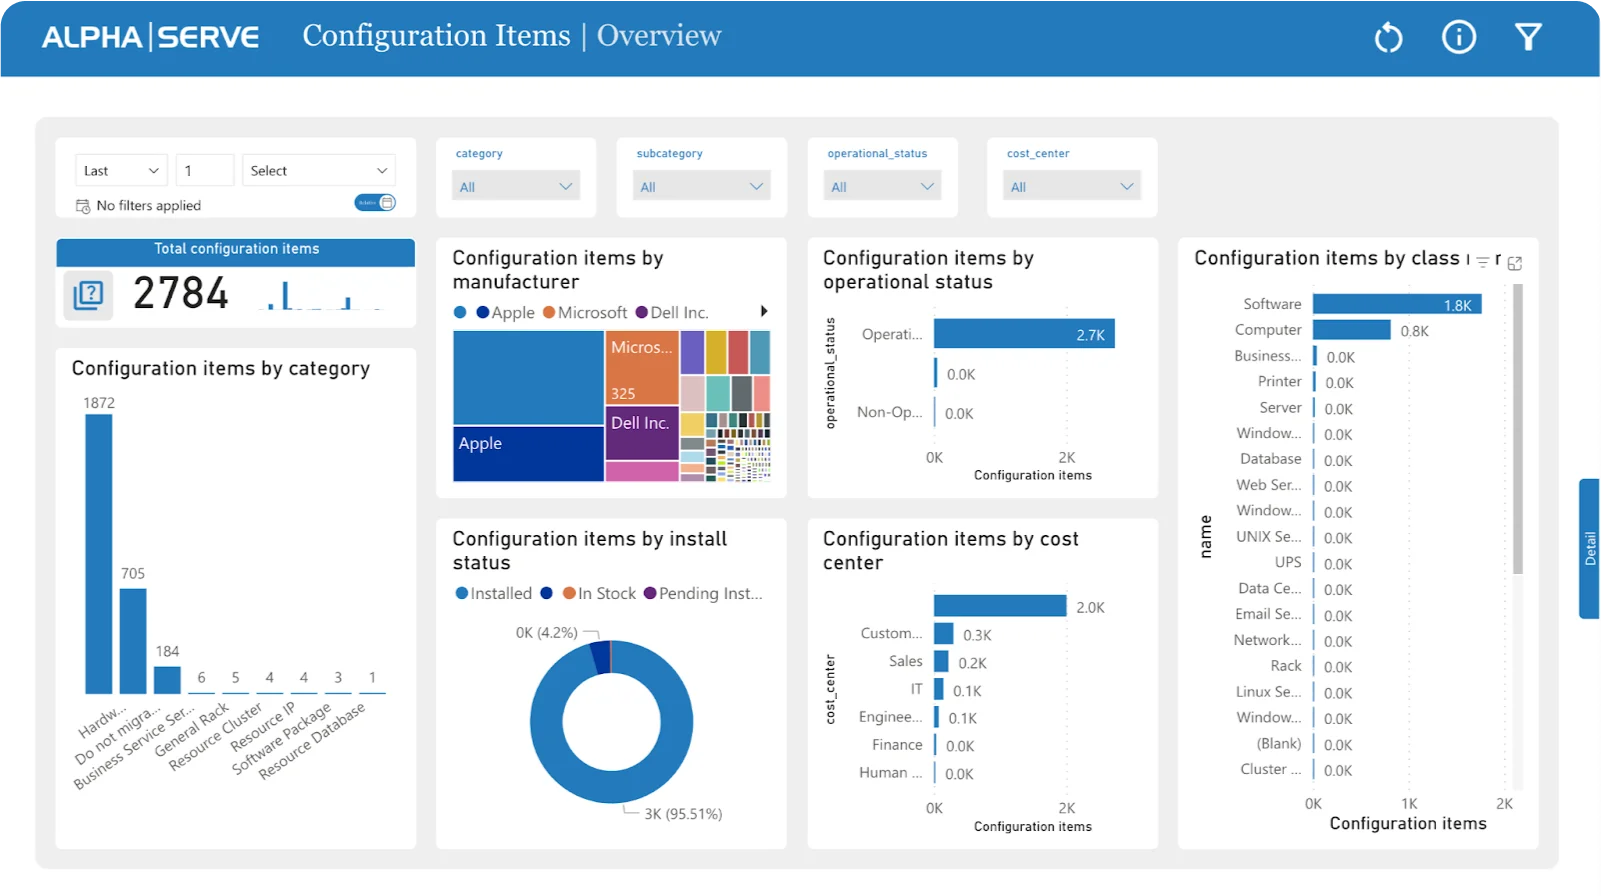
The ServiceNow Configuration Items Dashboard lets users manage and view configuration items organization-wide, improving IT infrastructure understanding and decision-making processes. The Alpha Serve configuration item template provides an overview of the organization's IT infrastructure, ensuring effective administration, maintenance, and quick problem response.
ServiceNow's configuration items template provides data visualizations of the organization's IT infrastructure by manufacturer, operational and installation state, class, and cost center.
Learn how to use Power BI Dashboard Templates for ServiceNow with this concise, easy-to-follow step-by-step guide:
Install the Power BI Connector for ServiceNow by following the provided instructions.
To create a new dashboard, click the "New from Template" button on the Power BI Connector Dashboard page.
Choose the desired template and press the "Create Data Source" button.
Configure the automatically generated data source by providing a custom name and description, then proceed to the next step by clicking Next.
Now, copy the Data Source URL and download the .pbit file by clicking the "Next" button.
First, to import the Power BI template into Power BI Desktop, launch Power BI Desktop. Then, click on "File" and select "Import" followed by "Power BI template" Finally, locate and select the .pbit file downloaded in the previous step.
Enter the copied Data source URL into the designated field.
Choose Basic Authentication and enter your login details.
Enjoy your ServiceNow dashboard on Power BI and leverage its capabilities to analyze your ServiceNow data effectively.
Feel free to customize your dashboard further according to your needs. Please consult our Documentation for detailed instructions.
Power BI Connector for ServiceNow
Connect ServiceNow to Microsoft Power BI for advanced insights and streamlined integration, enabling comprehensive data analysis and improved decision-making.
Start a Free TrialUsing Tempo Planner to streamline the management of teams and resources to find available team members and maximize your resource utilization.

Jira has two project types: team-managed and company-managed. We’ll explore both Jira project types so you can choose one that suits your needs.

Improve IT problem management with best practices and tools to reduce disruptions, enhance root cause analysis, and streamline resolution processes.

Compare 5 Planisware alternatives for portfolio leaders. See which one checks all the boxes on your requirements list.

Roadmaps are essential to bridge the gap between planning and action. Learn how to transform your roadmap into a dynamic, decision-ready tool.

Discover strategies to manage time effectively and avoid missing deadlines. Learn how Tempo can help your team meet project completion dates.

Manage all of your projects in a prioritized portfolio that builds your organization’s priorities into the schedule from the start.

Knowing which Agile at Scale metrics will best track your team’s productivity and success helps you set realistic KPIs and improve performance.

How to Build Good Relationships With Project Stakeholders | Planning intelligence & resource management software for smart projects.