Learn how timesheet reports enhance productivity and resource management. Discover valuable tools that automate the reporting process.

Efficient project management requires handling multiple contexts and considering loads of factors. That's why organizations rely on a comprehensive Jira Project Dashboard to reflect their data in a simple visualization. These dashboards are a valuable tool for enhancing project management efficiency and visibility as they offer real-time insights, customizable reports, and a centralized program for collaboration. Additionally, they can help manage projects and allocate resources effectively.
This article explores the details of the Jira Project Dashboard and how to Jira create a dashboard, letting you understand why data-driven project management is so important in today’s business world and clarifying how Power BI helps to analyze data by concluding from a large amount of information using Power BI Connector.

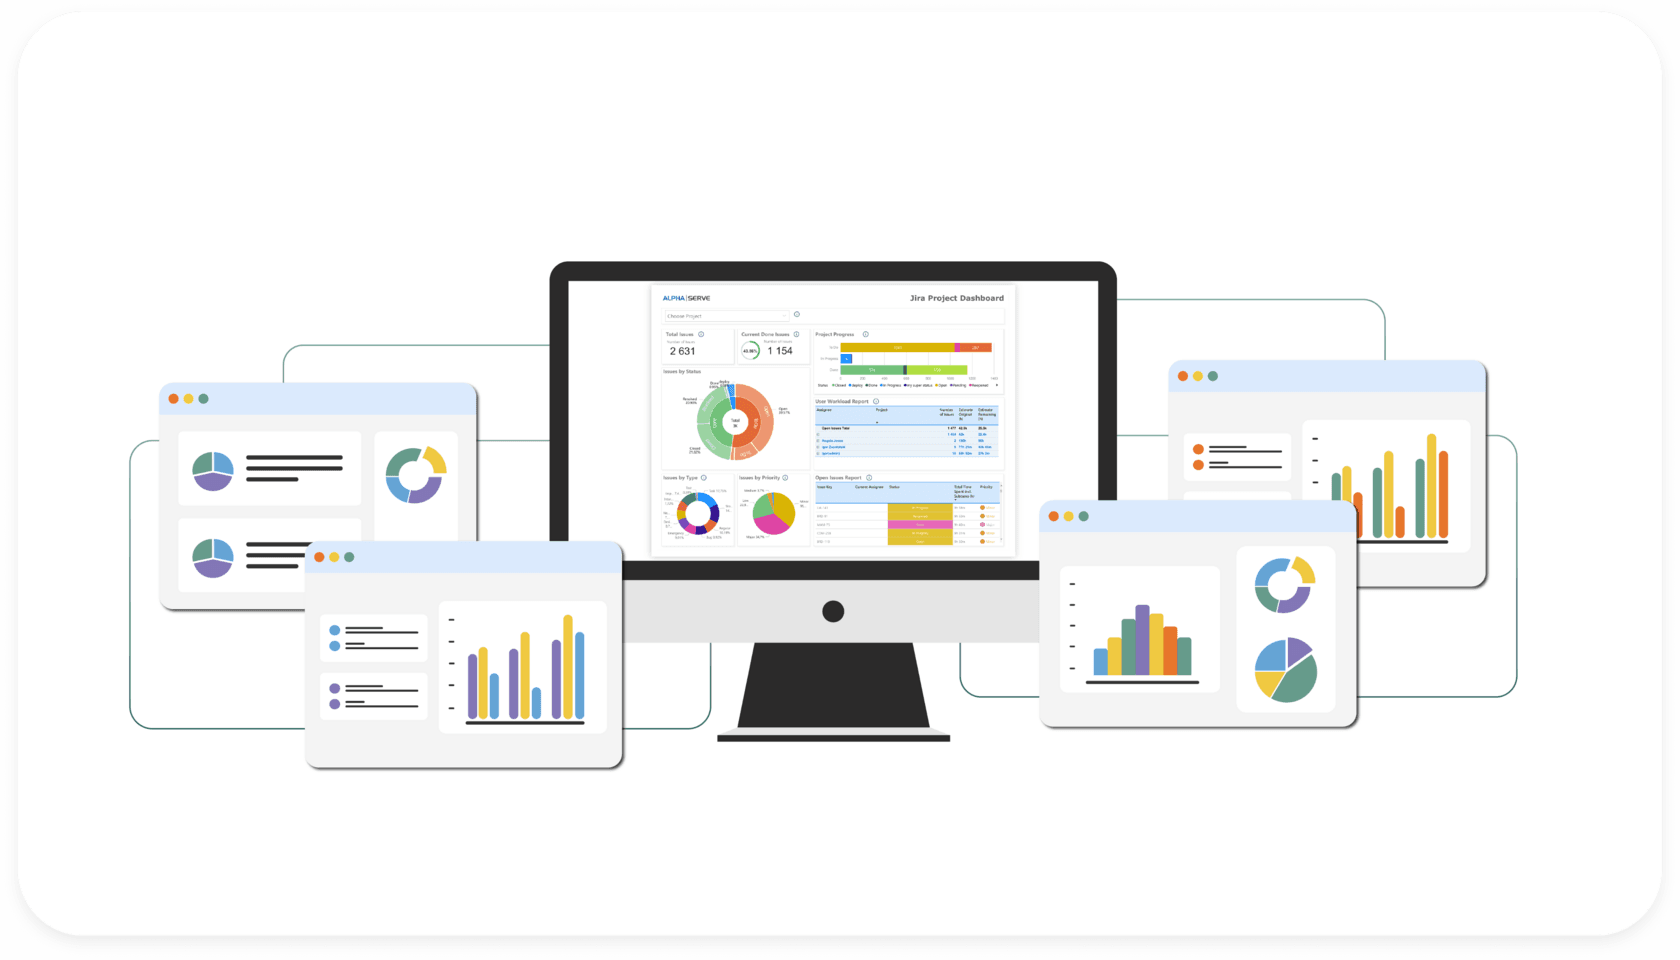
A dashboard in Jira is a set of “tools” or pre-filled data screens called “gadgets” that display different types of information in real-time. This helps users to track and monitor their work on projects. The Jira dashboard is the main display you see when logging in to Jira and it can be found in the top navigation of your Jira site. Dashboards can be private or shared with other users who can access all the relevant information in your instance about one or more projects. Users can create multiple dashboards from different projects, or multiple dashboards for one big overview of all the work involved. Dashboards are used to track the progress of assignments and problems and organize the projects, achievements, and instances in different charts.
The Jira Project Dashboard is a dynamic and customizable project overview report that provides a snapshot overview of all or some projects in a Jira instance. It allows teams to create aesthetically appealing and informative dashboards based on the needs of their organization. Jira project reporting dashboard displays Jira key performance indicators (KPIs) for the selected projects. It is useful for project managers and team leaders and allows users to monitor problems according to their type or priority, track the progress of a project, and control the allocation of work resources. The Jira custom dashboard leaves teams to choose between different reports and gadgets such as tables, charts, graphs, progress bars, etc., to create a clear and informative visual representation of the project’s data and metrics depending on the team’s needs. The very visual overview gives users quick and easy access to all the critical information about the project, allowing them to estimate the progress and performance.
A well-executed project can make a big difference between profitability and losses. That's why users can use the Jira dashboard examples to create a Jira dashboard for multiple projects that are difficult to manage in Jira's predefined reports. Additionally, the multi-project dashboard can be created in Power BI with the Power BI Connector for Jira.
The main purpose of the Jira analytics dashboard is to make it smooth and effective project management providing data in an easy-to-understand format. Here are its main insights:
Real-time data and insights: this feature allows users to make quick and informed decisions providing actual visibility into various project metrics and KPIs.
Improved collaboration and communication allow for centralized projects allowing teams to collaborate on it and giving access to the stakeholders to enter, easily interpret data, and share project-related information promoting constant communication and transparency between team members.
Key performance indicators (KPIs) tracking is an important characteristic that allows us to define, track, and visualize KPIs to ensure the project’s progress.
Identifying issues, bottlenecks, and delays in the workflow like overdue tasks, unresolved issues, or resource limitations, provides users with insights into when to take actions to correct them and allows them to keep a record of a project.
Monitoring project progress and all the elements such as sprints, resources, and issues allowing teams to access the status and track the project till its completion.
Boosting accountability and security provides visibility into individual and team performance and helps to take responsibility and attempt to achieve the final goal.
Cost control feature allows teams to view display budget vs. actual spending, helping to monitor the financial aspects of the project.
The Jira reporting dashboard is a central hub for project information for additional Jira project reporting and gives an outline and displays at a glance the main KPIs for all or just selected projects in your Jira instance, so that team members, stakeholders, and project managers can prioritize issues, track the progress and allocate resource. One of its main features is its flexibility and customization features.
Before talking about the specifics of how to create a dashboard in Jira for a project, let’s overview the key metrics necessary to start with:
The project timeline shows the date of the beginning, the data of the end of the project and the major turning points.
Resources allocation displays how the resources are allocated across the project, embracing team members, equipment, and budgets.
Task progress allows to track the progress of the individual tasks or project phases showing it as a task status indicator or a percentage complete.
Key performance indicators (KPIs) change depending on the project’s nature and can indicate defect rates, customer satisfaction, or on-time delivery.
Budget vs. Actual costs metrics compare the project budget and the expenditure and help to control the potential exceeds.
Risk assessment uses visual indicators to find potential issues that need attention.
Resource workload displays if the resources were distributed effectively or if some team members are overloaded.
Communication and collaboration metrics to track communication between teams and team members.

While Jira is the number one project management tool used to plan, track, and manage projects, Power BI is a powerful data visualization platform that unites multiple data sources to create interactive charts, reports, and dashboards. Whether the business uses a few or multiple tools for project management, support, and analytics, it’s crucial to work with a single source of truth. Power BI is a functional and dedicated solution for visualization and reporting that provides amplified capabilities for transforming and presenting complex data. Furthermore, it provides an unlimited customizable reporting experience with the ability to use different Jira Power BI templates.
To export data from Jira to Power BI easily users can use a ready-to-use solution such as Power BI Connector for Jira, available from the Atlassian marketplace. It is practical and easy to install and configure, even without technical expertise and there is no need for additional resources and costs to use it. Users can start using it for data export just after the installation is completed. Power BI Connector for Jira provides users with advantages, such as data security and rights management and it can handle large quantities of data.
Integrating Jira and Power BI offers multiple benefits to improve Jira project management and data analysis. It offers great reporting capabilities, teams can get real-time insights, track the project progress, and find the problems that need to be resolved. Users can also consolidate data from different projects into a single one easily and make simplified data analysis by creating a Power BI Jira dashboard.

The best way of building dashboards in Jira and to connect Jira to Power BI for easy and ensured data export is using the Power BI Connector from Alpha Serve. It allows no-code and unlimited data export, the selection of a relevant Power BI Jira template, and the ability to preview the data relationships before saving. Moreover, the exported data can be customized and the data refresh can be scheduled manually to a suitable time or on-demand.
Before diving into Jira dashboard creation, make sure you have Jira Cloud Administrator rights. Once you got it, start with installing Power BI Connector as embracing Power BI into your project management toolkit is not just a smart move; it’s a crucial one.
The Power BI Connector for Jira allows a direct Jira Power BI integration empowering users for boosted data management and analytics. This no-code Jira app offers a bunch of benefits such as data security and permissions management to keep data secured. Furthermore, it doesn’t require additional costs or resources for its operation while handling big data volumes.
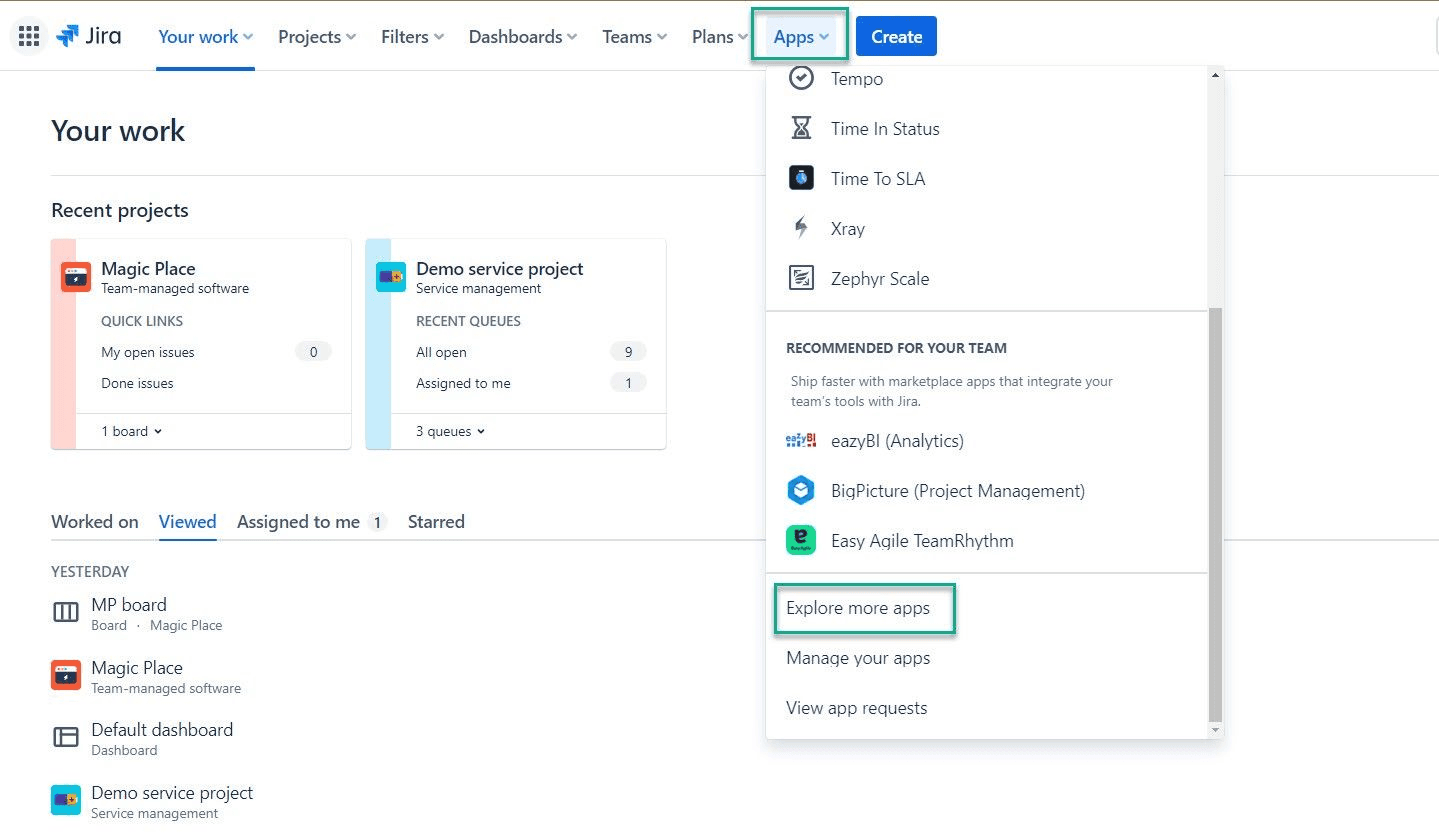
Before create a Jira dashboard, make sure the Power BI Connector for Jira is installed. Log in to your Jira cloud instance. Navigate to the top menu, select Apps, and then click on Explore more apps.
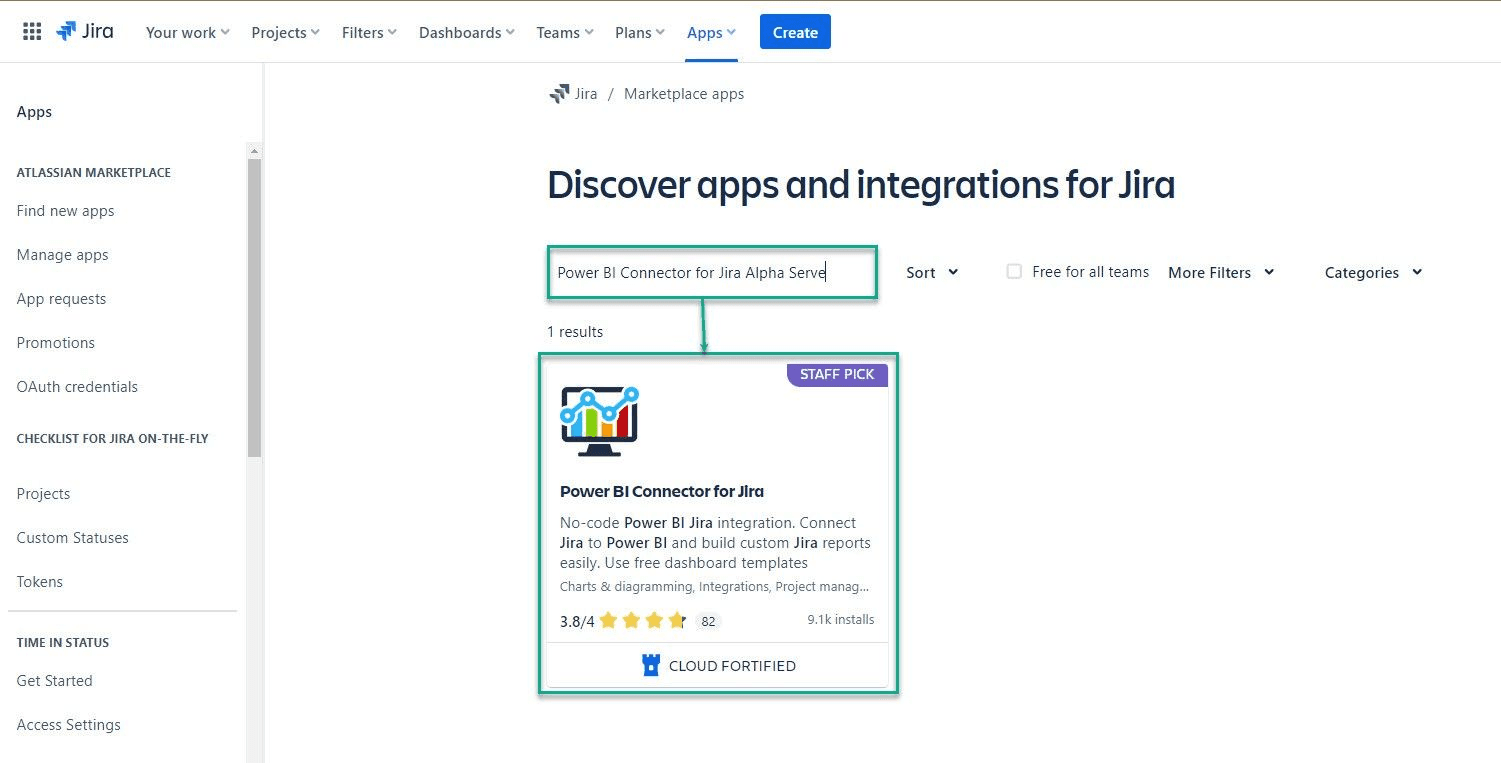
Search for the Power BI Connector. In the Search for apps box, type Power BI Connector for Jira by Alpha Serve and press Enter.
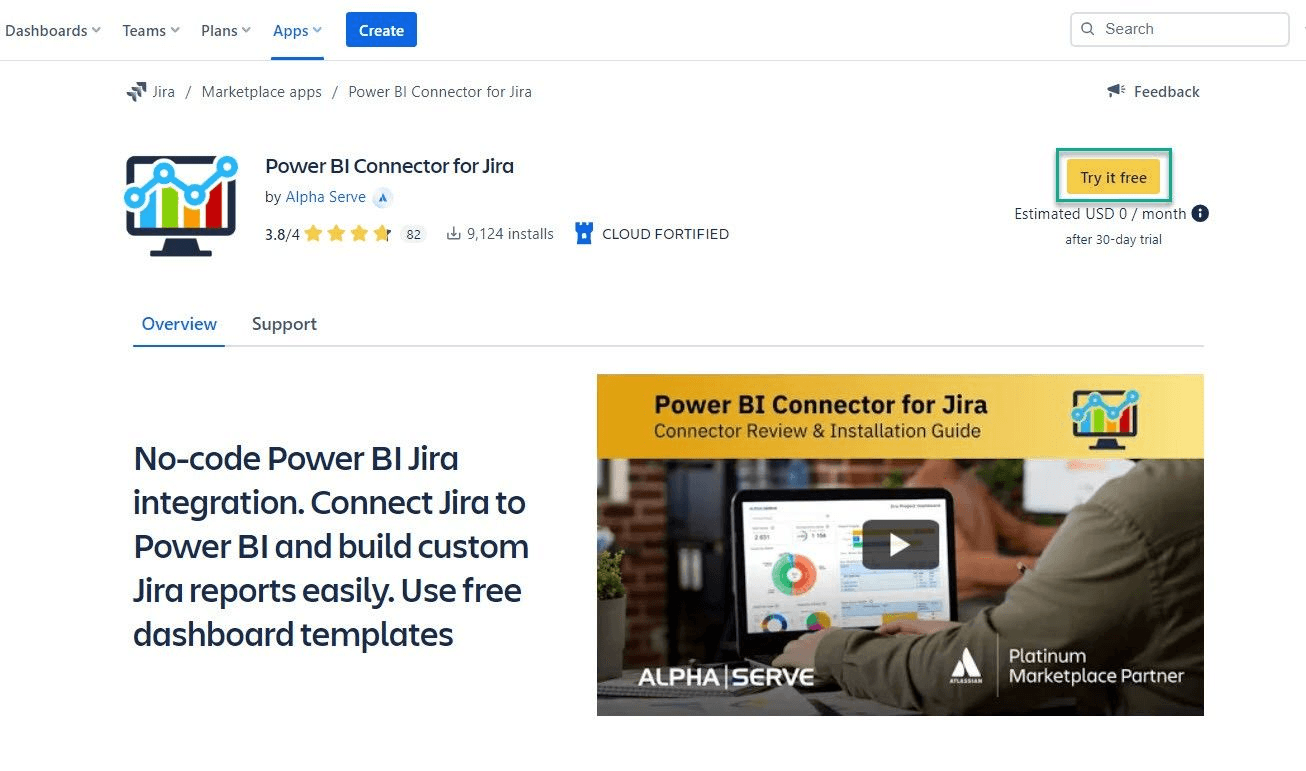
Click on Try it free to initiate a 30-day free trial license.
Finally, select Start free trial to begin using the Power BI Connector for Jira.
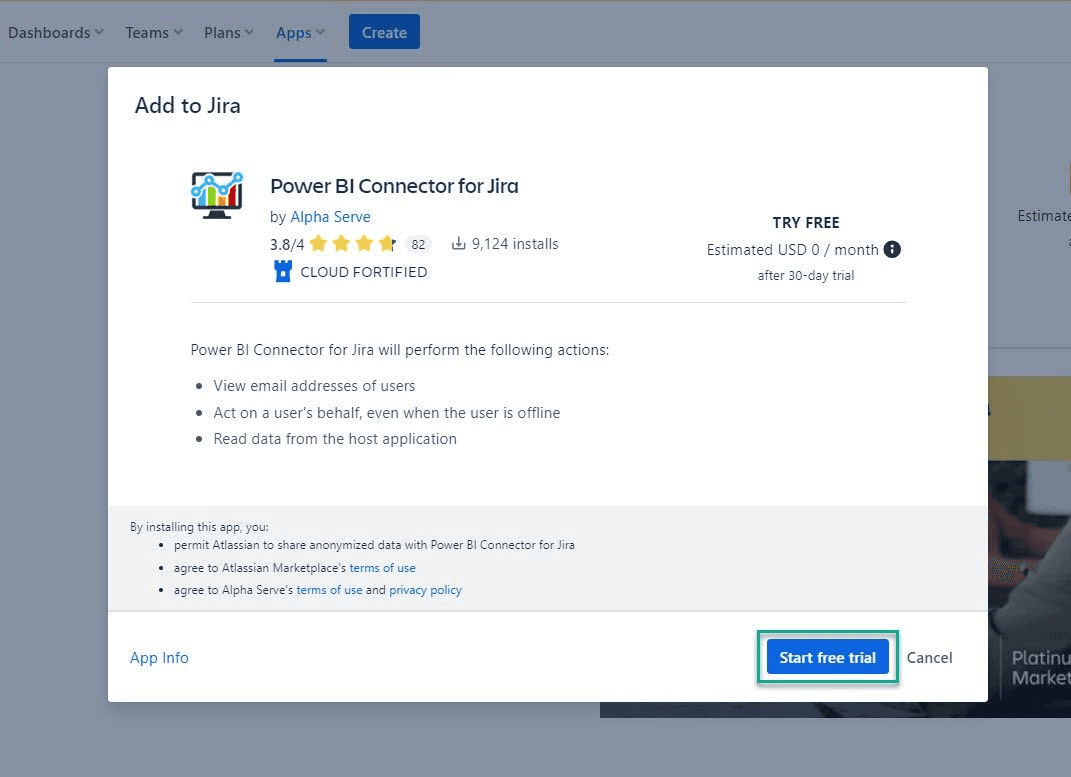
Otherwise, you can install a Power BI Connector for Jira from Atlassian Marketplace.
When the installation is set up, you can start building Jira dashboard. Go to the section Templates in Power BI.
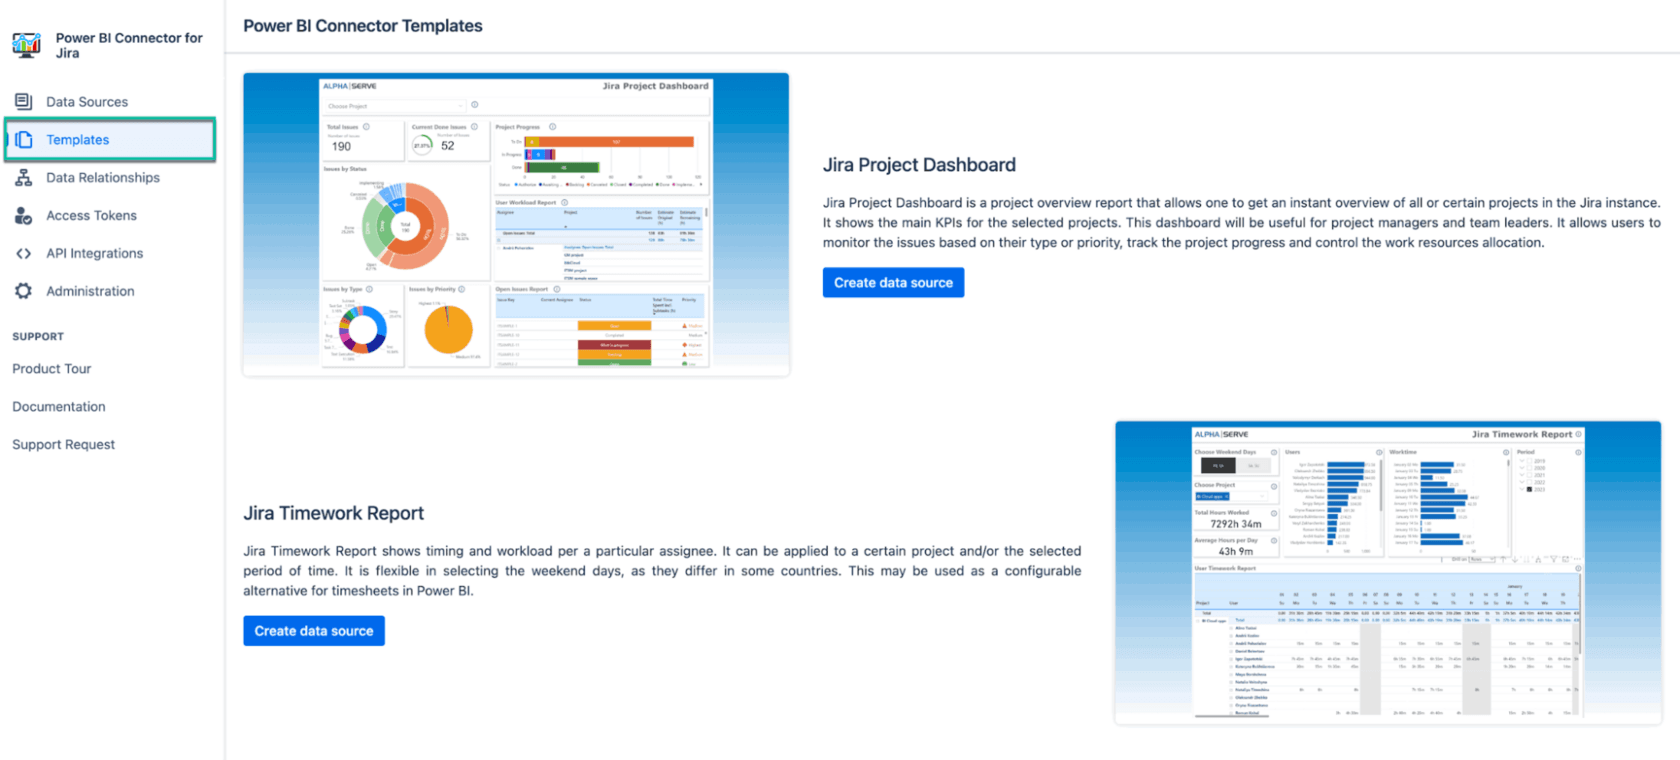
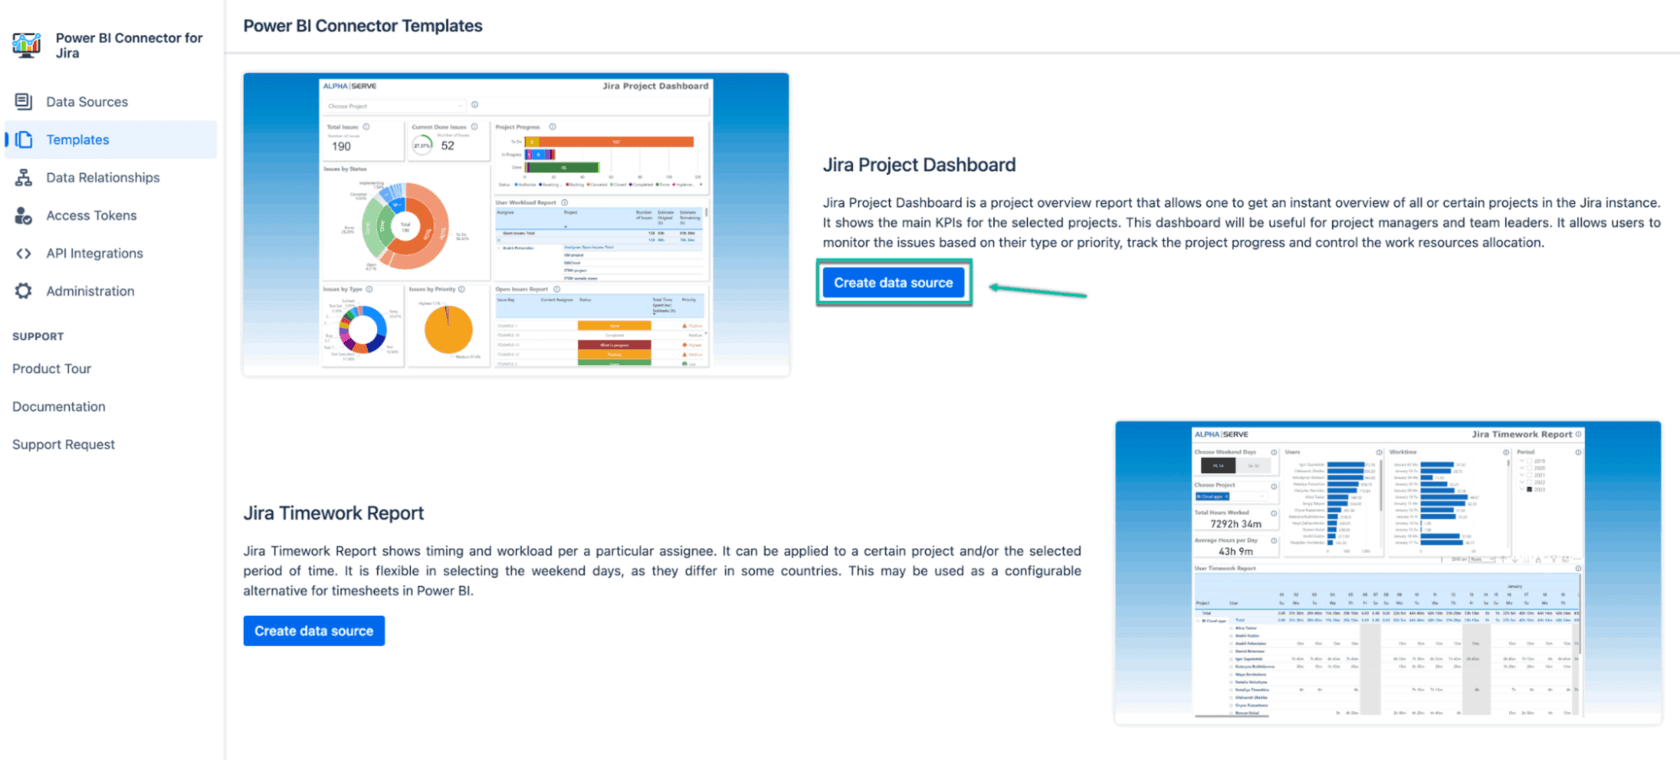
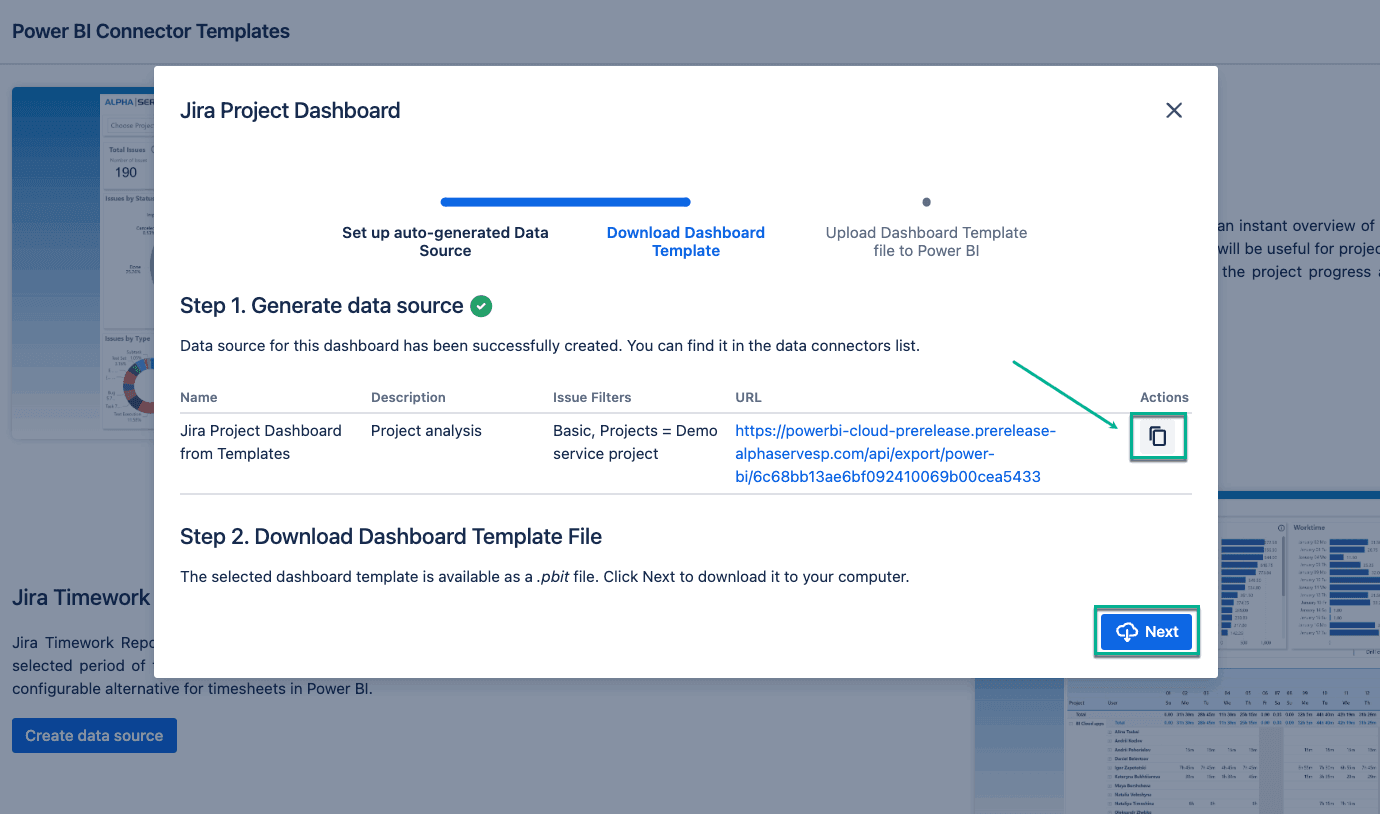
Select the Jira Project Dashboard template and click on the Create Data Source button.
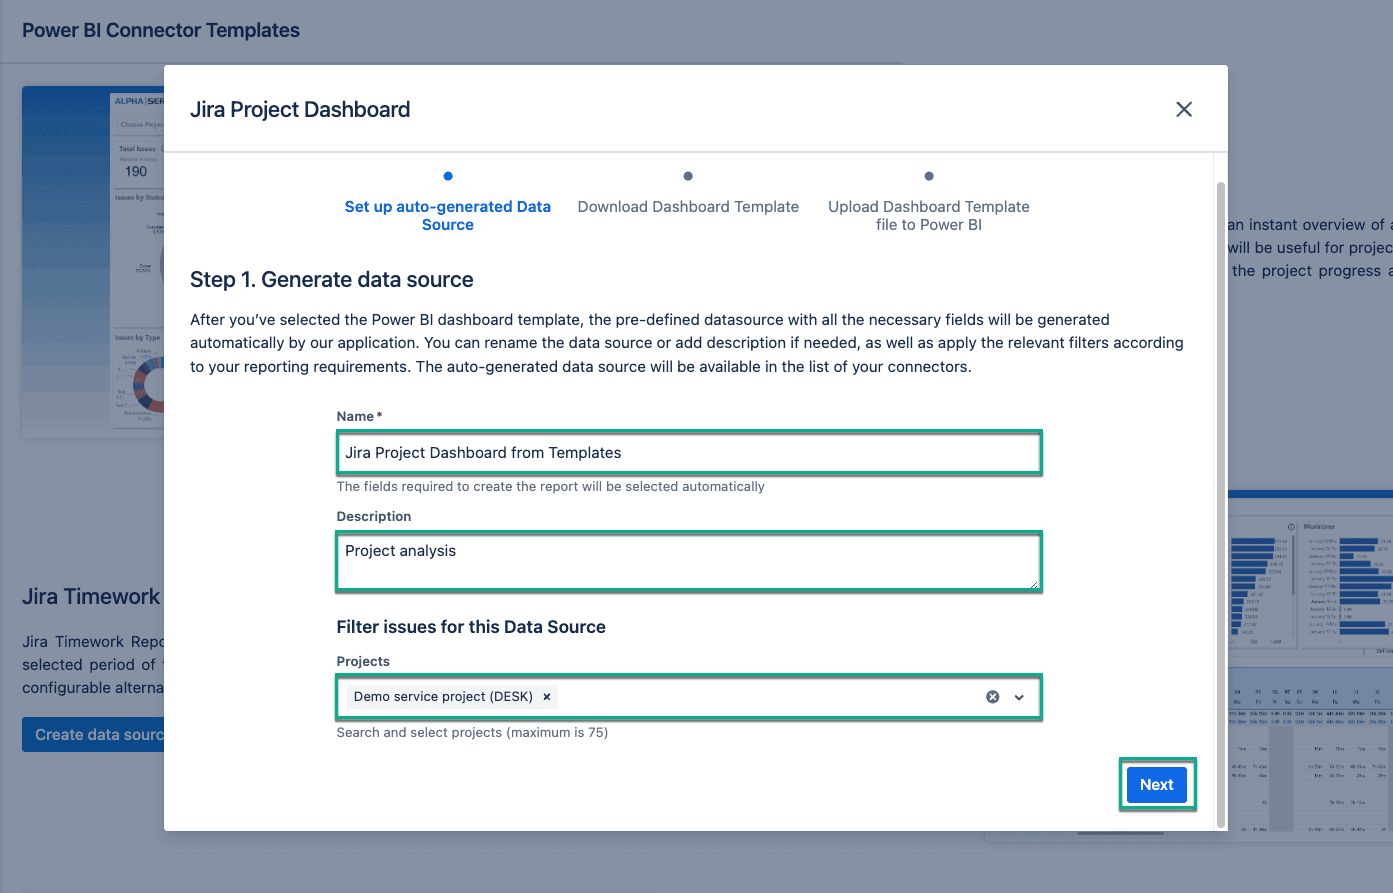
Configure auto-generated data source, including editing data source name, adding a description, and applying a project filter. Then click the Next button.
When you see the generated data source URL, copy it and click the Next button to download the file with .pbit format to your computer.
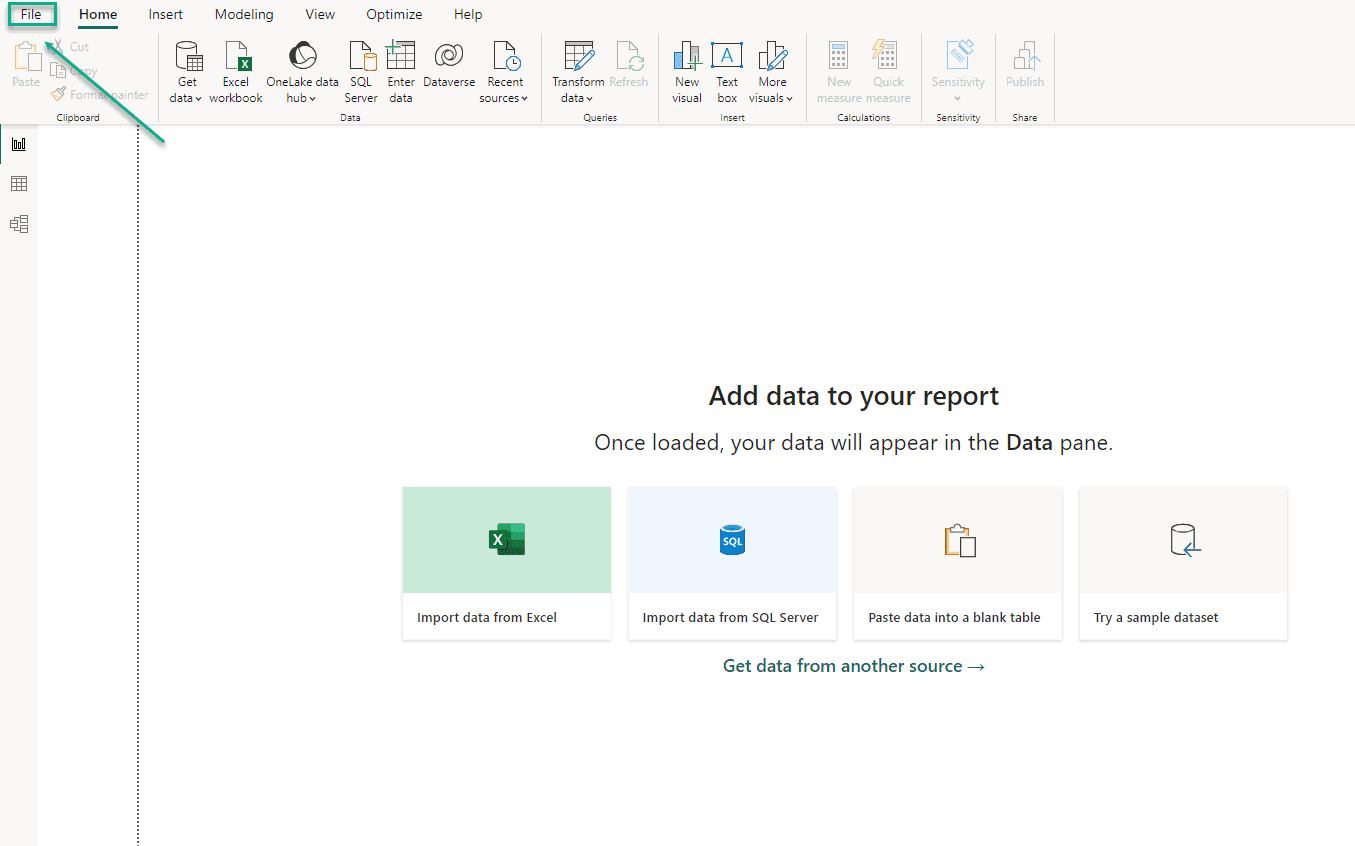
Open Power BI Desktop and go to the File section.
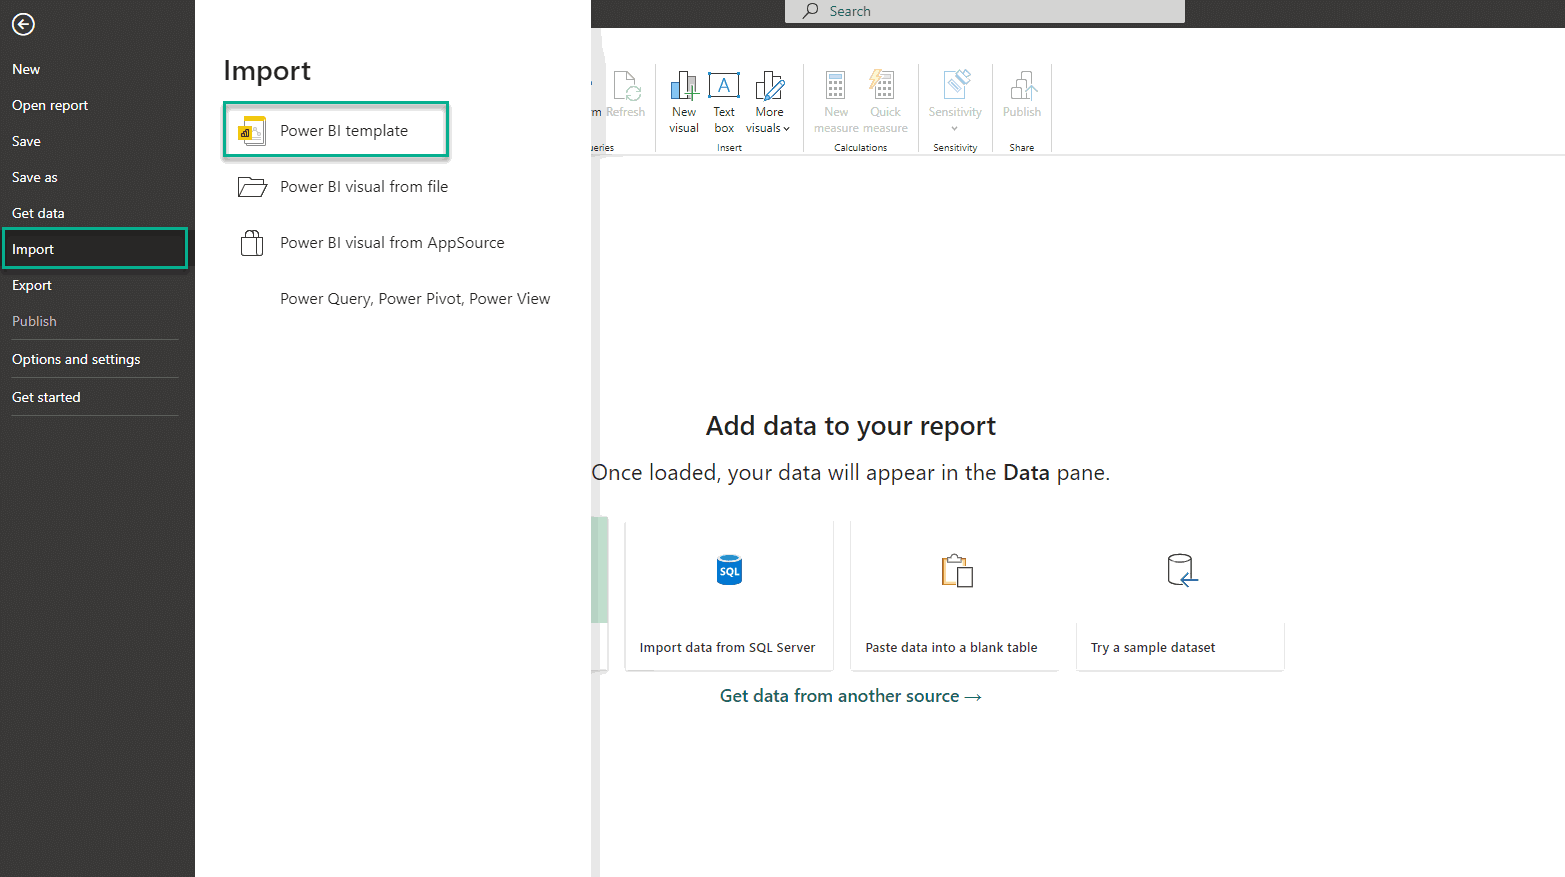
Click on the Import button and then choose the Power BI template.
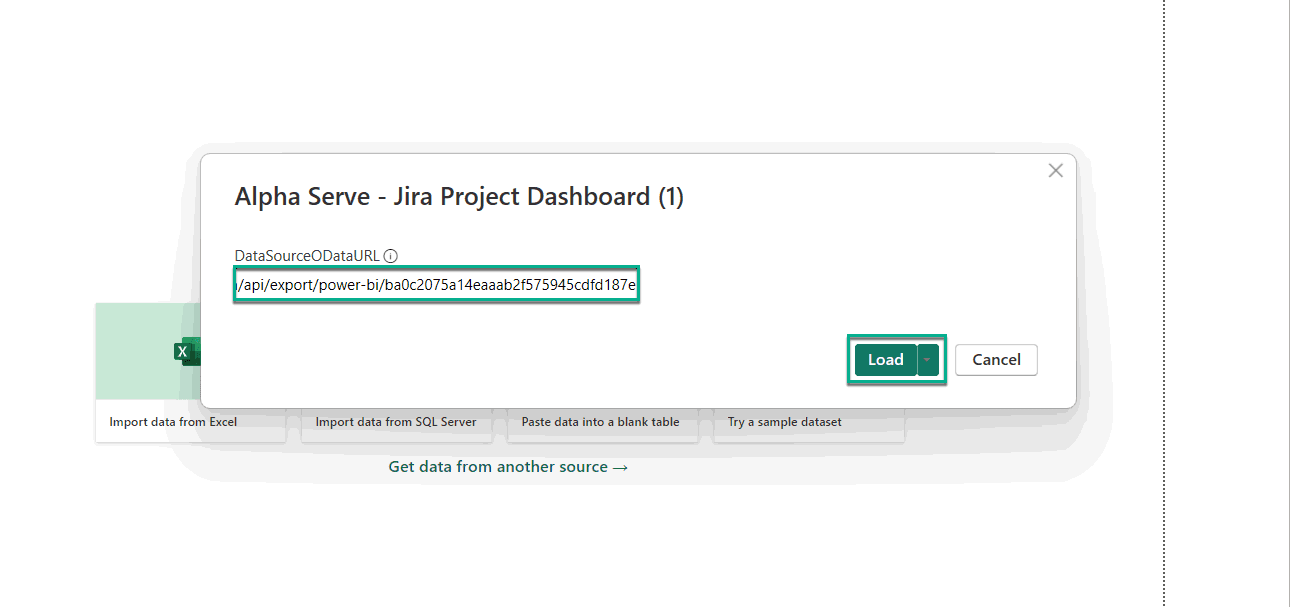
Select the downloaded file with .pbit format, import it using the Input_URL field, pasting the copied URL and clicking Load. Customize your Jira project dashboard. Insert the copied data source link (URL) into the corresponding field.
Select Basic Authentication and enter with your credentials. You can also select which level to apply these settings to. Click the Connect button.
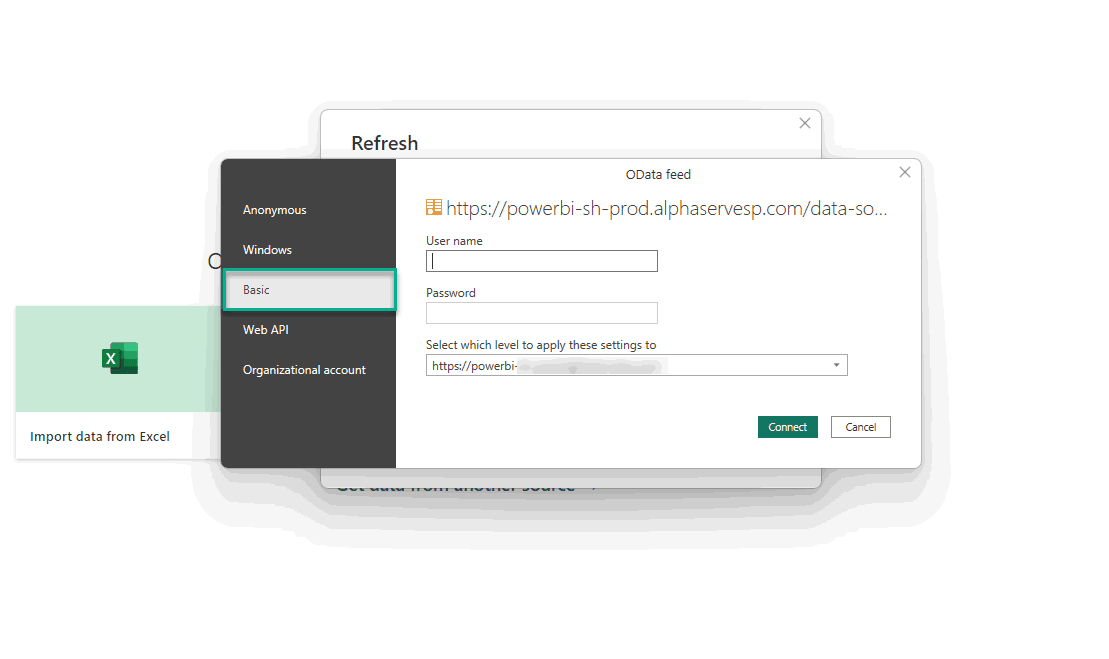
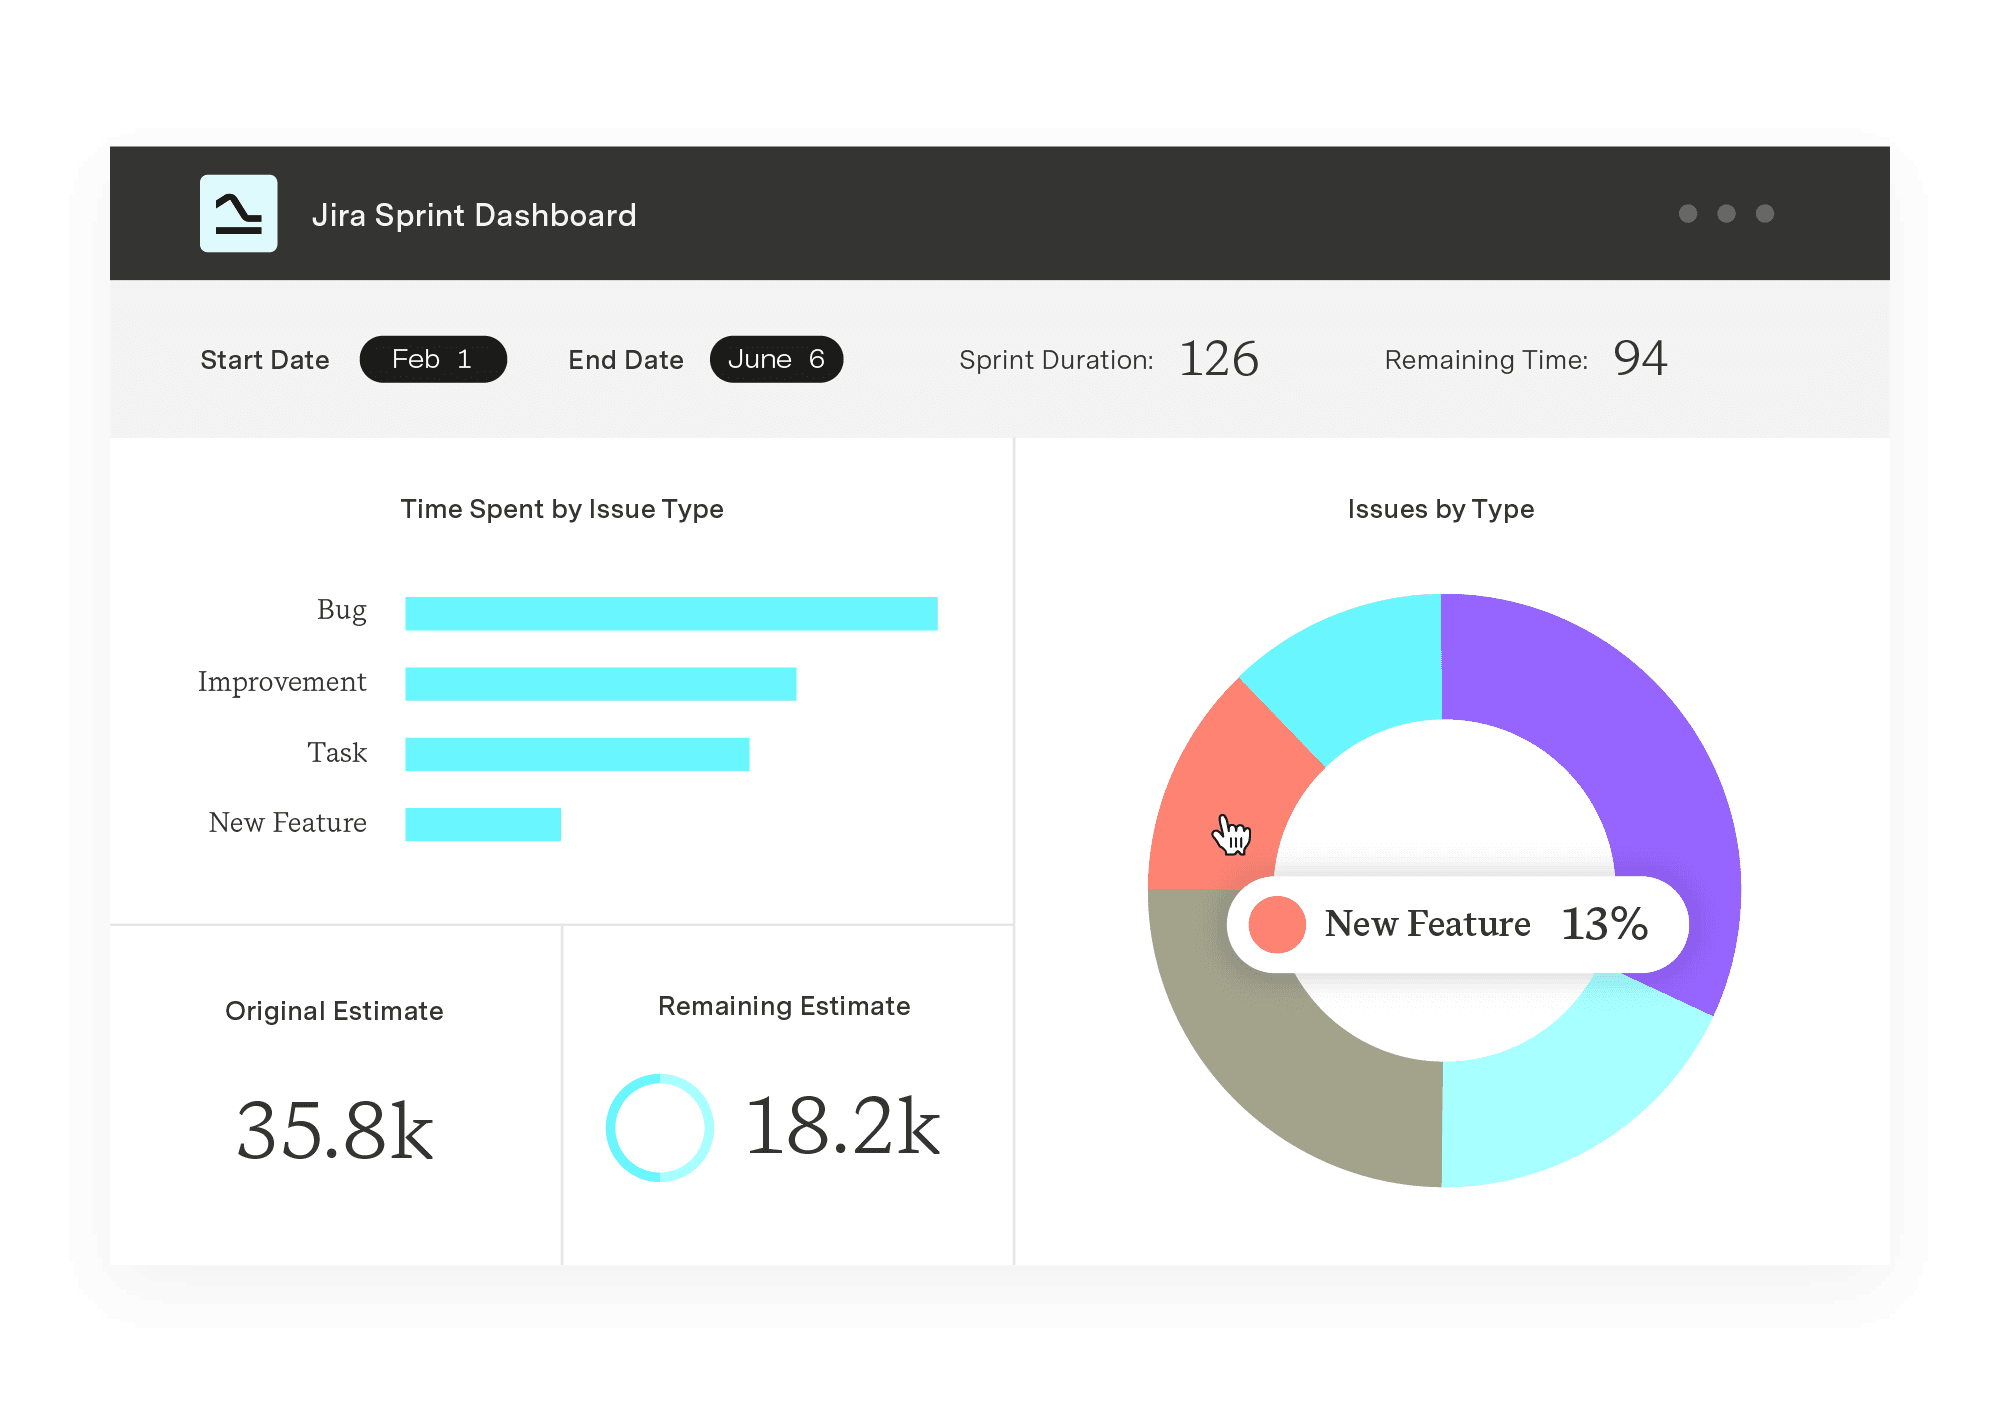
Once the connection is confirmed, Power BI will import the real-time data from your Jira instance, authorizing the creation of the dynamic and interactive Jira Project Dashboard. If there will be any change in your project such as updated statuses, new tasks or assignments, everything will be visible also in Power BI after a refresh.
And this is it! You can start using your Power BI Jira project management dashboard and provide effective project management.
Jira is beyond question an analytical source of business data for IT organizations of all sizes. It provides users with multiple dashboards related to their needs. The Jira Power BI dashboard empowers teams to make data-driven decisions, track the project’s progress, and identify bottlenecks for improvement. It provides great visualization and reporting capabilities.
Jira Power BI integration makes it easier to analyze data and allows users to create a Jira dashboard, generate dynamic reports with custom filters based on custom Jira fields, and seamlessly combine Jira data with other sources using Power BI Connector.
Use Jira Project Dashboard to monitor the overall project health with metrics like total issues and completed issues while visualizing percentage breakdowns by status, time, and priority and let your teams gain a better understanding of the projects, enhance the collaboration, make data-driven decisions and improve overall project management and performance.
Power BI Connector for Jira
Experience a new standard in data integration and reporting. Enjoy quick setup, effortless data export from all Jira products and third-party apps, and instant access to pre-built templates.
Start a Free TrialLearn how timesheet reports enhance productivity and resource management. Discover valuable tools that automate the reporting process.

So you know what an information radiator is, how it boosts Scrum team transparency and productivity, and how to create one in Jira.

Use a business requirements document template to align teams, clarify goals, and streamline project planning for successful execution.

This guide shares best practices and tips to create a better SAFe program board and improve your Program Increment planning sessions.

Capacity management works when you consider roadmap and operational load. See how engineering leaders plan real capacity in Jira.

What's the best way to represent and track PIs? Creating a "PI" Jira issue, fixVersion, custom fields, components, or labels? Decide which fits best.

Learn vital insights and tips to create a roadmap that effectively communicates project plans. Discover how roadmaps advance corporate objectives.

With Tempo Timesheets, you can create filters that can be used in different ways for time tracking and reporting on work performed in Jira.
Guide your development team to success using agile sprint goals. Establish goal-setting strategies to increase team productivity and improve outcomes.