Reap the benefits of a safe, efficient, and productive corporate environment and transform your workplace by implementing the 5S methodology.

Leveraging your data to get insights is challenging. However, tools like Jira Reporting and Power BI simplify getting insights from data, enabling teams to make fluid data-driven decisions.
This article will look closely at Jira Reporting and Power BI Reporting with Jira data. By the end of the article, you’ll know the instances where each of them excels. Let’s get started.


Jira is a robust issue-tracking and project-management solution for agile teams. Its multiple baked-in features focus on providing a single source of truth. For teams, it means utilizing the data source to plan, track, release, report, and automate different aspects of project management.
Jira Reporting delivers value to Jira users by providing an out-of-the-box reporting experience. Here, you can get real-time insights and make data-driven decisions by enabling teams to create dashboards and reports for smarter Sprint planning, taking necessary steps to meet goals, and optimizing agile delivery and performance.
Right now, Jira offers different types of reports which can broadly be categorized into:
Agile reports for Kanban teams
Agile reports for Scrum teams
General reports for analyzing issues
Reports for team-managed software projects
Each Jira report category offers its unique advantage. For example, using Agile reports, you can create “Burnup/Burndown” charts to understand project progress. On the other hand, “Forecast and management” reports let you learn about individual workloads and use the metrics to facilitate a healthy work environment.
Jira Dashboards let you use gadgets and reports to create a customizable environment for better project understanding. These dashboards offer excellent customizability with the use of filters.
In conclusion, teams get an in-house Jira reporting solution that lets you instantly create reports without the need to pay anything extra.
However, Jira Reporting does have some challenges. These include:
Limited functionality.
Permission-based approach limiting different users to access reports.
Unable to share Jira reports with outside users.
Power BI by Microsoft is a modern cloud-based data analysis and business intelligence (BI) platform that excels at connecting, visualizing, and sharing data with stakeholders. It offers a feature-rich BI solution with real-time analytics, big data support, excellent excel integration, and customizable UI/UX. Moreover, it also supports different data sources, including CSV files, Excel Spreadsheets, and even Jira data.
As for reporting types, Power BI offers the following:
Digital marketing reports
Website analytics reports
Customer profitability reports
Sales and analysis reports
HR Analytics report
Financial analysis report
Power BI also offers access to dozens of visualization elements, including area charts, bar and column charts, cards, combo charts, doughnut charts, decomposition trees, gauge charts, funnel charts, KPIs, key influencers charts, maps, and much more.
With Power BI self-service analytics, excellent data protection, and smart tools, you can manage your projects with excellent data-driven insights. Here, you can create custom reports more confidently with the option to import data from different sources.
So, should you use Power BI? Well, it depends on your requirements.
For instance, you should consider Power BI over Jira:
When looking for a more functional and dedicated visualization and reporting solution.
If you’re looking to create custom reports based on filtering Atlassian’s marketplace apps and Jira custom fields.
If your company is working on multiple projects and wants to cross-project reporting to better understand the project scope and progress.
If your organization wants consolidated reporting across all business functions to improve project management.
If you’re working with multiple data-source such as ERP, CRM, JIRA, etc., to create reports.
To want a more eagle-eye view of the projects with a Power BI dashboard that can list multiple reports in a single view.
To share reports across organizations that don’t have access to Jira while providing automatic updates.

This section will look closely at Jira and Power BI data sources available for Jira Reporting.
To feed data into reports, gadgets, and dashboards, you need to rely on Jira internal data or use marketplace add-ons to integrate data from other sources. If you want to work on several projects, then it is best to choose Power BI.
With Jira, you can create multiple types of reports. It offers standard reporting within a Jira project. The reports let you analyze different aspects of the project, including progress, issues, timeliness, and showstoppers. You can also analyze resource utilization to get a better project understanding.
Some of the Jira standards reports that you have access to include:
Average age report
Resolution time report
Time tracking report
And more.
You also get access to custom gadgets and dashboards which expands your ability to create customized reports and layouts.
If you're unsatisfied with in-built Jira capabilities, you can use add-ons inside your Jira instance. These add-ons add further capabilities to existing Jira reporting, such as giving you more types of reports or the ability to perform multi-dimensional analysis and Jira custom reporting. The well-known Jira add-ons for reporting include Power BI Connector for Jira, TimeTracker, Worklogs, and Clerk Invoices. You can find more Jira Reports add-ons here.
Customized reports offer more valuable insights compared to out-of-box reports. To create customized Jira and Power BI reports, you need filters.
To create customized reporting in Jira, you need Issue Navigator, where you can do data slicing and dicing. It also supports query creation which you can use to do a simple or an advanced search using a JQL statement. These searches can then be saved as sharable filters, which you can use in reporting gadgets, making them sharable among groups, individual users, or the whole organization. Moreover, these gadgets can also be included in Jira dashboards providing better visibility.
Overall, Jira filters give you a decent way to create custom reports but still lacking when compared to Power BI filter options. Power BI offers more flexibility when it comes to filters. For example, you can use Power BI to create custom reports based on third-party apps' custom fields and Jira's custom fields. Moreover, you can also apply various filters, including Basic or JQL, for custom Jira data export. In short, Power BI gives you the “right” tools to create your own data sets and then use them to visualize and create better reports.
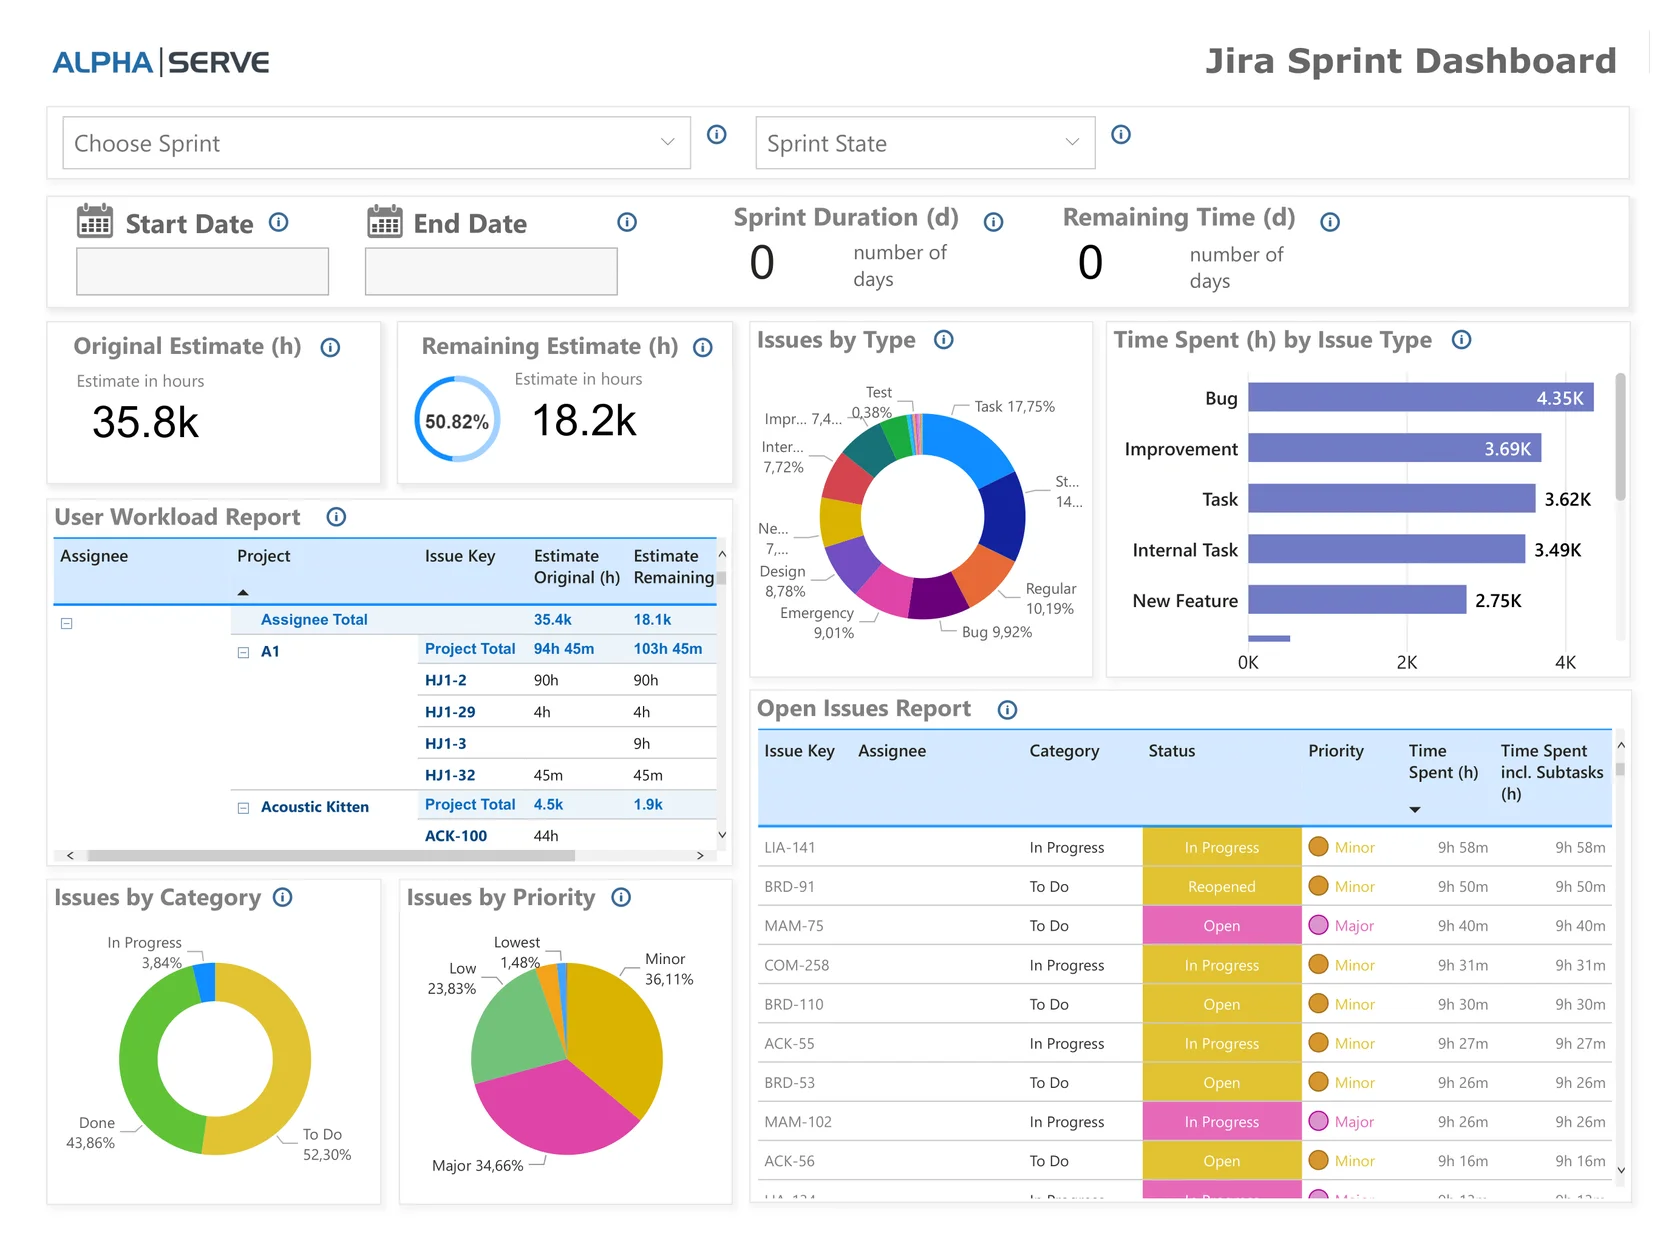
Along with reports, you can also visualize your data. Visualizing data enables the team to better understand data related to sprints, projects, and issues. In fact, you can make your reports better with visualization, be it Jira or Power BI.
Jira and Power BI offer visualization elements such as graphs, charts, and maps. You must use visualization elements to tell a cohesive story with accessible elements in a report. In short, visualization makes reports easy to understand, allowing teams to tell stories.
Jira reports already have visualization elements. For example, “Average Age Report” uses the bar visualization element, and “Created vs. Resolved Issues Report” uses graphs to convey the message visually.
Next comes the Jira dashboard, which lets you create stories using built-in gadgets and custom reporting. Dashboards are customizable parts of Jira visualization where you can capture custom data through filters and include reports. The Reporting Gadget for Jira Data enables to showcase of smaller yet meaningful details on the dashboard. For example, you can use “Calendar gadget” to showcase due dates or use “Issue Statistics” to display issues collection returned from a specific filter. Other gadgets you can use include Resolution Time, Two-Dimensional Fitler Statistics, Pie Chart, etc.
Additionally, you can also use Jira Atlassian Analytics (currently in Open Beta for Cloud Enterprise customers) which gives you access to more visualization options, including starter dashboards. This starter dashboard lets you discover insights from product data. Check the official Atlassian Analytics page to know more.
Lastly, you can use visual add-ons on the Jira marketplace to further improve data visualization in Jira.
Power BI is a dedicated visualization and data analytics tool. For Jira users, it opens up a plethora of options when it comes to visualization. It offers various visualization types, including area charts, bar and column charts, a single number or multi-row cards, combo charts, decomposition trees, doughnut charts, funnel charts, and more. If you want to know about the complete list, check out visualization types in Power BI. Moreover, it also offers customizable dashboards that can connect different data sources, including Jira, CRM, etc.
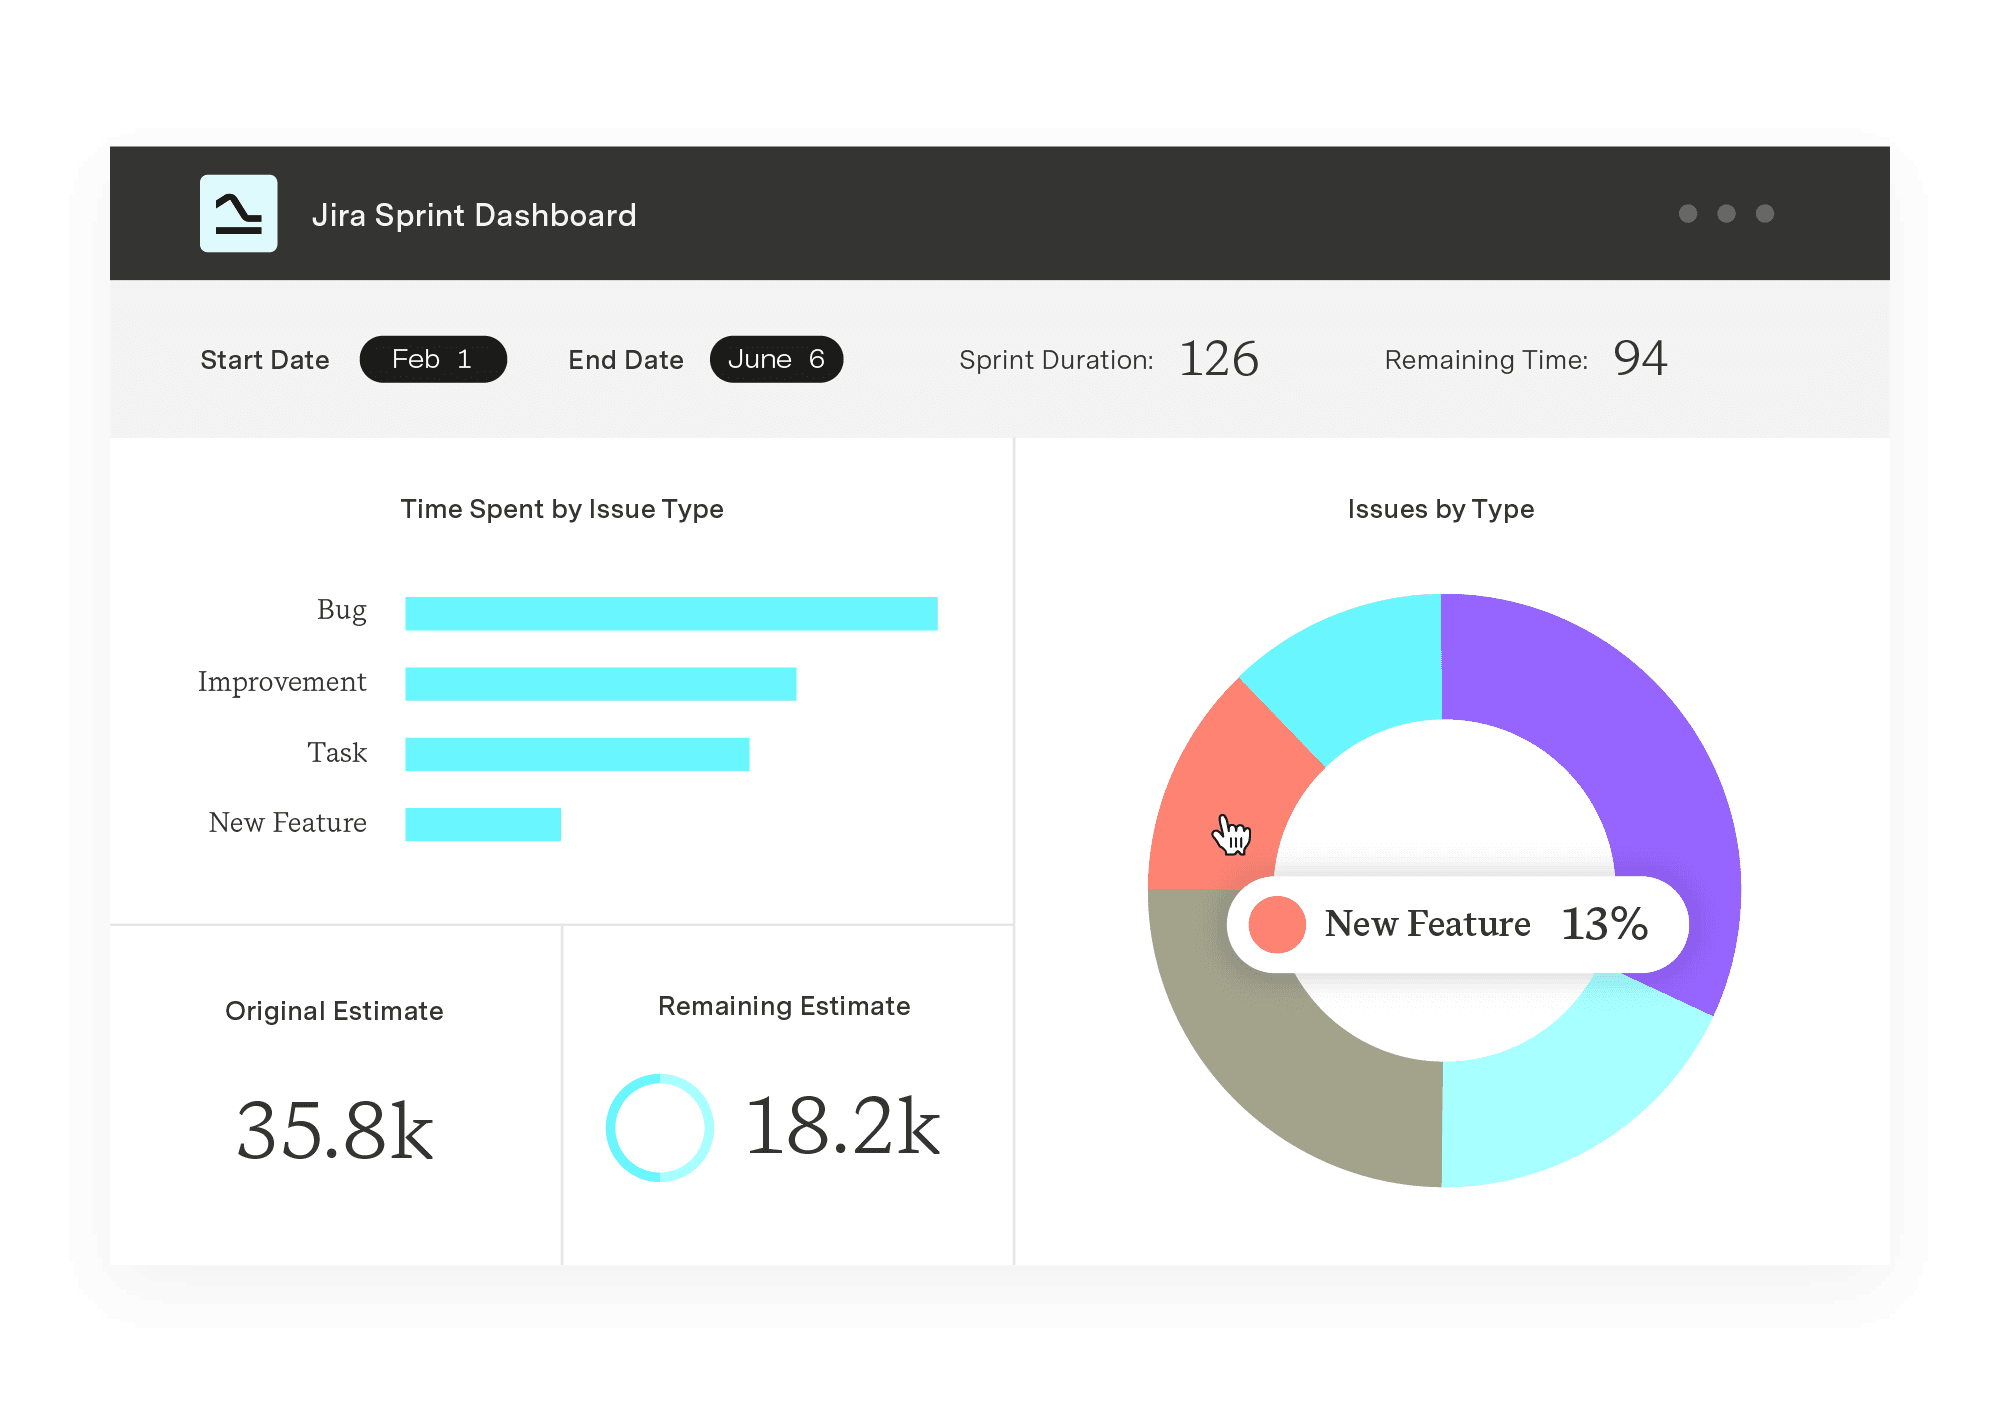
To get started with Power BI visualization for Jira data in the best possible way, you need a dedicated Power BI Connector for Jira to create a seamless connection between Jira and Power BI. The Connector is feature-rich. Also, its new update introduced pre-configured dashboard templates. Among the Jira dashboard examples are Jira Project Dashboard, Jira Spring Dashboard, Jira Spring Time Report, and many more. Besides, you should consider this Connector for easy sharing Power BI reports with non-Jira users.
Overall, Power BI offers a better reporting and visualization feature set. In Power BI, you can work on multiple Jira projects and charts. You also get to create one convenient Power BI dashboard, which lets you get an eagle-eye view of your project(s) or tell a story with customizable visual elements.
Reporting is an ongoing process as it heavily relies on ever-changing data. To stay on top of changes, you need to have a reporting tool that can do automated report refresh and share the results with peers.
You can create reports in Jira based on real-time data, however, as mentioned above there are several reporting limitations. While with Power BI you will get Jira reporting based on actual data. However, it won’t affect analysis, as data export is automated and takes less than 5 minutes, plus you can always schedule a refresh for the required timing.
If you’re using Power BI for Jira data, you can set up an automatic refresh on the Power BI service. For example, you can set up data refresh when you publish a report or dashboard. This gives Power BI a clear advantage as it doesn’t require manual data refresh. Read the detailed instruction on how to schedule a refresh on Power BI services.
Power BI also offers easy data share among non-Jira users, making it a clear choice for enterprises that want to share reports more intuitively.
Native Jira Reporting is excellent. It allows Jira users to create reports with access to pre-configured reports and a customizable dashboard. However, Jira Reporting with Power BI allows more flexibility in reporting, visualization, and sharability. To make the most out of Jira Reporting, you can use Power BI Connector for Jira, which offers a seamless connection for easy data sharing and pre-configured dashboards that lets you tell stories through data. So, which one do you prefer? Share this article with your thoughts.
Power BI Connector for Jira
Experience a new standard in data integration and reporting. Enjoy quick setup, effortless data export from all Jira products and third-party apps, and instant access to pre-built templates.
Start a Free TrialReap the benefits of a safe, efficient, and productive corporate environment and transform your workplace by implementing the 5S methodology.

Understand the difference between strategy vs tactics with clear definitions and real-world examples across product, marketing, and customer success.

Discover 13 project management tips and tricks to help you deliver desired outcomes on schedule and within budget without stressing your team.

With a deep understanding of your team’s activity, you’ll be better equipped to make the decisions that matter.

Streamline your business’s software deployment with these IT release management tips. Discover best practices and customizable software solutions.
Support your team by using the best project planning tools out there, and discover how Tempo’s products can enhance your workflow.
Establish a robust project closure process that punctuates your team’s hard work and transfers responsibility for the outcome to your client.

Explore the best KPI software for tracking performance and aligning goals. Compare top tools & see how Tempo surfaces real-time KPIs directly in Jira.

What are operating expenses? How does tracking them improve a company’s bottom line? Here are the basics for understanding this type of expenditure.