

Visualize Jira issues by status, assignee, priority, or any custom field. Custom Charts for Jira makes pie charts ready in minutes – no JQL required.

Custom Charts for Jira turns dashboard clutter into decision-ready views. The gadget suite covers charts, issue lists, dynamic filters, cycle-time tracking, historical reporting, and integrations with the tools your teams already use. Here are the features that do the heavy lifting.
The namesake gadget. Teams use it to build clean, presentation-ready charts from any Jira data — burndowns, backlog health, sprint velocity, workload splits — without wrestling with JQL or exporting to a spreadsheet.
See issue specifics on the dashboard itself. Display as many or as few fields as the audience needs, and track supporting data like SLAs alongside the work.
Filter connected Custom Charts and Issue Lists on the fly. One dashboard replaces the ten near-duplicates you used to maintain for each team, region, or component.
Monitor progress with a built-in time-in-status calculation. See how long work sits in each status on average — in hours, days, weeks, or years — and spot the bottlenecks that stall delivery.
Track how teams perform over time with Issue History reporting. Every system field is supported, so trends in priority, assignee, status, and story points are all fair game.
The tools in your stack should work together. Custom Charts integrates with Assets and a range of third-party apps, so dashboards pull from the sources of truth your teams already rely on.
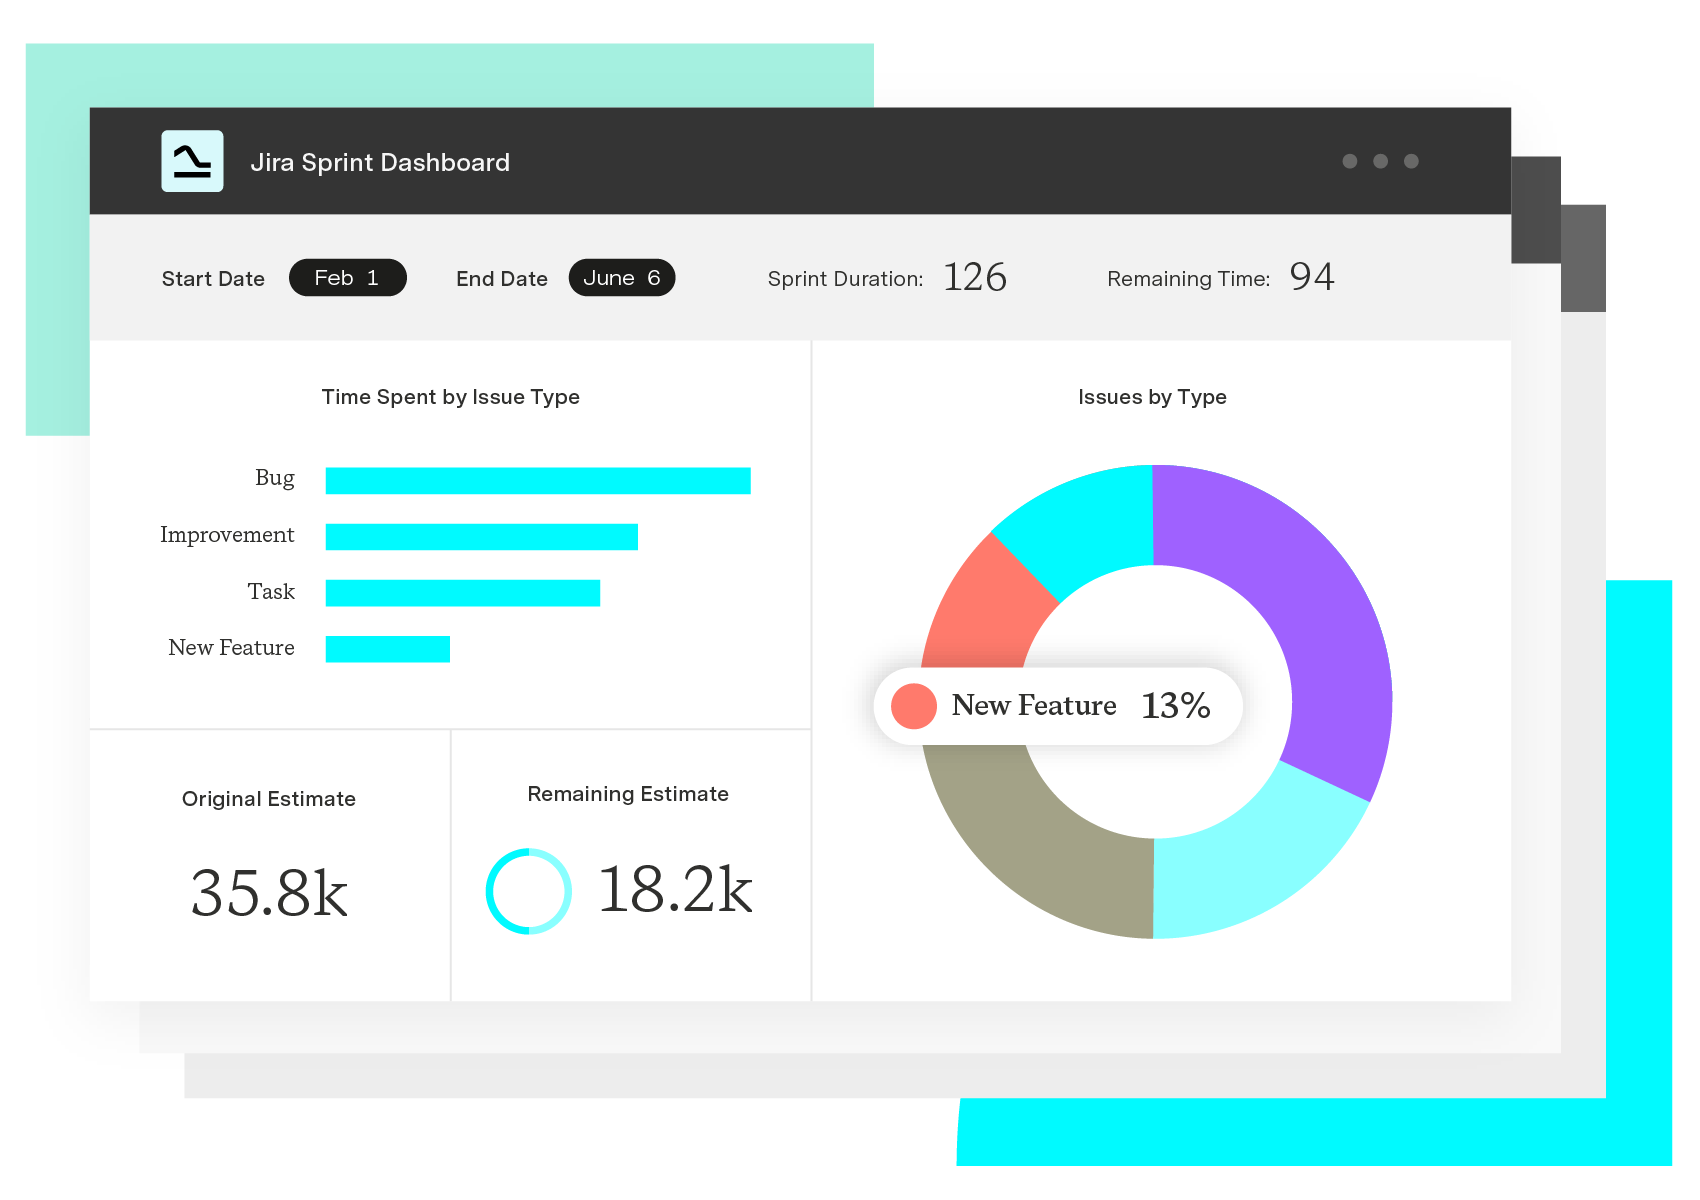
Custom Charts for Jira
Build charts and dashboards to evaluate delivery, capacity, and speed for all teams with Jira's most flexible custom reporting app
Start a Free TrialVisualize Jira issues by status, assignee, priority, or any custom field. Custom Charts for Jira makes pie charts ready in minutes – no JQL required.

Seeking deeper insights from your Jira data? Compare Rich Filters for Jira Dashboard and Custom Charts for Jira to find the best product for you.

Learn how various Jira custom reports can improve team efficiency and manage workloads while providing the necessary data for informed decision-making
Colors, tables, advanced JQL search, and anything else you need to create the perfect visualizations in Jira and Confluence with Custom Charts.

Learn how to generate Jira reports in Confluence to help build transparency, informed decision-making, and facilitate organizational collaboration.

A new gadget now comes with Custom Charts for Jira. Called Issue List, it’s similar to native Jira’s Filter Results, but better. Check it out.

Migrate to Jira Cloud with confidence. The software’s new features are exciting, and Atlassian provides resources to support a smooth transition.

Ready to make the most of Tempo? Unlock powerful analytics and drive smarter decisions with intelligent insights.






















