Optimize work processes and produce superior project outcomes by learning to nurture a work environment that supports effective team collaboration.

Microsoft Power Query stands as an essential instrument for streamlining data into desired formats. With its capabilities, users can seamlessly explore, link, merge, and polish information from various sources and diverse formats to facilitate analysis and reporting. This article tells how to use Power Query, a widely utilized add-in for Microsoft Excel and an integrated component within Power BI, Microsoft's business analytics service.

Data is generated incessantly in today's digital age, making its processing a vital aspect of every business operation. Extracting valuable insights from data has become essential for achieving competitive advantages, optimizing operations, and enhancing customer service. Simply put, companies without efficient data processing mechanisms limit their ability to leverage valuable information that could lead them to more significant success.
Manual data processing is exceptionally time-consuming. Nowadays, computers handle this task more efficiently, with tools like Power Query standing out as one of the most effective solutions. It streamlines data connection from diverse sources, allowing users to transform it intuitively, encompassing functions like cleaning, reshaping, and merging.
Now, let's explore why use Power Query is important.
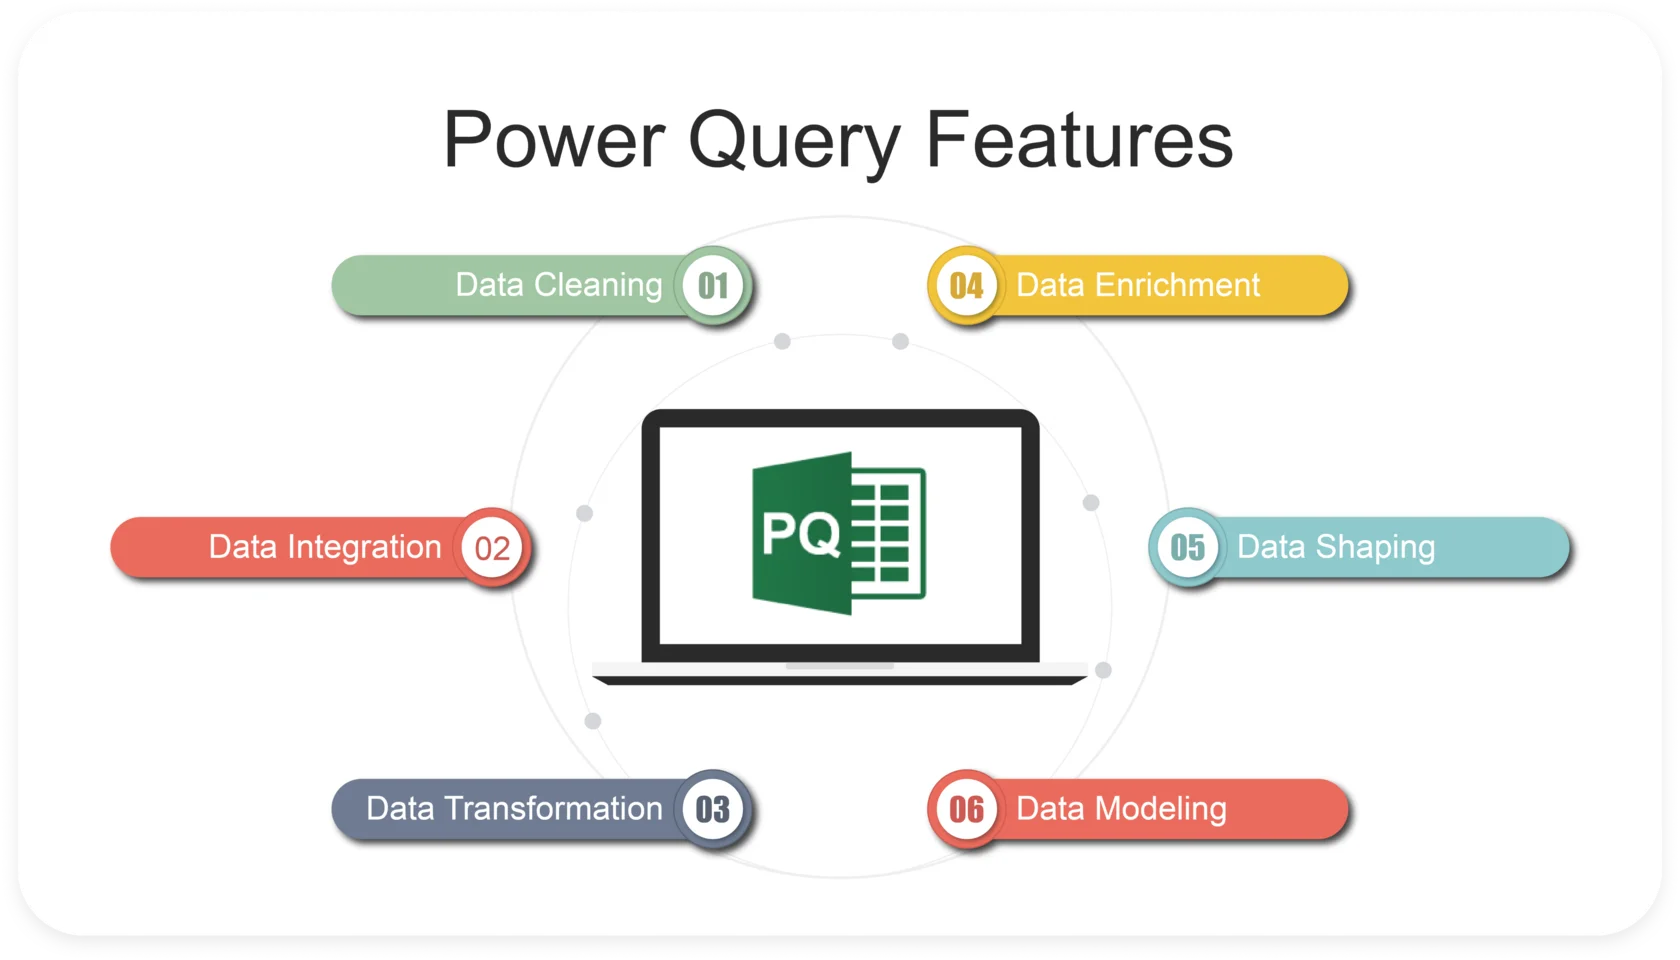
Power Query is your go-to tool for getting your data ready and in shape. It helps you clean it up, tweak it, and make it all nice and tidy so it's ready for analysis and reporting. Some of the winning Power Query features include
Data Cleaning: Power Query allows users to remove duplicates, correct errors, handle missing values, and standardize formats.
Data Integration: Users can combine data from multiple sources, such as databases, spreadsheets, and web pages, into a single dataset for analysis.
Data Transformation: Power Query provides more than 300 transformation capabilities, including splitting columns, merging tables, transposing data, and applying custom calculations. Available AI-based options make the process even more flexible and intuitive.
Data Enrichment: Users can enrich their datasets by adding new columns derived from existing data or external sources through web queries.
Data Shaping: Power Query enables users to convert data into desired formats, such as pivoting and unpivoting data, to facilitate analysis and reporting.
Data Modeling: In Power BI, Power Query is used to create data models by loading and transforming data for interactive visualizations and insights.
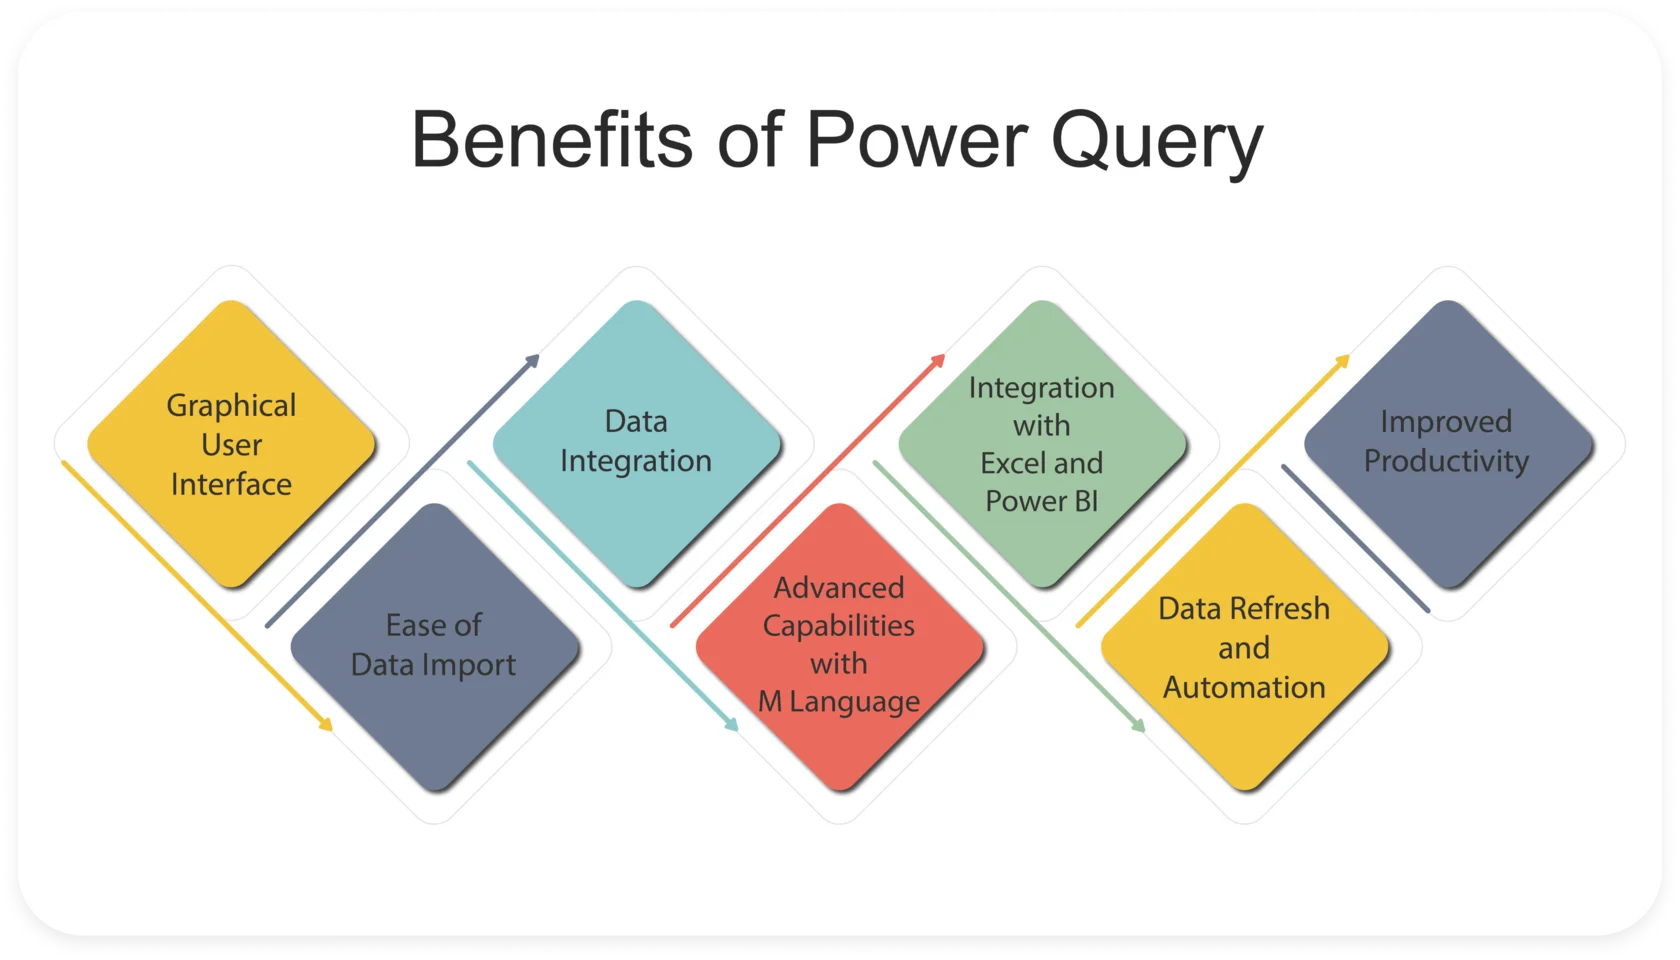
Power Query offers several benefits for data preparation and analysis:
Power Query features an intuitive graphical interface that allows users to interactively build and modify data transformation steps, making it accessible to users without extensive coding knowledge.
Power Query simplifies the process of importing data from various sources, including databases, files, web pages, and online services, without the need for manual data entry or copying and pasting.
Users can combine data from multiple sources into a single dataset, enabling comprehensive analysis and reporting across diverse data sets.
While primarily GUI-driven, Power Query also offers advanced users the ability to access and manipulate the underlying M language code, providing flexibility for more complex data transformation tasks.
Power Query seamlessly integrates with Excel and Power BI, enabling users to incorporate data preparation into their analysis workflows and build dynamic reports and dashboards.
Power Query allows users to schedule automatic data refreshes, ensuring that their analysis remains up-to-date with changes in the source data, making it ideal for dynamic data sources.
By streamlining data preparation tasks, Power Query helps users save time and effort, allowing them to focus on analyzing and deriving insights from their data.
Power Query operates through a series of interconnected components and functionalities, facilitating data acquisition, transformation, and preparation.
Power Query allows users to connect to various data sources such as databases, files, web pages, and online services. Users can initiate this process by selecting the "Get Data" option within Excel or Power BI.
Once data is retrieved, it's presented in the Power Query Editor. This interface enables users to visually inspect and manipulate the data through a series of intuitive tools and functionalities.
The heart of Power Query lies in its robust transformation engine. Users can perform a multitude of data transformations including cleaning, filtering, merging, pivoting, unpivoting, and more. They can be applied sequentially through a graphical user interface.
Dataflows are a feature within Power Query that allows users to build, manage, and share reusable data preparation logic. This enhances collaboration and ensures consistency across multiple data sources and reports.
Power Query M is the underlying formula language used to define data transformation steps within Power Query. While users primarily interact with the graphical interface, they can also access and modify the M code directly, providing advanced customization and automation capabilities.
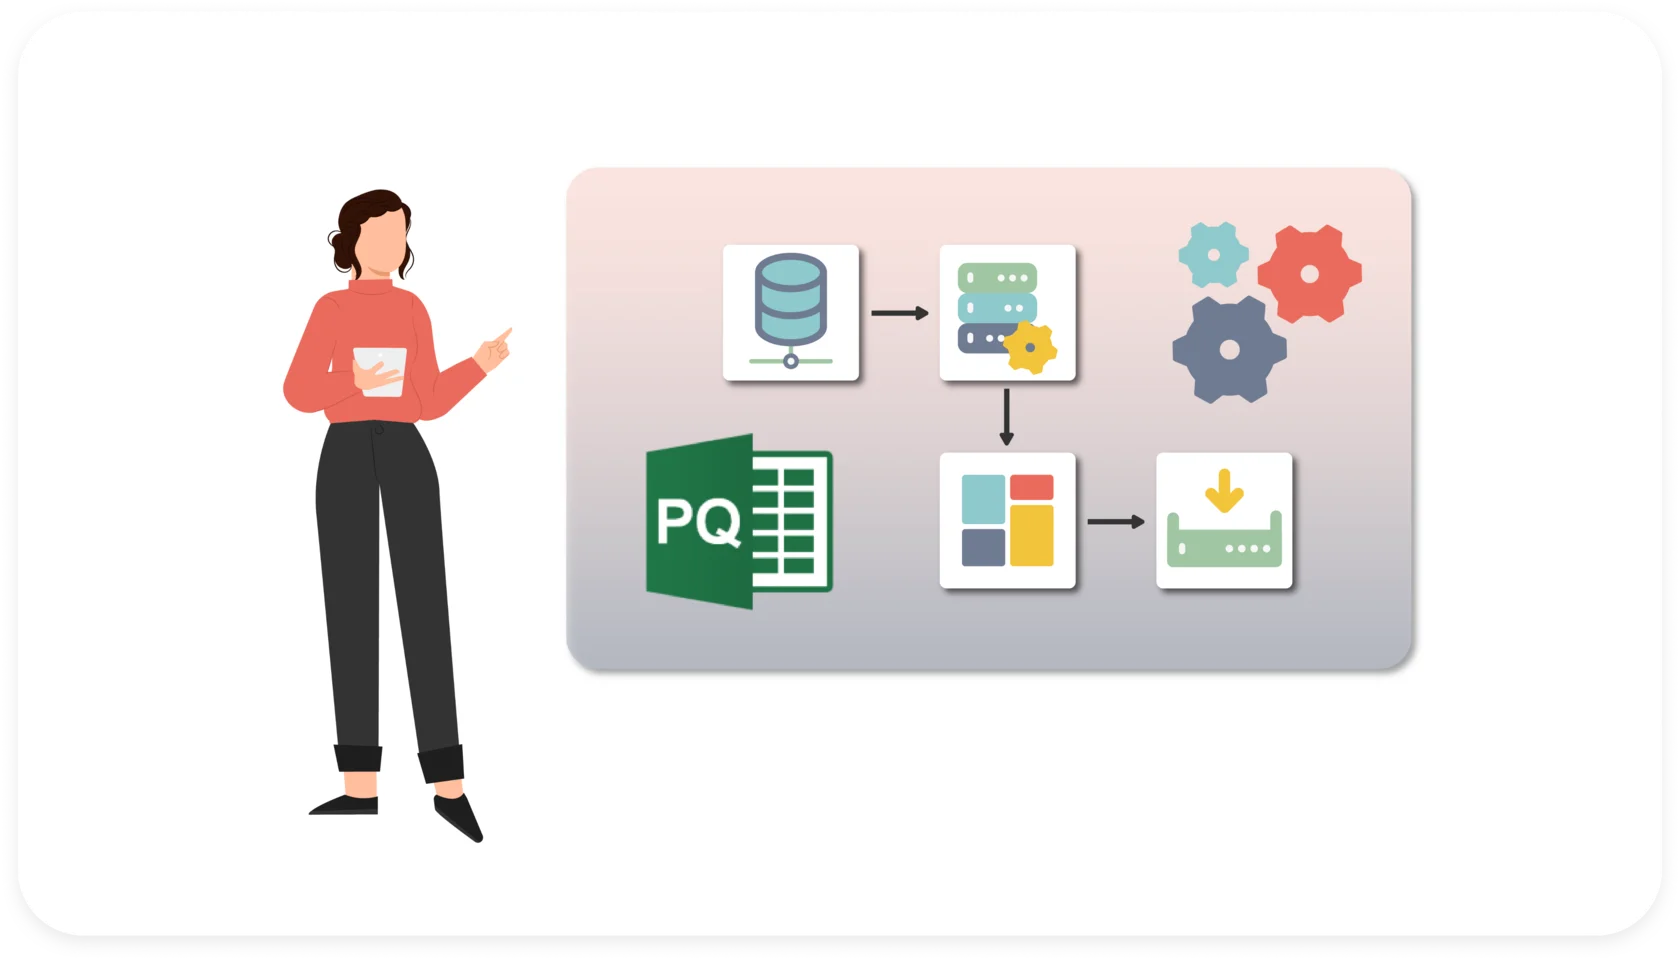
So how to use Power Query to benefit from it? There are several steps to import, transform, and load data into your analysis environment:
Power Query serves as the gateway for users to access and import data from a diverse array of sources into their analysis environment. Users can seamlessly establish connections to various data repositories including databases, files, web pages, and online services. This functionality helps to initiate data retrieval processes effortlessly, eliminating the need for manual data entry or complex coding. Moreover, with an extensive library of connectors, users can conveniently access and integrate data even from disparate sources, facilitating comprehensive analysis and reporting.
The functionality of the app offers a comprehensive suite of tools for data manipulation, enabling users to refine and shape their datasets with precision and efficiency. Within the Power Query Editor, users can access an array of transformation options, including but not limited to filtering rows, removing duplicates, renaming columns, splitting and merging data, pivoting and unpivoting tables, applying custom calculations using intuitive formulas, and even invoking complex transformations through the Power Query M formula language.
They can be applied step-by-step visually intuitively, allowing users to refine their data until, iteratively, it meets their exact requirements. In such a way, users can clean, reshape, and prepare their data for analysis with ease and accuracy to generate better decision-making and insights.
Power Query offers a powerful means of consolidating data from multiple sources into a unified dataset for analysis and reporting. It enables users to merge tables, append data from different files or folders, and perform sophisticated join operations to combine related data sets. With advanced options, users can easily specify join conditions, handle data mismatches, and customize the resulting merged dataset.
Loading is the final step in the data preparation process, allowing users to import the transformed dataset into their analysis environment, whether it be an Excel worksheet or a Power BI data model. Power Query provides unparalleled flexibility in choosing how the data will be loaded and offers various options for structuring and organizing the data, including specifying column headers, data types, and loading preferences.
Users can configure settings for data refreshing, ensuring that their analysis remains up-to-date with changes in the source data over time. Additionally, making changes to the queries after loading the data is possible.

Power Query functionalities can be found in a variety of Microsoft products, but Microsoft Excel and Power BI are the most common tools to deal with them. In both Excel and Power BI, Power Query provides similar functionalities for data preparation and transformation, making it easier for users to work with their data regardless of their platform.
So, what is Excel Power Query? In Excel, the service is available as an add-in. Where to find power query in Excel? Depending on your Excel version, you can access Power Query by going to the "Data" tab and then clicking on "Get Data" or "From Table/Range". From there, you'll see options to connect to various data sources and start using Power Query to import and transform your data.
Power Query is an integrated component of Power BI. When building reports or dashboards in Power BI Desktop, you can access Power Query by selecting the "Home" tab and clicking on "Transform Data." It opens the Power Query Editor, where you can perform data transformations and prepare your data for visualization, as mentioned in the sections above
The biggest value of Power Query in Power BI is the robust data integration possibilities through the connectors. There is an extensive array of data connectors, covering various data sources from TXT, CSV, and Excel files to databases like Microsoft SQL Server, as well as popular SaaS platforms such as Salesforce.
For example, with Alpha Serve’s Power BI Connectors, users can effortlessly integrate data from Jira, Zendesk, ServiceNow, Shopify, monday.com, and QuickBooks into their Power BI reports, avoiding Power Query limitations. This allows for a holistic view of business performance by combining project management metrics from Jira, customer support data from Zendesk, service management data from ServiceNow, sales data from Shopify, task tracking data from monday.com, and financial data from QuickBooks
By leveraging Power Query's data preparation and transformation capabilities, users can clean, transform, and blend this diverse dataset to derive actionable insights and drive strategic decision-making. Those can be useful for tracking project progress, monitoring customer satisfaction, managing service requests, analyzing sales performance, tracking task completion rates, or monitoring financial metrics. In other words, Power BI connectors empower users to harness the full potential of their data for more effective business analysis and reporting.
Power Query offers powerful capabilities for data preparation and transformation. To make the most of this tool, it's essential to follow best practices to ensure your data workflows' efficiency, maintainability, and reliability. Here are some Power Query best practices:
Plan your data model: Before starting, clearly understand your data model requirements. Define the relationships between different data sources and plan how you'll structure your data for analysis. Use data profiling tools to uncover details of your data.
Do expensive operations last: Performing streaming operations, like filters, early in your Power Query sequence is beneficial as they don't require reading the entire dataset before returning results, resulting in faster previews. Conversely, operations like sorts may necessitate reading the whole dataset, potentially causing slower previews; hence, executing expensive operations toward the end of the query is advisable to optimize preview rendering time.
Use query dependencies: Break down complex data preparation tasks into smaller, manageable queries. Create separate queries for data loading, cleaning, transformation, and merging. This modular approach improves query readability and simplifies troubleshooting.
Document your queries: Use comments within your queries to document each step and provide context for future users or yourself. Clear documentation helps understand the purpose of each transformation and facilitates collaboration.
Parameterize your queries: Parameterize your queries to make them more flexible and reusable. Use parameters for values that may change frequently, such as file paths or date ranges. It simplifies maintenance and allows for more accessible adaptation to changing data sources.
Use native query steps: Whenever possible, leverage the built-in transformation functions and features provided by Power Query. Native query steps are optimized for performance and reliability, ensuring efficient data processing.
Optimize query performance: Avoid unnecessary data loading and processing. Minimize the number of rows and columns loaded into memory by filtering data early in the transformation process. Use techniques like query folding to push data processing back to the data source whenever feasible.
Handle errors gracefully: Implement error-handling mechanisms to deal with potential data issues. Use try, otherwise constructs to catch and handle errors during data loading and transformation. Consider logging error messages for troubleshooting purposes.
Promote reusability: Create reusable functions and custom transformations for common data preparation tasks. Encapsulate frequently used logic into functions that can be easily applied across multiple queries, improving productivity and consistency.
Test rigorously: Test your queries thoroughly with sample datasets to ensure they produce the expected results. Verify the accuracy of data transformations, edge cases, and error-handling scenarios. Consider creating automated tests to validate query behavior over time.
Monitor data refreshes: Regularly monitor data refresh operations to detect any issues or anomalies. Check data refresh logs for errors or warnings and investigate any unexpected behavior promptly. Ensure that scheduled refreshes are running as expected.
Power Query offers a robust toolkit enabling users to efficiently import, clean, transform, and integrate data from diverse sources, catering to the needs of data analysts, business users, and anyone involved in data analysis and reporting. Its user-friendly interface, potent transformation engine, and seamless integration with Microsoft products make it indispensable for professionals in the data realm. Additionally, integrating data into Power BI reports via various connectors unlocks many project management insights and metrics directly within the Power BI environment, facilitating comprehensive analysis across multiple domains.
Ready to enhance your data analysis workflow? Experience the power of Power Query in Power BI with Alpha Serve’s connectors today and unleash the full potential of your business data!
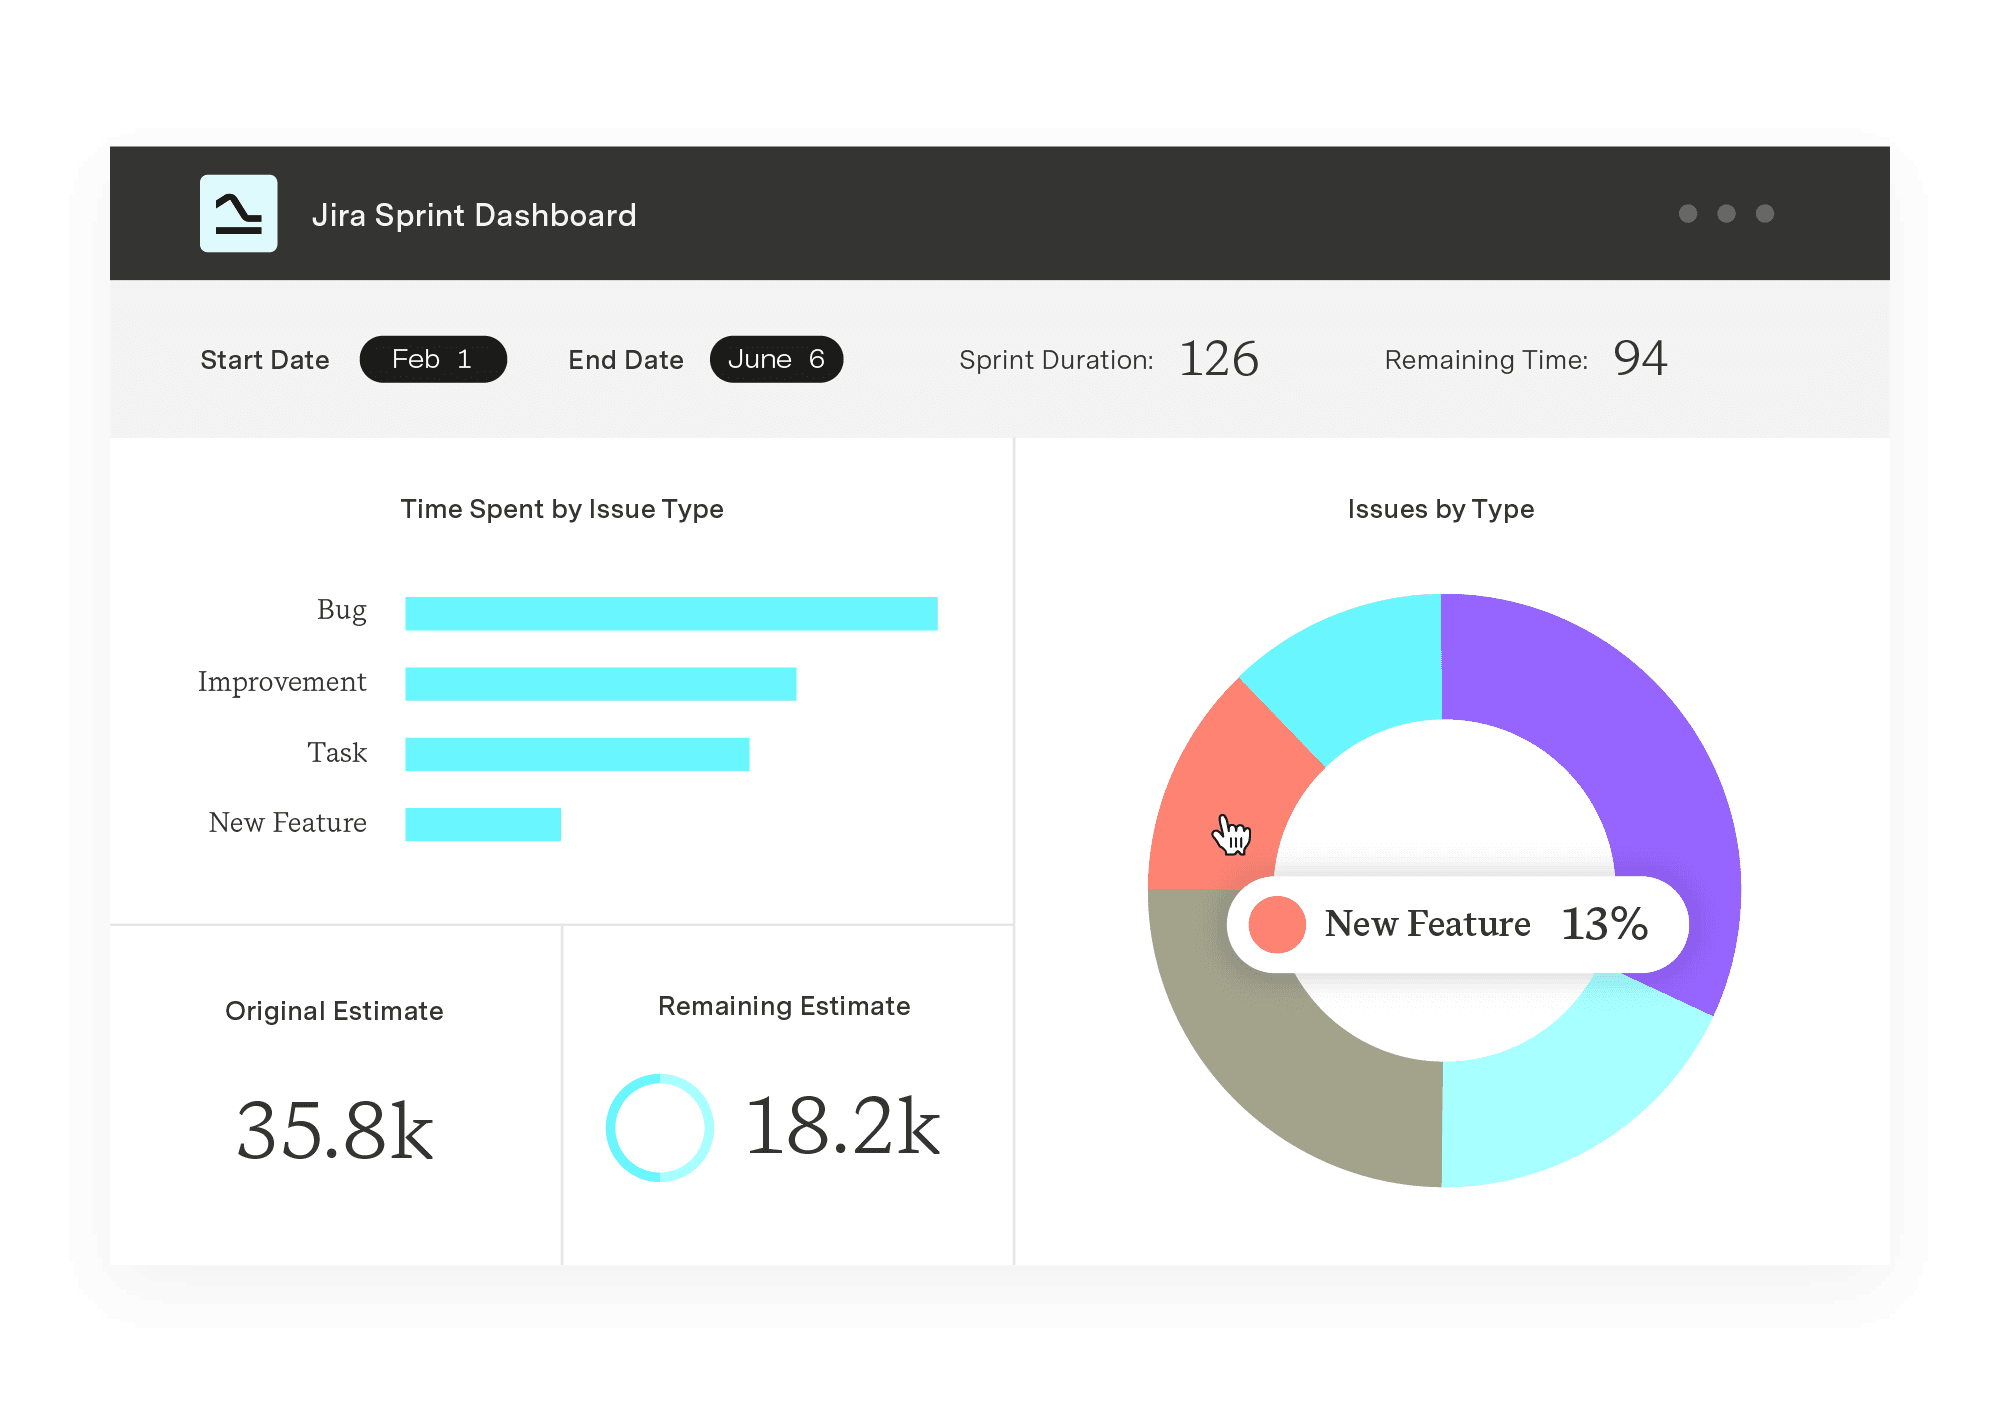
Power BI Connector for Jira
Experience a new standard in data integration and reporting. Enjoy quick setup, effortless data export from all Jira products and third-party apps, and instant access to pre-built templates.
Start a Free TrialOptimize work processes and produce superior project outcomes by learning to nurture a work environment that supports effective team collaboration.

Say goodbye to dull reports and presentations filled with spreadsheet tables. Reporting with Jira visualizations brings data to life.

Do some of your teams use Confluence but not Jira? Find options for getting Jira reports into Confluence & keeping these teams in the loop.

We look at using Atlassian’s Confluence for enterprise collaboration, along with everything you need to get started sharing in Confluence.

A gap analysis can help your company determine what actions to take for improvement. Bring your practices from average to the next level of success.

Learn how to use Rich Filters for Jira Dashboards to be able to quickly filter your dashboards by Tempo Accounts and Tempo Teams.
Learn what an affinity diagram is, how to create one, and how it helps teams organize ideas and turn insights into action.

Great products have great design. PMs need to understand and speak the language of designers. We’ve uncovered what designers wish you knew.

Explore the main differences between convergent versus divergent thinking and learn when to use each for better creativity and problem solving.