Learn about the Ivy Lee method, a proven productivity technique that helps you prioritize tasks, sharpen your focus, and accomplish more each day.

With a significant volume of data generated today, every business that wants to obtain results from data is faced with a great challenge, and here comes Power BI AI. Nowadays, Artificial Intelligence is the center of dynamics of business management and is used in different activities: to explore and filter data, find trends and patterns, understand the meaning of data, find anomalies, and even predict future events.
Power BI AI comes with visual and functional capabilities, so the company can gain significant advantages when employees can leverage it. This article provides an overview of AI features available in Power BI and their benefits and describes how to use AI insights.

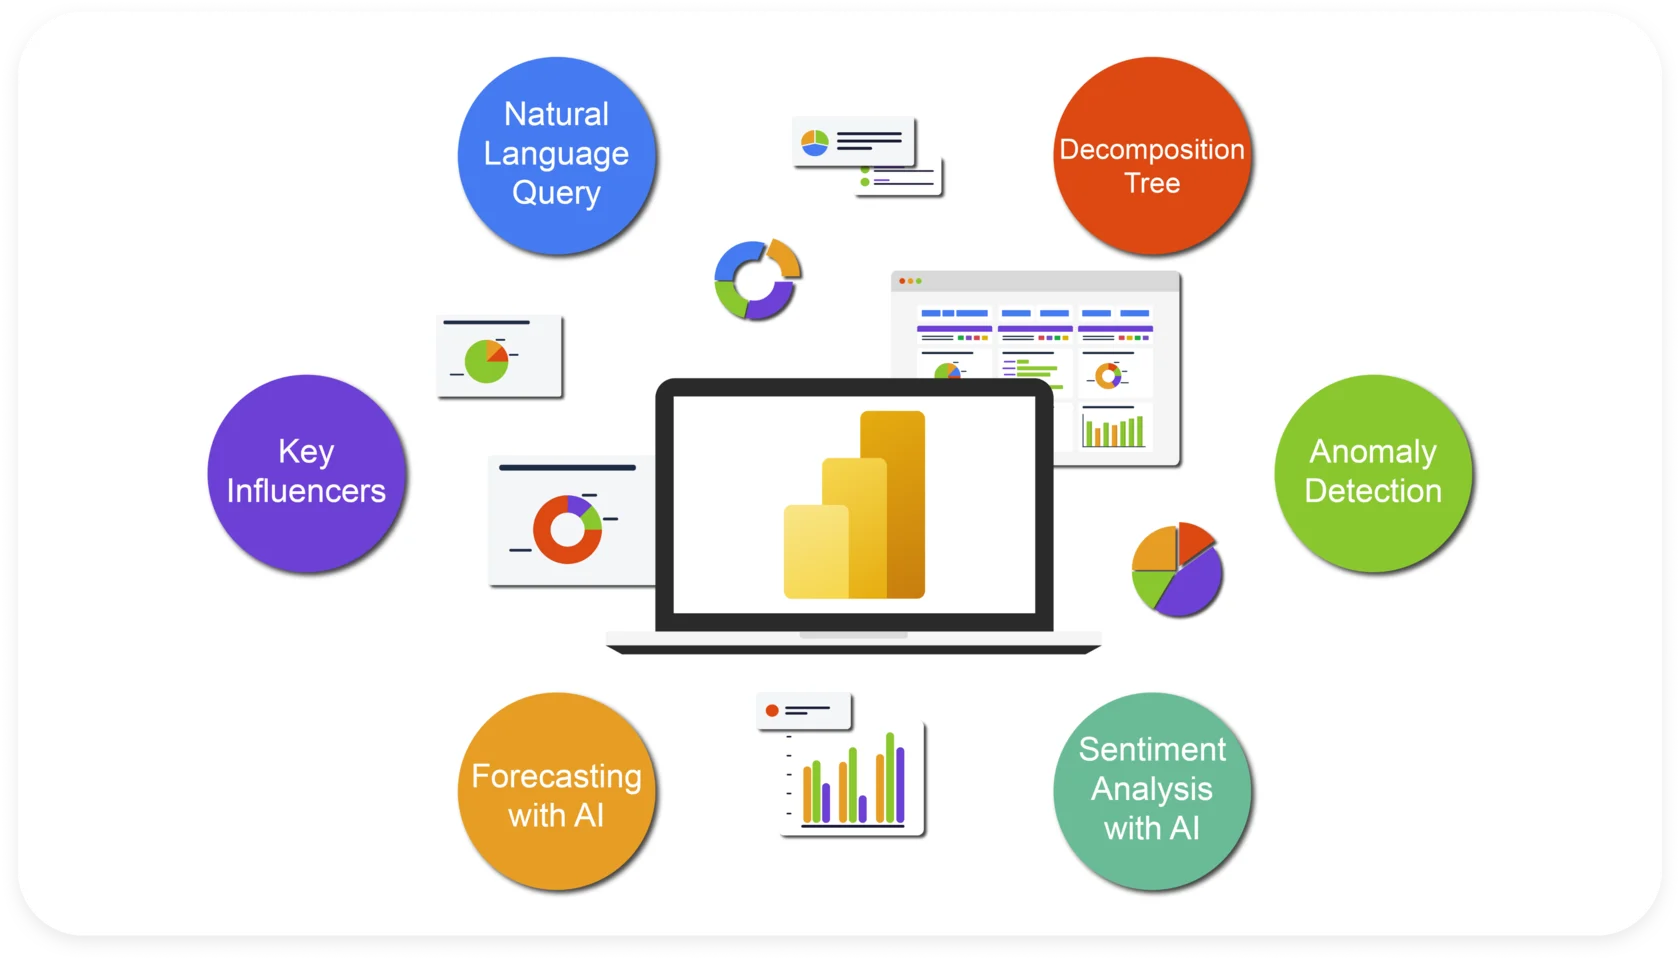
Artificial intelligence is revolutionizing businesses globally, and Power BI stands at the forefront of integrating AI into business software. It enables the auto-generation of dashboards, the creation of advanced visualizations, and data analysis using sophisticated algorithms within a single platform, offering extensive interactive opportunities for users and companies alike, thereby enriching BI functionality. Among the notable Power BI AI features are Key Influencers, Decomposition Tree, Natural Language Query, Anomaly Detection, Sentiment Analysis, and Forecasting.
Natural Language Query (NLQ) instantly matches user-typed words with relevant database information, providing prompt results. In Power BI, NLQ is augmented with AI and machine learning models, enabling non-technical users to analyze and explore their data, thereby examining metrics effortlessly. Users can directly query the system, review data, uncover insights, gain a comprehensive Power BI text analytics overview, and receive relevant answers. This information is stored in memory and freely accessible to all users.
Before inputting a query, Power BI offers relevant suggestions to aid in formulating questions or selecting options, enhancing the productivity of searches. The system indicates its recognition of natural language words through customizable underlines: blue for known words, red for ambiguous words, and orange for unknown words. Results are immediate, and users can select their preferred visualization type, including line charts, tables, cards, matrices, or maps.
Anomaly Detection in the Power BI feature empowers report creators to automatically detect irregularities in time series data with customized settings, enhancing line charts without slicing data. Published reports showcase anomalies, explanations, and root cause analyses, visible both in the Power BI Desktop and the Power BI service. Anomalies can be formatted and configured based on the algorithm's sensitivity. In addition to identifying spikes and dips in the data, users can access explanations through the insights pane. When selecting an anomaly, Power BI artificial intelligence analyzes the data model fields to provide a natural language explanation and ranks factors by explanatory power.
Moreover, this feature is now available in Power BI mobile apps. When anomaly detection is enabled for a report view, users can directly identify unexpected spikes or dips caused by anomalies on their mobile devices. However, there are limitations, as this functionality is supported only for line chart visuals with time series data in the Axis field, necessitating a minimum of four data points.
Key Influencers are one of the first Power BI AI visuals. This powerful tool helps analyze data, classify the factors, and display them as key influencers. As different factors can influence metrics like revenue, product sales, or customer churn rates, this feature lets users understand what factors condition a metric was evaluated. It can be used to get insights from data by analyzing the relationships between numerous variables and identifying which one is associated with a specific outcome.
To find Key Influencers, one should create a new report page, include the Key Influencers visual, choose the target variable to analyze, and other variables to include. Once the visual has been created with the help of machine learning algorithms, it will display a list of the most critical drivers affecting the target indicator. The results are displayed as a list of maps representing an explanatory variable. A list of scores also indicates the strength of this Power BI AI visual. A graph also shows the relationship between the target variable and each explanatory variable, but it’s important to remember that the Key Influencers visually analyzes only linear relationships between variables.
The Power BI Decomposition Tree is a new AI in BI visualization that lets you break down data based on multiple analysis dimensions and determines the sum, high, and low values. It provides an interactive interface that helps to analyze data quickly and publish or export reports faster. The drill-down technique offers detailed data and analysis of root causes, finding patterns and trends faster. A decomposition tree is used when the data is settled at different levels, when they must be put in a particular hierarchy, or when one needs to drill into data fields.
The key elements of the Power BI Decomposition Tree chart are root value, branches, and percentage distribution. It can analyze one value by one or different dimensions. It supports conditional shaping of nodes with various colors and customization, sorting and cross-illumination, advanced filtering, and keyboard combinations. When testing multiple dimensions of a decomposition tree or extracting data, one can use drill-down to find the hierarchy and dataset of interest. It can appear technical, but it's a very intuitive and easy-to-use feature of Microsoft Power BI.
Companies perform sentiment analysis on texts such as customer feedback on brands/products to understand their opinions better. It uses natural language processing to determine the polarity of the opinion, such as positive, negative, or neutral. It is also helpful for extracting and analyzing emotions such as anger, happiness, sadness, etc.
Power BI sentiment analysis is also used to understand a task's importance or urgency and gauge a group's or individual's interest in something. Data scientists and data modeling experts can design sentiment analysis according to their needs. It can be delineated to check if the customer is interested in some product and show if one intends to purchase. Sentiment analysis is designed to extract and understand emotions. In this particular case, the text analytics Power BI is critical. However, the substantial use of dictionaries can present a disadvantage, as the same set of words can have opposite meanings based on the culture and context in which they are used.
Forecasting with Power BI and AI provides dynamic reference lines to visuals. It shows important trends and insights while analyzing time-series, real-time, and cross-sourced data to identify tendencies, correlations, and patterns that can impact market behavior. Predictive analytics plays a crucial role as analyzed historical data shows the possibility of studying buying behavior and predicting events that can influence customer insights AI.
AI in BI enables more accurate and reliable forecasts by using machine learning algorithms to continuously adjust and improve forecasts based on newly acquired data, analyze complex and non-linear data, and identify abnormal fluctuations and seasonal patterns that may escape the human eye. The analysis methods that help anticipate changes and plan effectively are time-based analysis, quantitative vs. qualitative, projections vs. insights, and future-oriented and statistical methods. Data-driven forecasting can be used to analyze different aspects of everyday operations, such as finances, personnel, manufacturing, demand, and sales. The forecasting features are available only for line chart visuals.
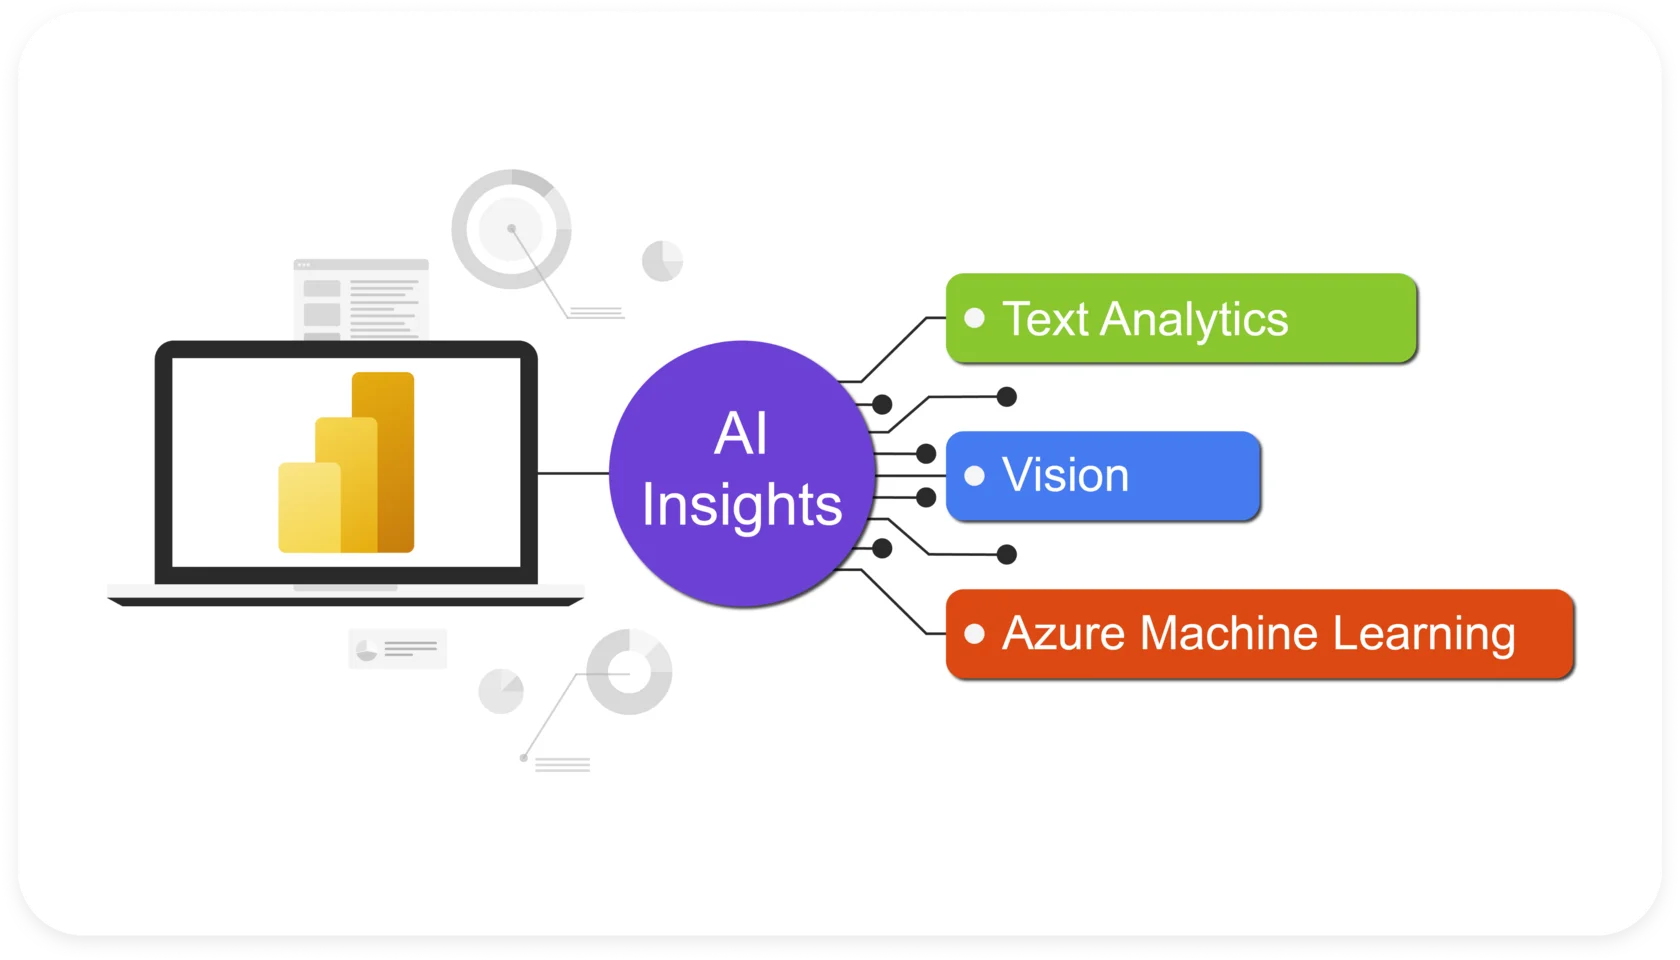
The AI in Power BI is a gateway to a wealth of pre-trained machine learning models, enabling users to augment their data preparation processes with advanced analytics. These insights are accessible directly within the Power Query Editor, allowing users to explore and leverage AI capabilities without leaving their familiar BI environment. Within the Power Query Editor, users can navigate to the Home and Add Column tabs to access AI features, including Text Analytics and Vision functions powered by Azure Cognitive Services and custom functions from Azure Machine Learning.
Text Analytics and Vision functions in Power BI enable users to perform various tasks, such as sentiment analysis, key phrase extraction, language detection, and image tagging, without needing a separate subscription to Azure Cognitive Services. By leveraging these capabilities, users can gain deeper insights into their data, uncovering valuable information that may have remained hidden. From analyzing customer sentiment to identifying visual patterns in images, AI in Power BI empowers users to extract meaningful AI insights from their data quickly and efficiently.
However, it's important to note that certain AI features, such as Text Analytics and Vision, are exclusively available in Power BI Premium capacities. It ensures that users can access the necessary resources and computational power to execute complex AI algorithms effectively. By leveraging Premium features, users can optimize performance and scalability while harnessing the full potential of AI for Power BI.
Furthermore, Azure Machine Learning integration expands the capabilities of AI in Power BI, enabling users to incorporate predictive analytics and advanced modeling into their BI workflows. With Azure Machine Learning, users can access various machine learning models and algorithms, empowering them to make accurate forecasts and predictions based on historical data. By seamlessly integrating Azure Machine Learning models into Power BI, users can democratize access to advanced analytics and distribute valuable insights across their organization.

The integration of Artificial Intelligence (AI) into Business Intelligence (BI) systems presents an array of profound advantages, facilitating the utilization of advanced algorithms and computational methodologies to meticulously analyze extensive datasets, derive actionable insights, and effectively inform decision-making processes within organizational contexts.
AI in Power BI learns from user interactions, transforming them into data experts and analyzing user behavior and questions during BI tool interactions to better understand their needs. It empowers business users to access clear and comprehensible AI insights within their domain, even without an IT background.
With the Natural Language Interface, AI in Power BI enables users to ask questions and receive answers in natural language. Leveraging these interactions, AI tailors and personalizes data insights and provides suggested visualizations, dashboards, and other easily understandable metrics. The system streamlines data analysis by automating data cleansing and preparation tasks.
AI-powered Power BI delivers improved accuracy and offers mature platform capabilities. Report creation becomes more engaging as users can effortlessly create data dashboards and share them among colleagues. Additionally, the platform facilitates data organization with editable and customizable pivot tables, enhancing overall efficiency.
Thanks to the Power BI community spread worldwide, it receives new ideas every day to improve and become more efficient. The migration of businesses to online and new technologies such as adaptable AI has made and will continue to make data analysis more accessible and precise for planning future strategies. Here, we’ve outlined some of the AI features in Power BI, but many others are on the way, and both developers and users can use them to facilitate their work and take advantage of advanced visuals. Undoubtedly, Artificial Intelligence will become an integral part of everyday life. Start benefiting from it right now using Power BI AI features.
Power BI Connector for Jira
Experience a new standard in data integration and reporting. Enjoy quick setup, effortless data export from all Jira products and third-party apps, and instant access to pre-built templates.
Start a Free TrialLearn about the Ivy Lee method, a proven productivity technique that helps you prioritize tasks, sharpen your focus, and accomplish more each day.

Learn what portfolio reporting contains, report types by audience, why cycles break, and how continuous reporting changes the executive conversation.

Everybody gets the same 24 hours per day to achieve whatever they put their mind to. Once it’s lost, time can no longer be used.

Not every delayed dependency is a program risk. Learn the 4 conditions that trigger escalation, and spot exposure before it reaches leadership.

Effective resource utilization will optimize your team’s productivity and efficiency. What’s more it will increase morale and improve your bottom line

Measure how long Jira issues take to close, broken down by status. The resolution time report turns workflow drift into a number you can act on.

Leverage critical path project management to keep your team on schedule. With CPM, you’ll effectively schedule crucial tasks for successful delivery.

Learn about project demand management and how it balances resources with project requests to maximize value and achieve strategic business goals.

Discover what business process reengineering is and how it can help you scale your team, improve business operations, and increase productivity.