A simple guide to understanding qualitative vs. quantitative data
Numbers tell one story, and words tell another.
That’s the key difference in quantitative vs. qualitative data. Quantitative data gives you measurable numbers to analyze and compare, while qualitative data reveals the story behind the numbers. Together, they provide a complete picture, helping you make smarter project decisions and guide your team with confidence.
Here, we’ll explore what each type of data looks like and weigh its pros and cons. This way, you can better collect, interpret, and use data to drive meaningful outcomes.
What is quantitative data?
Quantitative data focuses on numbers you can measure, count, and track. This information gives you a clear view of trends and performance. Quantitative data shows how much, how many, or how often something occurs – turning observations into facts you can act on.
Teams gather this data through closed-ended surveys, experiments, A/B testing, structured observations, and analysis of existing data sets. Use it to test hypotheses and run statistical analysis to draw objective conclusions. For example, tools like a perceptual map rely on quantitative data to visually compare how customers perceive different products or brands in terms of price or features.
Here are a few quantitative data examples you might encounter:
Number of tasks completed in a project sprint
Customer satisfaction ratings on a scale of 1–10
Website traffic or conversion rates
Sales figures and revenue growth
Using quantitative data lets you measure improvements and compare results across teams or projects. Pair it with qualitative insights, and you get both the numbers and the story behind them – a holistic view to make better decisions and better understand your audience.
What is qualitative data?
Qualitative data is descriptive, non-numeric information that captures behaviors, opinions, and experiences. Instead of focusing on measurements, this data gives context, showing you the motivations and feelings behind decisions and actions.
You can gather qualitative data through interviews, open-ended surveys, focus groups, and field observations. These approaches let you uncover patterns, further meaningful insights, and interpret the “why” behind results in a way that quantitative research alone can’t.
How to turn time, cost, and capacity data into a decision engine
Access the guideSome qualitative data examples include customer feedback and employee interviews. Doing qualitative data analysis on this information helps you identify trends, answer research questions, and draw conclusions that give projects real depth, especially when used alongside quantitative research.
Main differences in qualitative vs. quantitative data
Knowing the difference between qualitative and quantitative data sharpens your product sense, helping you turn insights into impact for your project and users.
Here’s how to spot the distinction – and why they matter.
1. Type of information
Qualitative data comes in words, images, or audio; it’s full of detail and context, but it doesn’t follow a set structure. Quantitative data, by contrast, is all about numbers or variables that you can measure and compare. Think of it this way: Qualitative data tells the story, while quantitative data shows the scale.
Qualitative data answers questions like “Why did this happen?” or “How do people feel about it?” Qualitative data, in contrast, focuses on how many, how often, or how much.
You might ask your team why a project milestone was delayed (qualitative) but also track exactly how many days it slipped (quantitative). Both give you important insights, just from different angles.
2. How you collect it
You can collect qualitative data through interviews, open-ended surveys, case studies, observations, diary studies, focus groups, and analyses of other written or visual materials. These methods let you explore insights in depth and capture context that numbers alone can’t show. For example, comments might reveal pain points during a needs assessment with your team.
Quantitative data, meanwhile, comes from structured surveys or analytics tools. It gives values you can track and compare, helping you validate assumptions from qualitative research and back them up with hard numbers. For instance, after uncovering a pain point, you could run a survey to see how many people experienced these issues.
3. How you analyze it
Analyzing qualitative data means identifying patterns, themes, and insights that reveal the reasons behind behaviors. Quantitative data relies on statistics – averages and correlations – to give objective results that you can generalize across a population.
4. Sample size
Qualitative research works well with smaller groups because the focus is on depth rather than breadth. Quantitative research, on the other hand, usually needs larger samples to ensure the numbers are reliable and representative.
5. Perspective
Qualitative data reflects feelings, opinions, and experiences, so it’s inherently subjective. Quantitative data reports hard numbers, showing what actually happens. One gives you insight into the human side while the other offers clarity and consistency.
6. Flexibility
Quantitative methods stick to a fixed structure, making comparisons easier but limiting your exploration of unexpected answers. Qualitative methods let you follow interesting leads and dig deeper when something surprising comes up.
7. Timing
Collecting qualitative data takes longer because you’re talking to people, running interviews, or observing behaviors. That extra time pays off when you’re shaping something like a risk management plan, where context and human perspective help you anticipate issues before they escalate.
Quantitative data comes in much faster. Surveys and analytics give you quick numbers you can act on, which is perfect when you need to make timely decisions or adjust resources mid-project.
Pros and cons of qualitative and quantitative data
Both qualitative and quantitative data bring something valuable to the table, but each also has its downsides.
Qualitative data
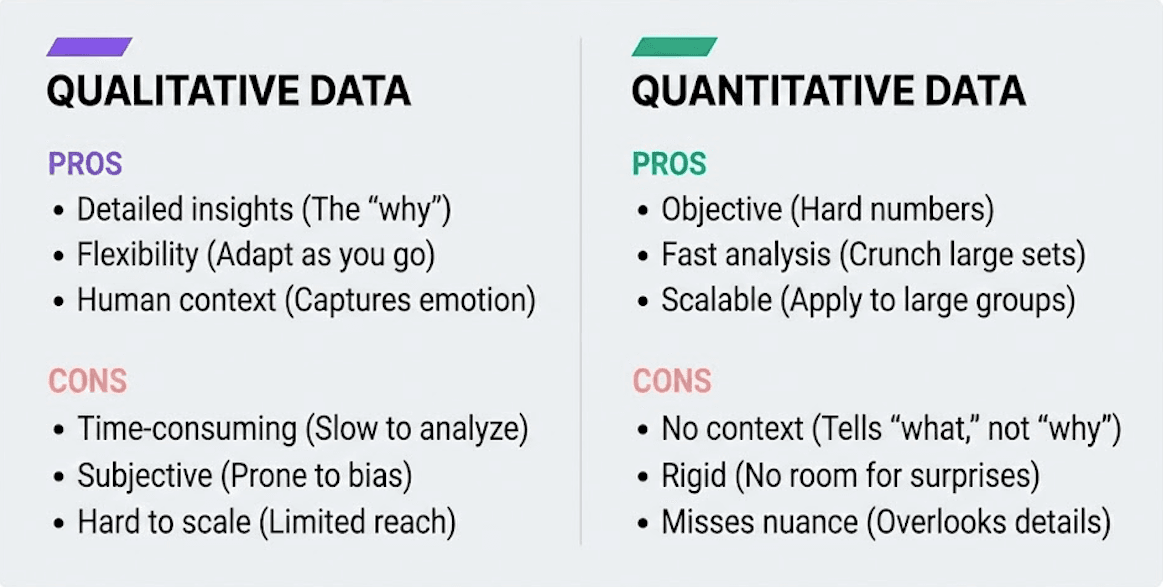
Pros
Detailed insights: You get the stories behind the numbers – the “why” and “how” that explain behaviors.
Flexibility: You can adjust as you go, asking follow-up questions or digging deeper when something unexpected comes up.
Context and meaning: It gives you the bigger picture, not just surface-level results.
Human perspective: You hear real voices, emotions, and motivations that numbers alone can’t show.
Cons
Time-consuming: Interviews, focus groups, and observations take longer to run and analyze.
Subjective: Because it depends on interpretation, personal bias can slip in.
Smaller scale: It’s hard to collect from large groups, so results may not represent everyone.
Harder to compare: Because it’s descriptive, it doesn’t always translate into measurable, trackable metrics.
Quantitative data
Pros
Objective and reliable: Hard numbers don’t lie. They give you solid evidence.
Fast analysis: With the right tools, you can crunch large data sets quickly.
Clear metrics: This data is perfect for tracking performance, spotting trends, or measuring progress over time.
Scalable: Quantitative methods work well when you need results that apply to a larger group.
Cons
No context: It tells you what happened, but not why it happened.
Rigid structure: Surveys and experiments don’t leave much room for surprises.
Misses subtle details: Numbers can overlook emotions, motivations, or lived experiences that inform outcomes.
Easy to misinterpret: Without qualitative context, the raw figures can be misleading.For example, a sudden dip in productivity might look alarming in the numbers but could easily be explained by a planned project contingency, like scheduled downtime or a temporary reallocation of resources.
Analyzing project data with Tempo
Good decisions come from seeing both sides of the story, with the numbers and the context behind them. Tempo helps you do exactly that inside Jira.
With Tempo Timesheets, you get accurate, measurable data on time, effort, and resources. You can see where projects are on track and where they’re falling behind. Add Tempo’s BI Connectors, and you can blend that data with business intelligence tools or even align it with your OKR templates to measure outcomes against strategic goals. The result is a complete picture that helps you make smarter, faster decisions.
Try Tempo today to see how easy it is to turn project data into clarity and action.