Lead time vs. cycle time: Why both matter
Tempo Team
How long should it take for a task to move from request to delivery? The concepts lead time versus cycle time help teams respond to that question with data, because when teams miss deadlines or struggle to forecast their workflow, it’s often because no one’s tracking where the time goes.
When a backlog builds up or an approval stalls, understanding lead and cycle time lets teams separate waiting from doing, so they can fix the right problems and forecast with confidence.
What’s lead time?
Lead time is the time between a request and the final result. It includes everything from when someone asks for a feature to when that request is completed and handed off.
This includes the time spent actively working on the task, as well as the time it sits in a queue, waits for approval, or gets delayed for any reason. If a task is requested on Monday and delivered on Friday, the lead time is five days, even if no one touched it for the first three.
From the customer’s perspective, lead time measures the time they wait for something to get done. From the industries’ perspective, lead time refers to the total period from placing an order to receiving goods, a metric that’s essential to know in order to manage inventory and delivery expectations.
What’s cycle time?
Cycle time refers to how long a task spends in active progress, from when someone starts working on it to when it’s completed. It doesn’t include the time a task spends waiting in a backlog or paused in review; it only covers the hands-on portion of the work.
For example, if a developer picks up a ticket on Wednesday and finishes it by Friday, the cycle time is three days, even if a manager created the task two weeks earlier.
Cycle time has long been used to track production speed in manufacturing. Toyota’s production system, for instance, relies heavily on reducing cycle time to improve assembly line efficiency. In software development, cycle time can reveal how fast teams can ship working code once they start.
For a business team, cycle time might apply to how long it takes a marketing department to create and publish a blog post after writing begins, or how long it takes customer support to resolve a ticket after opening it. Shorter cycle times usually mean your team is moving efficiently through the work. Long ones can signal unclear requirements or frequent context switching.
Lead time vs. cycle time
Metric | Definition | Starts When | Ends When |
Lead Time | Total time from request to delivery | A request is submitted | The item is delivered |
Cycle Time | Time spent actively working on a task | Work begins | Work is completed |
Understanding the difference between lead time and cycle time helps teams target the right areas for process improvement, rather than wasting effort on the wrong fixes.
Cycle time is always equal to or shorter than lead time. If your lead time is long but your cycle time is short, your problem likely lies in slow resource allocation or review processes. If both are long, your team may be overloaded or have systemic inefficiencies.
Together, these two metrics give you a complete picture. Lead time shows you the total task life, while cycle time shows how efficiently your team handles tasks once they’re in progress. These metrics can help identify delays and improve planning accuracy when used side by side.
It’s worth distinguishing throughput versus cycle time as well, since it’s often used in this context. Throughput measures overall output, while cycle time refers to how long each item takes to complete.
The importance of lead time and cycle time
Tracking lead time and cycle time shows teams how work moves through their system and where it slows down. A long lead time might point to backlog prioritization issues or communication gaps between teams. If requests sit idle for days or weeks before anyone picks them up, the problem isn't how the team works, it's how work is scheduled or passed along.
A long cycle time suggests something is slowing down execution. This could be due to unclear requirements, too much context switching, rework, or overloaded team members.
If teams monitor both metrics, they can tell whether delays happen before work starts or while it’s underway. For example, a product team could think their developers are too slow because features take weeks to ship. But if cycle time data shows the actual build only takes a few days, the real issue may be planning, not execution.
Improving lead time helps stakeholders get results faster, and improving cycle time boosts team productivity, but you need both to make reliable forecasts and deliver consistently. This kind of visibility also helps with Agile implementation, where knowing exactly where tasks slow down aids continuous improvement.
Improve workflow visibility with Tempo
To improve lead time and cycle time, teams need visibility into where time is spent. Tempo provides tools inside Jira that make it easier to monitor these timelines and spot delays as soon as they occur.
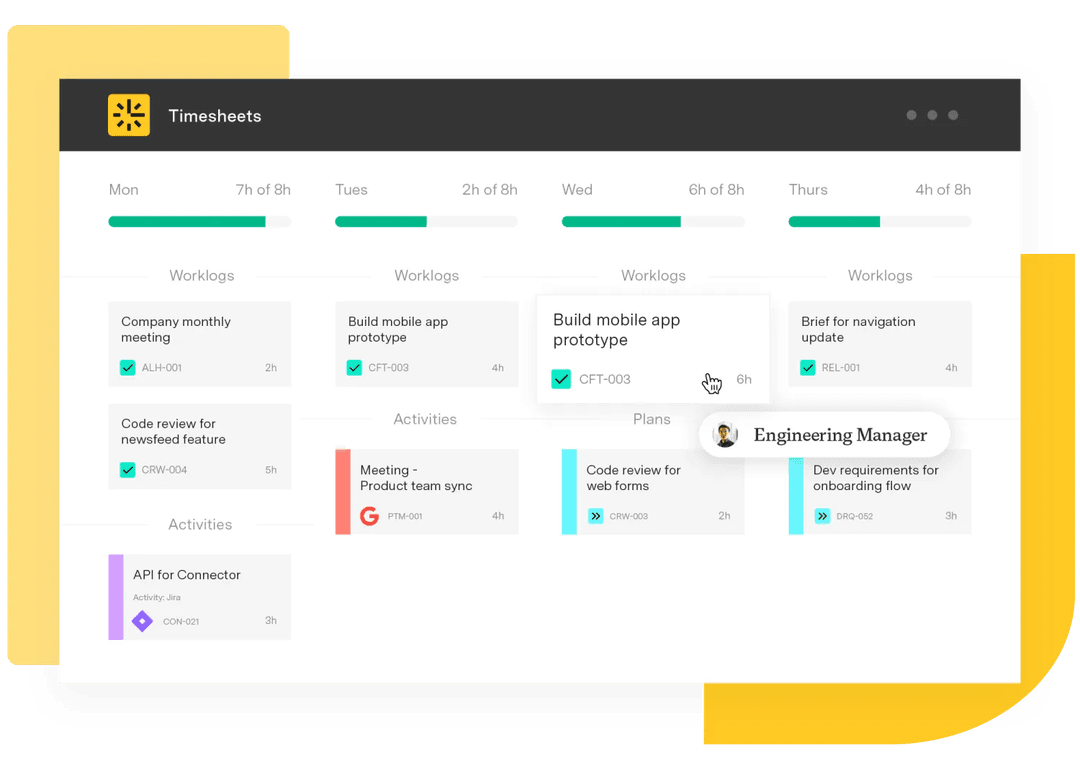
Using Timesheets, teams can track how long tasks take across projects. Because the data is tied directly to Jira issues, it reflects actual workflow specs.
Custom Charts for Jira add another layer of insight by turning raw data into visual dashboards. Teams can chart lead time and cycle time trends across projects, and break those down by assignee, issue type, or status. That makes it easier to catch patterns, like certain issue types taking longer than others or stages where work tends to slow down.
Together, these tools align time tracking with delivery performance. Teams can see delays and make targeted changes to move work faster through request to delivery.