

We reveal why you just don't want or need a dedicated Jira time in status app to find bottlenecks. You want something like Custom Charts.
Learn to identify bottlenecks, reduce workflow inefficiencies, and boost team productivity with Jira’s time-in-status function and Tempo’s Charts.

Time is how managers measure progress, and tasks that drag on cut into both productivity and profit. Compressed timelines swing the other way, driving burnout and mistakes that damage customer satisfaction.
Project administrators and IT service management (ITSM) leads need a way to measure time spent on tasks so they can spot bottlenecks and improve how the team works. Jira's time-in-status feature does that. It tracks lead and cycle time for project tasks or ITSM tickets by workflow status.
Time-in-status is a reporting feature in Atlassian's Jira Cloud, Server, and Data Center that tracks how long an issue or ticket sits in a given workflow status, broken down by assignee, team, or project, and surfaces the result on your dashboard.
A Jira time-in-status report lets you monitor:
Completion time for specific tasks
The average time a ticket remains in one status before transitioning to the next
How long team members take to resolve an issue
Delays caused by roadblocks and bottlenecks
Cycle and lead times for specific issues
Time-in-status reports give managers a concrete view of where work stalls. They help teams:
Increase efficiency: Measuring time in status exposes the parts of a workflow causing delays, so managers can streamline the process and reallocate resources.
Track performance: Time-based metrics turn into actionable insights on team output and make it easier to tune the workflow.
Identify trends: Ongoing monitoring reveals patterns and recurring delays that hurt outcomes and customer satisfaction.
Improve transparency: Progress is visible to everyone, which encourages ownership of the work.
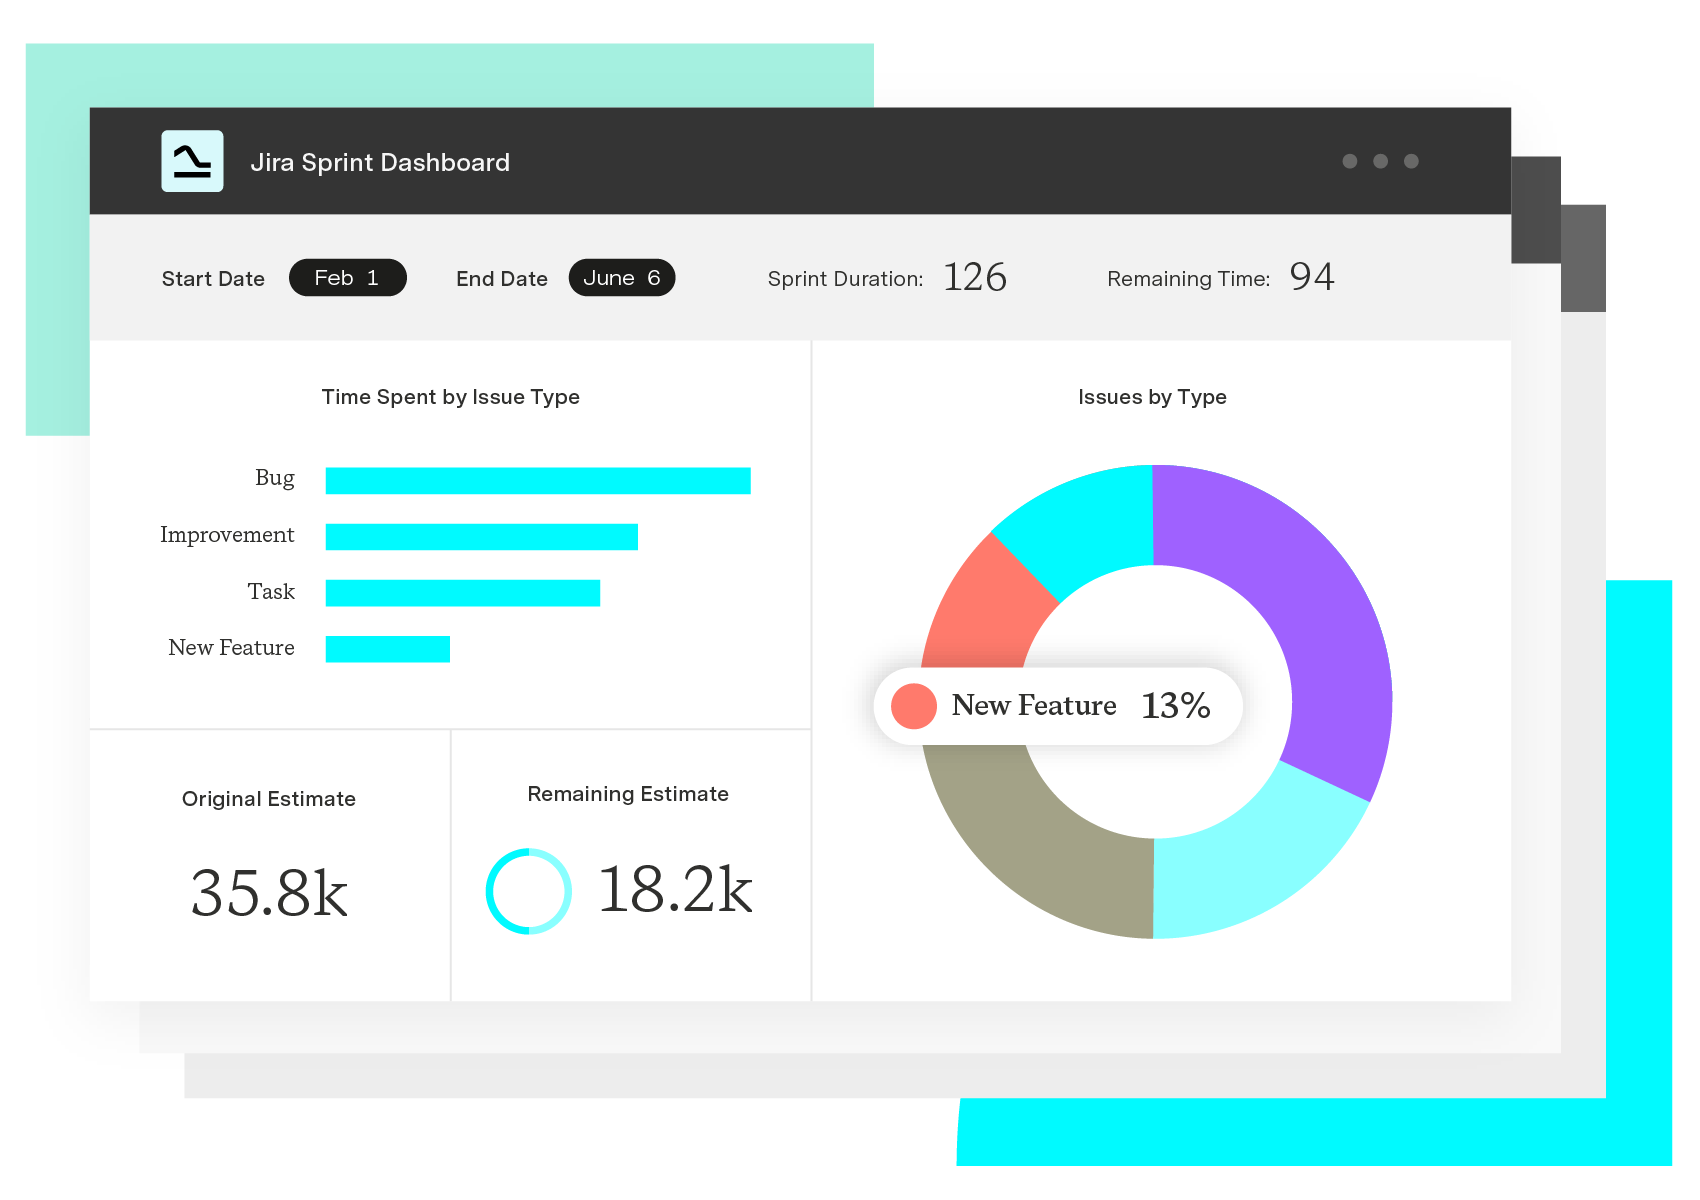
To surface time in status on your dashboard, request access from your Jira administrator. Once approved, activate the "Days in column" option to see time spent in each workflow status. The number and color of the dots show how many days an issue has sat under that status, so teams can flag stagnant work and reprioritize.
This option counts every day, including weekends and holidays — not just working days. It also doesn't track hours, so it isn't a fit for short-term workflows.
The other route is to build custom fields, automation rules, or Control Charts for statuses on every story or issue. That works, but the setup is labor-intensive.
The Atlassian Marketplace offers Jira add-ons that gather, analyze, and deliver time-in-status reports straight to user and project dashboards. Depending on the add-on, these third-party tools can surface:
Time average
Assignee time
Entrance date
Time in status per date
Status count
Transition count
Cycle and lead time
To enable Jira's native time-in-status reports:
1. Select the gear icon to access "Settings" 1. Click "Issues" > "Custom Fields" 1. Input "Time in status" into the "Name this field" variable 1. Configure settings as needed 1. Manually update the field's value for each transition between time in statuses
For a third-party option, Tempo's Custom Charts app plugs into Atlassian Jira and Confluence. Here's what it does:
Leveraging existing statuses: Custom Charts tracks issues using the three primary statuses — To do, In progress, and Review.
Time assessment: The time-spent feature lets managers gauge team performance based on how long an issue sits in each status. When something drags, the data points to the obstacle.
Workflow streamlining: Time-in-status analysis surfaces bottlenecks and delays, giving managers something to act on.
Report generation: With time-in-status data, users can build burnup and burndown reports and combine them with data from other time-tracking apps like Tempo's Timesheets.
Streamlining the tech stack: Instead of stitching together multiple tracking apps, Custom Charts for Jira monitors issue history, sprint progress, sprint velocity, and project health in one place.
Benchmarking: Custom Charts compares time in status and other metrics across sprints, epics, and assignees, helping managers spot complex sprints, underprioritized epics, or overloaded team members.
Time-in-status metrics streamline workflows and improve efficiency in a few common ways.
Jira's time-in-status reports show how issues progress through the workflow. Managers use that view to remove inefficiencies and roadblocks, then track whether the changes actually raised throughput.
Time-in-status reports show how long the team takes to resolve issues or tickets. Plotting status evolution over time lets teams analyze task duration and pinpoint where extra support is needed.
Track time spent per assignee to see how long each person takes on comparable work. The data reveals individual strengths and coaching opportunities.
Tempo's Custom Charts app helps you find high-impact workflow improvements across Jira Cloud, Server, and Data Center. It tracks metrics like average time in status, cumulative spend, and sprint progress. Users can build personalized charts and dashboards to analyze KPIs and catch roadblocks before they hit productivity.
Take control of your team's workflows with time-in-status insights and watch effectiveness climb.
Custom Charts for Jira
Build charts and dashboards to evaluate delivery, capacity, and speed for all teams with Jira's most flexible custom reporting app
Start a Free TrialCouldn't find what you need?Go to our documentation
For the project manager, tracking time in status helps with the following functions: Identifying bottlenecks and roadblocks Setting realistic timelines Measuring productivity Exposing workflow trends and patterns Tracking performance improvements
Visualizing time spent in each status allows team leaders to identify numerous widespread issues: Inefficient workflows Insufficient resources Performance trends Response timelines for specific tasks Vague requirements
Tempo’s Custom Charts for Jira allows users to export time-in-status reports using Excel, Google Sheets, or CSV format.
We reveal why you just don't want or need a dedicated Jira time in status app to find bottlenecks. You want something like Custom Charts.

Discover blockers, assess workloads, and find out how long projects are taking, in a range of eye-catching charts on time in status in Jira.

Measure how long Jira issues take to close, broken down by status. The resolution time report turns workflow drift into a number you can act on.

Knowing the status of work is just as important as knowing when it will finish. See an aggregate of how long work takes for future estimation.
See where your team's hours actually went. Slice Jira time data by status, issue type, project, or label to align effort with priorities.

If you’re looking to optimize employee productivity, look no further than Tempo’s guide to measuring and improving employee productivity reports.

Learn how lead time vs cycle time reveals where work slows down, and why tracking both is essential for reliable delivery and strategic forecasting.

Stay on top of project progress by integrating RAG status reporting in your process to help everyone understand how the team is performing.

Master the jobs-to-be-done (JTBD) framework to reduce product failure risk and boost customer satisfaction through better need identification.
















