

Visualize Jira issues by status, assignee, priority, or any custom field. Custom Charts for Jira makes pie charts ready in minutes – no JQL required.
Custom Charts for Jira brings jira bar graph into Jira so teams can plan, report, and act on the same data.

A good bar chart does in five seconds what a status meeting does in 30 minutes. It shows where the work is, who has it, and which categories are growing or shrinking. For Jira teams, the bar chart is the workhorse of dashboard reporting — the one visualization that handles sprint progress, ticket distribution, time spent, and a dozen other questions without forcing anyone to learn JQL.
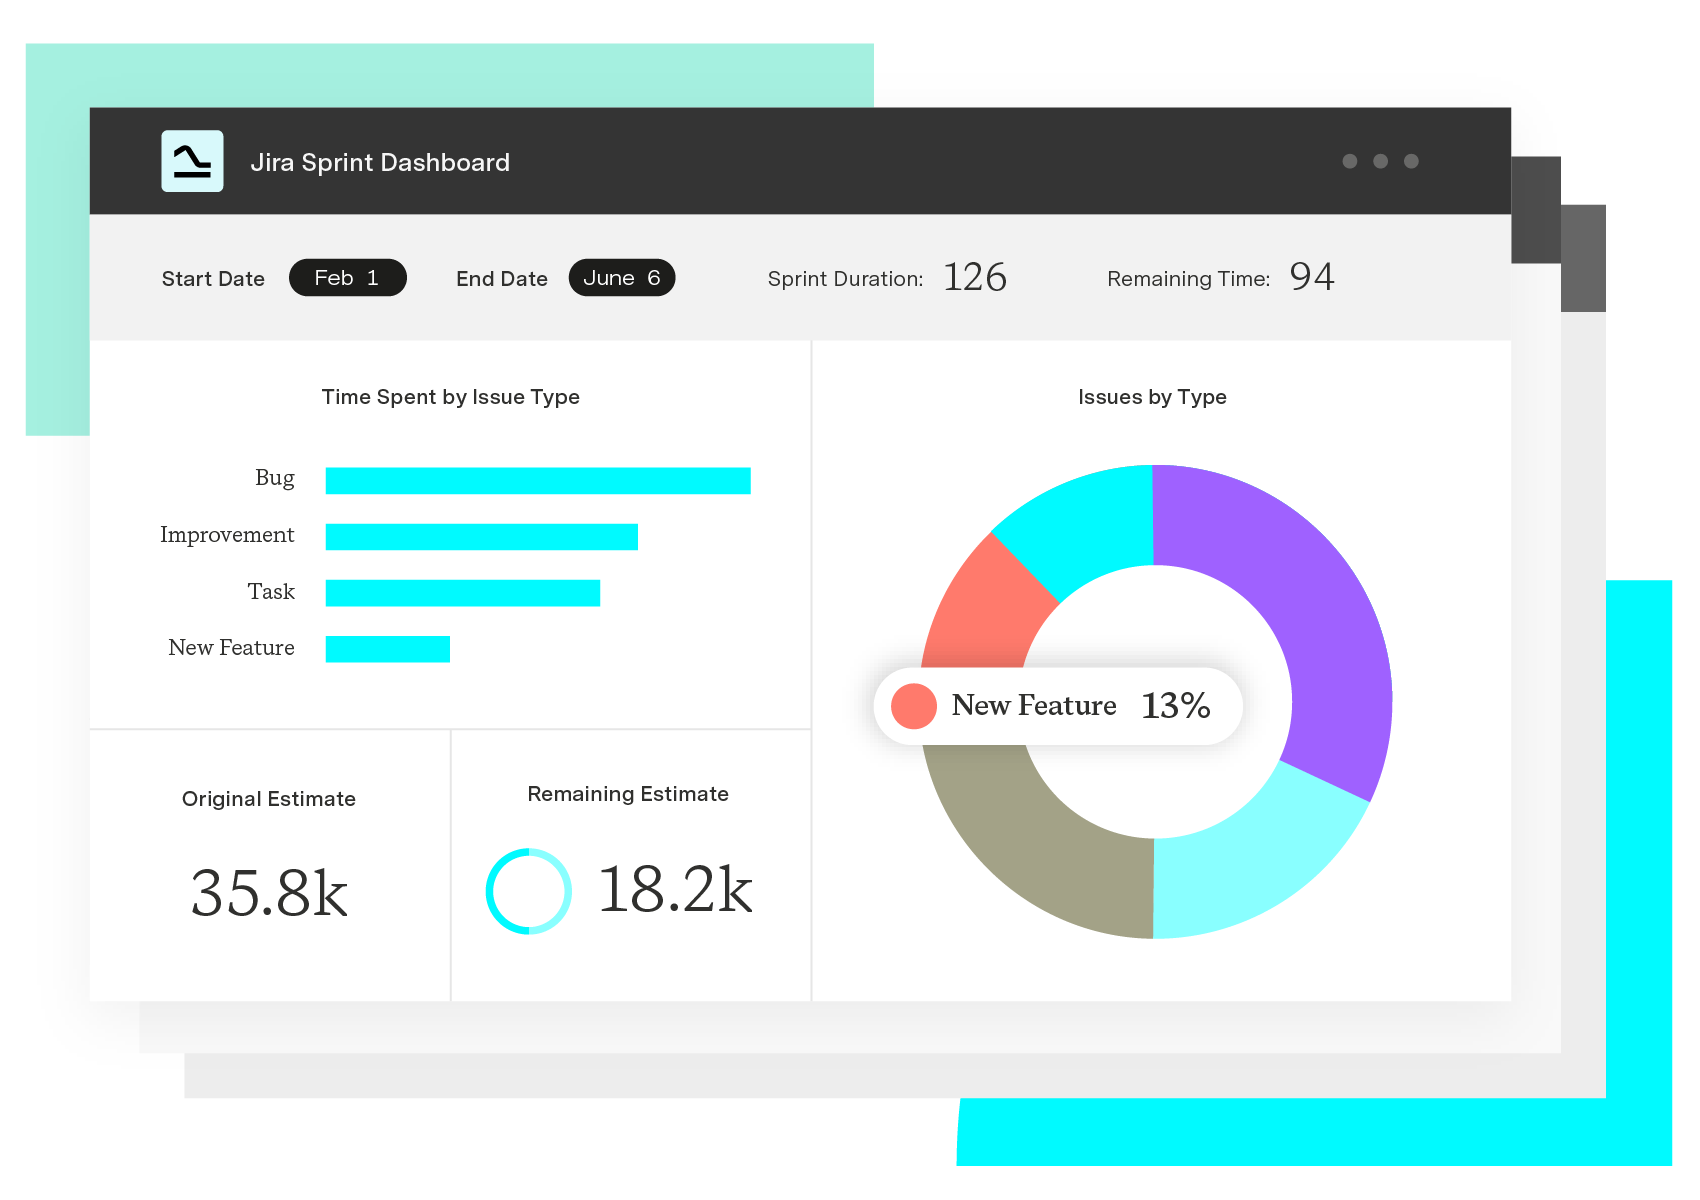
A bar graph in Jira is a chart gadget that renders issue data as horizontal or vertical bars on a dashboard or Confluence page. Each bar represents a value — a count of issues, a sum of hours, a total of story points — grouped by a chosen field such as assignee, status, priority, sprint, or component.
Bars come in three shapes: Simple, grouped, or stacked. A simple bar chart compares values across one dimension. A grouped bar chart adds a second dimension, like issues per assignee broken down by status. A stacked bar chart places the second dimension on top of the first, so total bar height shows the overall total while each segment shows the contribution of a sub-category.
Bar graphs work best when the audience needs to compare quantities at a glance. Status totals across a release. Hours logged per account. Bug counts per component. Anywhere the question is "how do these categories stack up against each other?", bars answer it faster than a table.
Comparison at a glance. Bars make relative size obvious — the longest bar is the biggest number, no decoding required.
Two dimensions in one view. Grouped and stacked bars surface category-within-category relationships without a second chart.
Dashboard-ready for any stakeholder. Bars are universally readable, which matters when execs, PMs, and developers all share the same dashboard.
Fast iteration. Change the grouping field, the data source, or the color mapping in seconds without rebuilding the chart.
Pick the question first. "Which assignees have the most open bugs?" needs a simple bar chart grouped by assignee. "How is bug count distributed across components, broken out by priority?" calls for a stacked bar chart. "How does sprint velocity compare across the last six sprints?" maps to a grouped bar chart over time.
Choose the data source. Most bar chart gadgets pull from a JQL query, a saved filter, a board, or a project. JQL gives the tightest control — any combination of fields, operators, and functions Jira supports. Filters and boards are easier for teams that already curate views.
Set the grouping field. This is the field whose values become the bars. Status, assignee, priority, component, sprint, fix version, and any custom field with discrete values all work. For numeric fields, the chart sums or averages within each bar.
Customize the visual. Reorder bars, merge or rename values, set explicit colors per category for brand consistency, and add labels or descriptions so the chart explains itself when a stakeholder lands on the dashboard cold.
Custom Charts for Jira is the dashboard reporting app teams use when Jira's native gadgets run out of room. It supports more than ten chart types, including bar, 2D grouped bar, and 2D stacked bar — the three configurations most teams need for portfolio and sprint reporting.
Custom Charts pulls data from JQL, saved filters, boards, or projects, and groups by any standard or custom Jira field, including third-party fields from Scriptrunner, Xray, and other apps. For Tempo customers, it pulls Timesheets data — worklogs by author, account, issue type, or estimated versus actual — and Structure PPM hierarchies, so teams can chart hierarchical or time-tracking data the same way they chart ticket counts.
The customization layer is where Custom Charts earns its keep. Color pickers map specific values to specific colors, so red always means blocked and green always means done across every dashboard in the org. Merge and rename collapses messy field values into the categories that matter.
Custom ordering puts the most important bars first instead of leaving them in alphabetical order. The same gadget renders on Jira dashboards or Confluence pages, so the executive who only opens Confluence sees the same chart the team sees in Jira.
Custom Charts for Jira
Build charts and dashboards to evaluate delivery, capacity, and speed for all teams with Jira's most flexible custom reporting app
Start a Free TrialCouldn't find what you need?Go to our documentation
A grouped bar chart places sub-category bars side by side within each main category, making it easy to compare sub-categories directly. A stacked bar chart places sub-category segments on top of each other within a single bar, making it easier to see the total per category while still showing the breakdown. Use grouped when comparison between sub-categories matters most, stacked when totals matter most.
Yes. Most dashboard chart gadgets, including Tempo Custom Charts for Jira, accept a JQL query as a data source. This gives the broadest filtering – any combination of fields, operators, and functions Jira supports – and lets the chart update automatically as new issues match the query.
Configure the chart's grouping field to point at the custom field. Custom Charts supports standard Jira fields, custom fields, and third-party app fields including those from Scriptrunner, Xray, Advanced Roadmaps, and Insight. Numeric custom fields are summed or averaged per bar; text and select-list fields create one bar per value.
Custom Charts for Jira pairs with Custom Charts for Confluence to render the same chart on either surface, with edits to the underlying data flowing through automatically. This matters for teams whose stakeholders live in Confluence rather than Jira – the chart shows up where the audience already is, without an export.
Visualize Jira issues by status, assignee, priority, or any custom field. Custom Charts for Jira makes pie charts ready in minutes – no JQL required.
Search and filter Jira data without JQL. The Custom Charts simple search gadget lets any team member self-serve reports from a dashboard.
Colors, tables, advanced JQL search, and anything else you need to create the perfect visualizations in Jira and Confluence with Custom Charts.

Streamline report generation by learning to use JQL to conduct advanced searches within Jira. Then, boost productivity by saving and reusing queries.

Jira swimlanes are a great way of dividing up and categorizing the issues on your Jira agile board. Find out how to use them and quick filters.
Build a workload management dashboard in Jira with Custom Charts. See assignee load, WIP, and time in status on one screen to rebalance work fast.
Jira uses three top add-ons for calculations and scripting are: ScriptRunner for Jira Jira Misc Custom Fields (JMCF) and Power Scripts for Jira.

Explore how Jira plugins for Outlook enhance project management by automating task creation from emails and simplifying file attachments.




















