ScriptRunner-powered Jira dashboards for managers and Scrum Masters
Tempo Team
Managers, team leaders, and Scrum Masters often want to know more than the status and priority of tasks, or the workload of the team. Sometimes they have more specific questions they need to answer. Usually it’s because they need to manage stakeholder expectations and provide clear explanations to the higher levels of the organization as to whether company projects are on track.
In this article, we’ll explore some of the questions managers and Scrum Masters may have. Then we’ll look at how to answer them visually on Jira dashboards with Jira Query Language (JQL) functions from Adaptavist’s ScriptRunner and our dashboard reporting tool, Custom Charts for Jira.
This article uses ScriptRunner functions that are available in Jira Cloud, using the ScriptRunner Enhanced Search feature. ScriptRunner for Data Center/Server has different functions. Find out more about the differences between ScriptRunner for Jira Cloud and Jira Server.
Answering complex questions about your data with Jira Query Language
You might want to know why the team wasn’t able to complete all the work on time. Or find out what blockers or dependencies on other teams are affecting the flow of work. You can find answers to complex questions like these using Jira Query Language. JQL allows you to really narrow down and home in on your issues, which is useful when you’re monitoring or investigating why something is happening.
All JQL queries can be saved in Jira as filters, which means you can then use them to build out reports. Most native Jira dashboard gadgets (as well as ones from Atlassian Marketplace apps) rely on saved filters to determine which issues display in each one.
Using JQL natively means using the standard JQL functions that Atlassian provide. But if you’re not able to formulate your question using the default functions, you’ll need a Marketplace app. Our favorite option is ScriptRunner for Jira from Adaptavist. This comes with some fantastic JQL functions that you can add to your collection of saved filters and start making the dashboard reports you really need.
Let’s dive in to a few of the questions managers may have, and how to make the following reports to answer them:
Sprint Scope Creep 2D Stacked Bar Chart – a report that shows which sprints had story points added after they started, and who added them
Blockers/Dependencies Issue List – a list of details for issues that are blocking other work
Due Date Monitoring 2D Stacked Bar Chart – a report that shows which issues were resolved after their due date versus which were resolved before
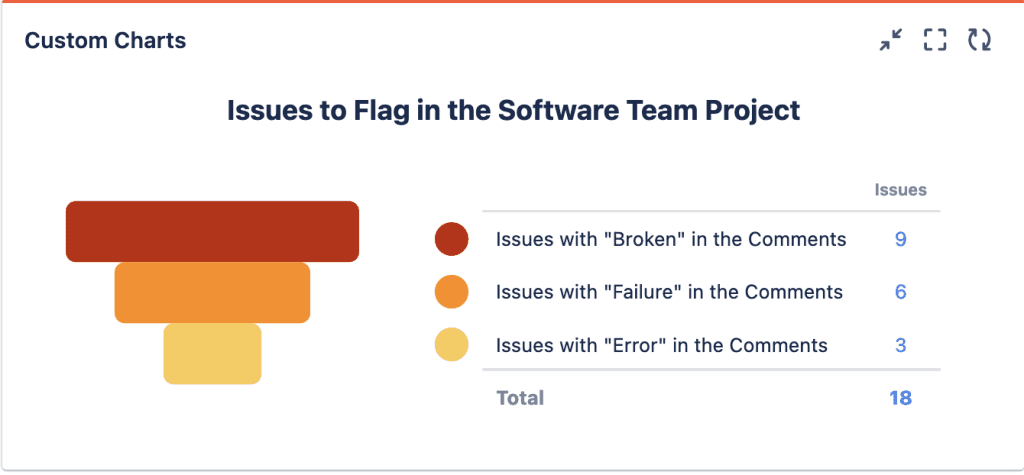
Issues To Watch Funnel Chart – a report that shows issues that have potentially serious implications
Sprint Scope Creep 2D Stacked Bar Chart
Teams that work in sprints decide on the scope of the sprint, i.e. how many issues they’re going to complete, before they start. When issues get added after the sprint has started, this is scope creep, which can affect or delay the completion of the originally planned work. So, you might want to ascertain if scope creep is causing your team to not be able to complete their committed scope, or perhaps you just want to track scope creep over time in order to monitor how well your sprints are being planned.
Natively, there’s no way of having scope creep information easily displayed on a Jira dashboard. You would have to navigate to your board and generate a Sprint Report.
However, if you use the following ScriptRunner JQL function and save it in ScriptRunner Enhanced Search as a filter, you can make a variety of scope creep charts on the dashboard using Custom Charts for Jira.
addedAfterSprintStart()
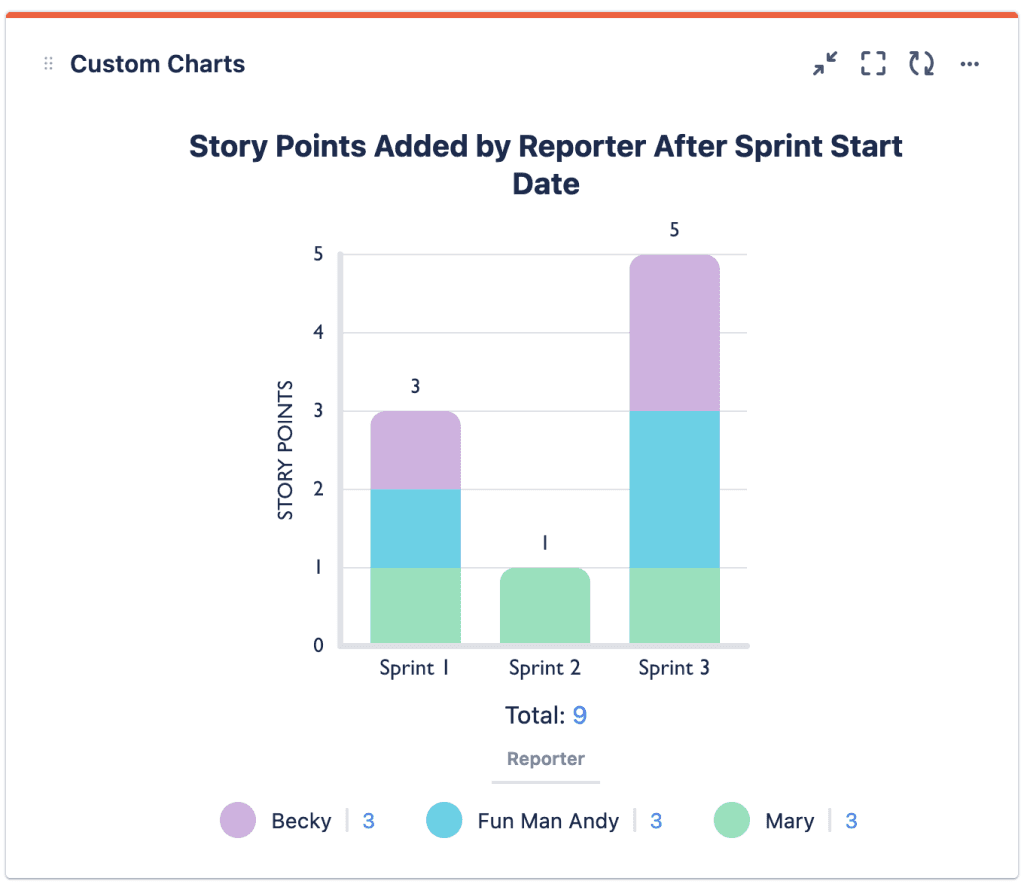
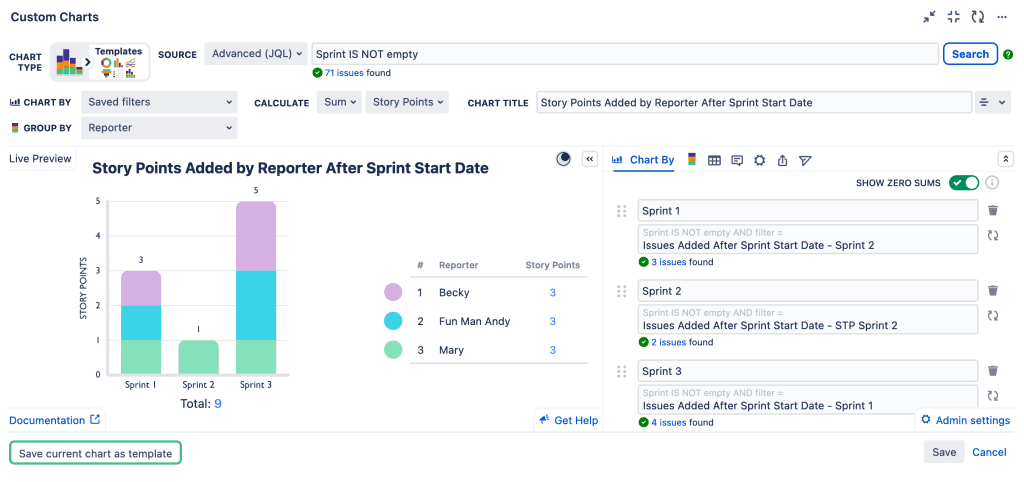
In the report below, we’ve chosen a 2D stacked bar chart to show which sprints have been affected by scope creep. We want to pull in issues across all our active sprints, which means we need to choose “Advanced (JQL)” as the Source for the chart, and enter the JQL statement “Sprint IS NOT empty”. (By contrast, the statement “Sprint IS empty” would pull issues from everywhere but your active sprints, i.e. the backlog.)
In the Chart By we’ve selected “Sprint” and in the Group By we’ve selected “Reporter”. That way, we can see who’s adding the extra issues. You could also Group By “Projects” to see which projects the issues are being added from.
If you’re a development team that uses story points, you’ll probably find issue count less helpful when trying to investigate scope creep. So, in the chart below, we’ve changed the calculation from a count of issues to a sum of story points instead.
Blockers/Dependencies Issue List
Dependency reporting can identify bottlenecks and help you analyze missed deadlines by highlighting where delays may have occurred. ScriptRunner offers the following JQL function that lets you search for issues that are blocking other work.
linkedIssuesOf
Use this to search for open issues with a link type of “blocks” (or, if you have a custom link type you’ve created to denote blockers, use that) and save as a filter.
issueFunction in linkedIssuesOf(resolution is Empty, “blocks”)
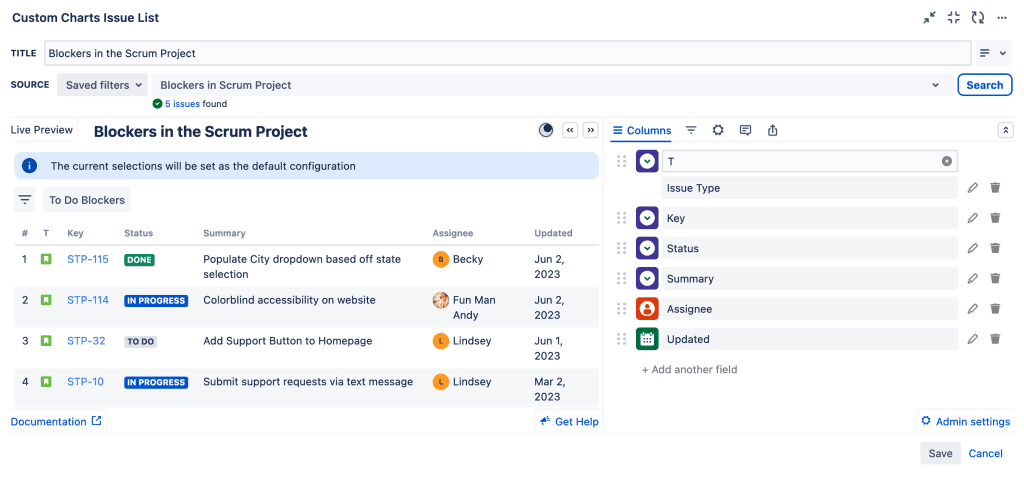
You can then use the Custom Charts Issue List, a separate gadget that comes with Custom Charts for Jira, to produce a list of details for the issues blocking work. Simply choose “Saved Filters” as the Source for your Issue List, and select the blockers filter you just made. If you want to, you can add quick filters such as “To Do Blockers” to show blockers that have not made any progress at all. It would be good to keep an eye on said issues because more and more work could start building up behind them if they’re not worked on soon.

Due Date Monitoring 2D Stacked Bar Chart
If due dates are getting missed, this can tell a manager one of a few things: the team aren’t coping with the workload, the due dates aren’t reasonable for the amount of work required, or there is a lack of concern or awareness of due dates among the team.
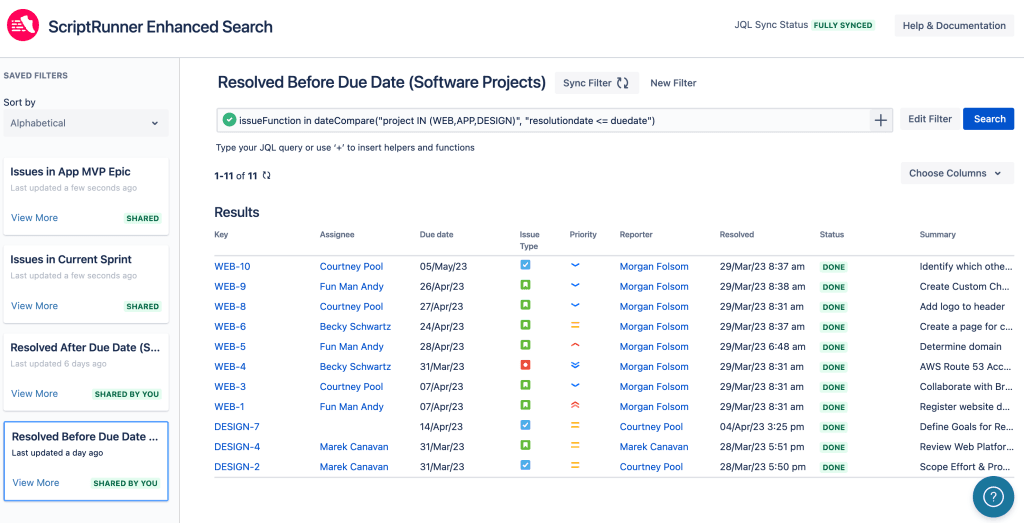
You can use the ScriptRunner JQL function “dateCompare” to track due dates met versus missed. Here you will need to create two ScriptRunner Enhanced Search filters to use in your chart. First, search for issues resolved before the due date in your chosen project and save as a filter.
issueFunction in dateCompare (“”, “resolutiondate <= duedate”)
Next, search for issues resolved after the due date in your chosen project and save this as your second filter.
issueFunction in dateCompare (“”, “resolutiondate > duedate”)
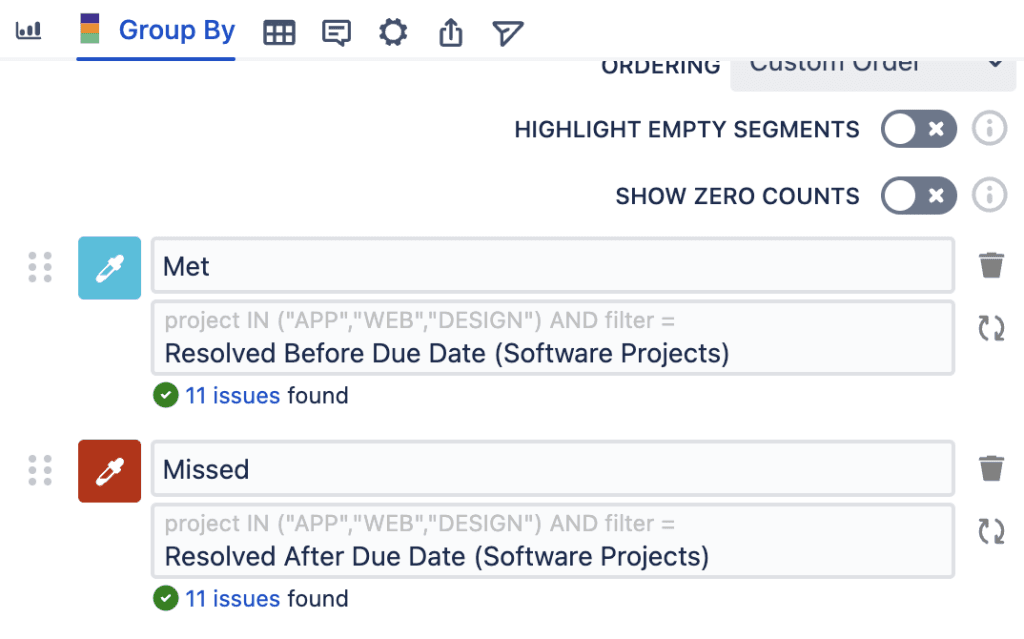
Then, to make the 2D stacked bar chart below, select “Projects” as your Source and check the box for your desired project. Select “Due Date” from the Chart By dropdown and “Saved Filters” from the Group By dropdown. On the right side of the gadget in the “Group By” tab, you can add the two Scriptrunner Enhanced Search filters to track both on your 2D chart.
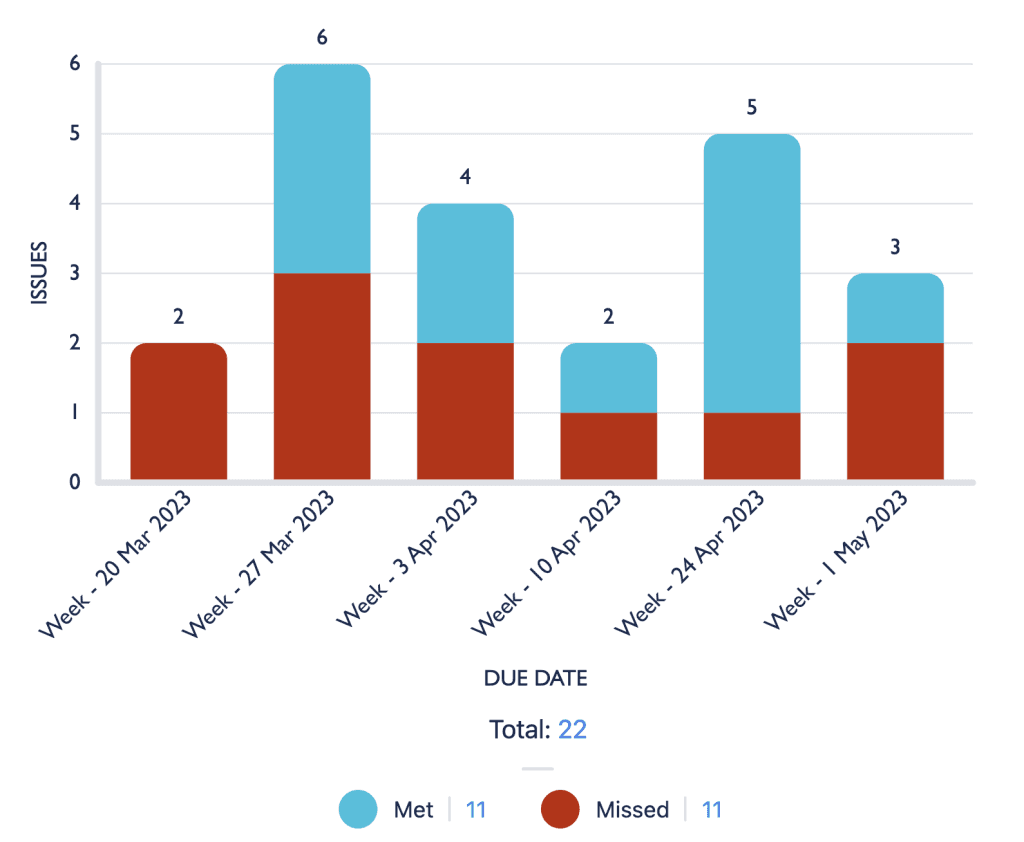
Now you have an at-a-glance visual of how many due dates are being met and how many are being missed. A manager can click on a section of the bar chart and see a list of the tickets in question to investigate further and work out whether the missed deadlines are a workload issue, an estimation problem, or because a certain assignee is having difficulties.
Issues To Watch Funnel Chart
ScriptRunner comes with a very useful JQL function that lets you search for specific text in issue comments. For example, you might want to search for the words “error”, “broken” and “failure” to find issues that could have more serious implications. That way, Scrum Masters can quickly identify issues as items to watch or flag. A report that highlights these issues is also great for managing the expectations of higher-level managers and executives.
To build this out, you first must create three different Scriptrunner Enhanced Search filters using their function, “issueFieldMatch”:
issueFunction in issueFieldMatch(“”, “comment”, “Broken”)
issueFunction in issueFieldMatch(“”, “comment”, “Error”)
issueFunction in issueFieldMatch(“”, “comment”, “Failure”)

Once you’ve saved the three filters, you can build a chart in Custom Charts that displays the results of the queries for issues in your desired project. Just select “Projects” as the Source, check the box for your project, and in the Chart by dropdown, select “Saved Filters”. On the right side of the gadget in the “Chart by” tab, you can add each of the three ScriptRunner Enhanced Search filters to build out the segments.
Conclusion
Jira dashboards are a great way of visualizing trends and anomalies hidden in large amounts of data. Charts and graphs allow us to quickly notice changes, which makes them great both for investigation and ongoing monitoring. With ScriptRunner, managers can answer questions that they simply can’t out of the box. Custom Charts for Jira then lets them visualize those answers with fully customized and easy-to-grasp reports.
To know more about how to build ScriptRunner queries using ScriptRunner Enhanced Search and implement them in Custom Charts, this video or our step-by-step guide will help.
If you want to try it yourself, you can trial both ScriptRunner for Jira Cloud and Custom Charts for Jira on the Atlassian Marketplace.
Sign up for a demo
Register

