Learn the cost variance formula, how to calculate it, and what it means for your project budget, with real examples and tips to improve cost control.

It’s no secret that project management and overseeing a team can sometimes be chaotic. But while some chaos may come with the territory, it’s still crucial to constantly evaluate what’s working and what’s not in order to improve operations going forward. That’s where project metrics come into play, helping you identify and analyze key details — even after and during the most hectic projects.
By setting benchmarks and continually analyzing project metrics, you can monitor your project’s health, its status, and your team’s performance. Learn about fundamental progress measurements, and use these project metrics examples and practical tips to implement a metric-based evaluation system in your workflows.
Project metrics are quantifiable measures for tracking and assessing a specific initiative’s status. These could include details like how long tasks typically take to complete and budget allocation throughout the lifecycle.
Think of project metrics like the vital signs for your project’s health. When you have a physical exam, your doctor checks multiple health metrics, including blood pressure, weight, and heart rate. If they take one of these measurements, they miss crucial information for a diagnosis or treatment plan.
The same concept applies to project metrics — you need to consider a comprehensive set of measurements for an accurate and holistic picture of team and project performance.
While often used interchangeably, KPIs differ from project metrics in that they evaluate overall achievement — rather than measuring focused components or stages of a project’s lifecycle. Project metrics are unique to tracking the progress and health of a project. Alternatively, KPIs gauge broader organizational performance and broader success against business objectives.
KPIs are long-term goals to support the business’s overarching mission, such as to acquire a certain number of new customers in a given timeframe. Project metrics are more focused goals specific to an endeavor, such as to complete a set of tasks within an established project budget.
Meticulous tracking, analyzing, and reporting benefits project managers in many ways, but there are some key advantages these metrics provide across all teams. Establishing significant metrics and integrating an analysis system into your project plan will help you with the following management components.
Project metrics set the stage for data-driven decision-making. You can use quantifiable data gathered throughout your team’s work to prioritize product development initiatives, identify improvement areas for communication and efficiency, and produce better deliverables. These metrics take the guesswork out of your strategizing, letting you make informed decisions rather than relying on assumptions or inaccurate information.
Tracking metrics specifically related to employee performance, such as task completion times, presents opportunities to boost productivity and focus. These measurements can also reveal weaknesses in your organizational structure. When you understand your team’s pain points, you can provide targeted training and development, helping employees reach their full potential.
In the mad dash to meet deadlines, resource waste can abound. Project metrics help you identify wasteful spending decisions, material allocation, and poorly distributed tasks before they bust your budget and frustrate stakeholders. When you understand the causes of overspending or misallocated resources, you can shift your approach and correct the course to avoid project scope creep.
Whether you’re using agile, Kanban, or another project management framework, it’s critical to ensure you’re producing high-quality results. Using project management metrics can help you assess the efficacy of your management framework and ensure it aligns with your company’s needs.
To bolster your system, you can also incorporate metrics into project management software like Jira and Asana. Managing budget and profitability metrics through these platforms is particularly straightforward, making it easy to comprehend your project’s financial standing at a glance.
Analyzing project performance makes the overall work process more transparent and open among involved parties. Metrics encourage accountability because they set specific and transparent expectations, letting you closely monitor team member performance. And from an external stakeholder perspective, clear metric reporting showcases that the team is on track to deliver the desired results.
Gain early access to Public Shared Dashboards and shape the future of external reporting in Custom Charts.
Request to Join the EAPWhile every team uses a unique set of metrics, there are several fundamental measurements that all managers should consider. Here are the top 10 metrics managers typically incorporate.
SV measures the difference between a project’s planned and actual progress. If you estimate that the project will take 100 days to complete but it takes 110 days, you can use the SV to determine the percentage of variance.
Formula: SV (actual calendar days – planned calendar days) + start variance) / planned calendar days x 100
CV indicates how over or under budget your project is. A negative figure indicates you’ve surpassed your budget, whereas a zeroed-out equation or positive figure signifies you’re in good financial standing.
Formula: CV = projected cost – actual cost
ROI represents the overall profitability of your project.
Formula: (Net profit / cost of investment) x 100
AC is a raw calculation of how much a team spent at project closure. This includes all direct resources, like raw materials and labor, as well as indirect costs, like building rent and utilities.
Formula: total direct costs + total indirect costs
PV represents the estimated value of work planned in a certain timeframe.
Formula: (planned % complete) x (budget at completion)
EV is the value of work completed to date compared to the budget.
Formula: (% of completed work) x (budget at completion)
The CPI helps you understand your project’s cost efficiency. Use this metric to determine whether your project team was wasteful or compliant with the budget.
Formula: EV / AC
SPI examines time usage efficiency. It indicates whether you optimized your allotted days and labor hours or if you frequently ran behind.
Formula: EV / PV
Resource utilization shows how effectively you use resources like material goods, team labor, and time. Ideally, you want to stay close to 100% utilization for the project’s duration.
Formula: (total billable hours / total available hours) x 100
Although success is somewhat subjective, it’s crucial to gauge how satisfied key stakeholders are with your project outcomes. This assessment has no mathematical formula, but managers often evaluate satisfaction using surveys, feedback forms, and focus groups.
There’s no one set of success metrics for a project standard across all organizations. While certain benchmarks span many industries, all managers must choose their ideal combination based on business needs and the project’s nature. Your metric selection should provide granular insights about the project journey while also considering the bigger picture.
Some factors to consider include:
Relevance: Choose metrics that align directly with your objectives.
Measurability: Ensure the necessary data is easy to obtain.
Clarity: Establish metrics that are simple to understand and interpret.
Actionability: Select metrics that provide usable insights.
Consistency: Use the same metrics throughout the project lifecycle.
Implementing project metrics into your management system is daunting — it requires additional planning, extra steps in your operations, and even some math. Luckily, Strategic Roadmaps empowers you to measure what matters using innovative metrics like Rice scores, SPI, and more. With Strategic Roadmaps, you can easily monitor progress and pinpoint roadblocks that may derail your team.
Fully optimize your metric management workflow by pairing Strategic Roadmaps with Custom Charts. We’ve got every tool you need to manage, track, and optimize project work.
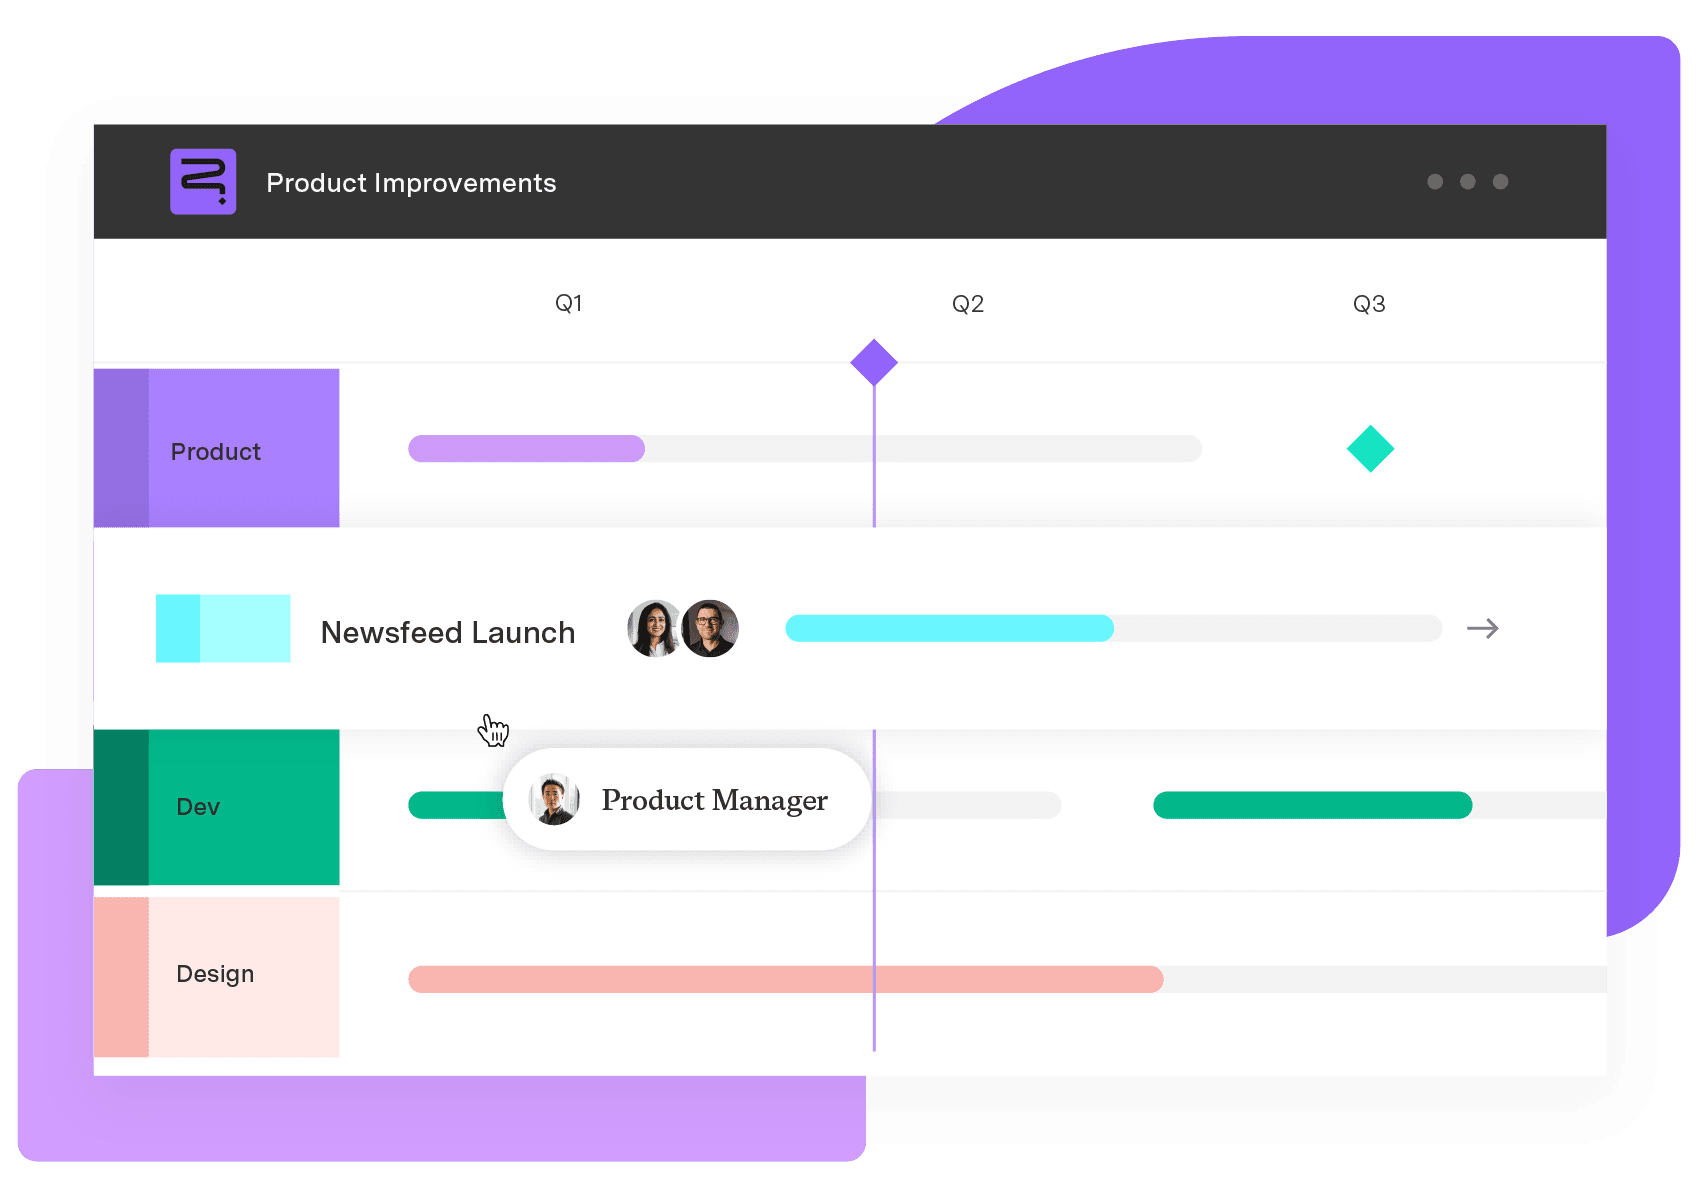
Strategic Roadmaps
Build your portfolio vision with Strategic Roadmaps. With powerful visualization capabilities, you can communicate strategy to the entire organization and gain alignment around strategic objectives, product goals, and milestones.
Start a Free TrialLearn the cost variance formula, how to calculate it, and what it means for your project budget, with real examples and tips to improve cost control.

Do your projects run over budget and behind schedule? Discover the benefits of earned value management for measuring performance and staying on track.

Operational metrics provide real-time insights about the state of your organization so you can proactively solve shortcomings and maximize efficiency.
Discover the difference between project outcomes and outputs and learn how to leverage the correct metrics to gauge impact on organizational goals.

Perfect the basics of project financial management to improve project outcomes, customer satisfaction, and your business’s bottom line.

Knowing which Agile at Scale metrics will best track your team’s productivity and success helps you set realistic KPIs and improve performance.

DORA metrics help DevOps teams measure speed and quality and achieve consistent results. Learn how to gauge these KPIs and boost performance.

Selecting portfolio management dashboards and metrics that drive decisions and align with how different stakeholders actually work.
Create a project dashboard to track progress, enhance collaboration, and streamline workflows with actionable insights.